logo
For Power BI
  • Products
    • Drill Down Donut Pro Drill Down Donut PRO
    • Drill Down Pie Pro Drill Down Pie PRO
    • Drill TimeSeries Pro Drill Down TimeSeries PRO
    • Drill Combo Pro Drill Down Combo PRO
    • Drill Map Pro Drill Down Map PRO
    • Drill Scatter Pro Drill Down Scatter PRO
    • Drill Down Network Pro Drill Down Network PRO
    • Drill Down Waterfall Pro Drill Down Waterfall PRO
    • Drill Down Graph Pro Drill Down Graph PRO
    • Drill Down Timeline Pro Drill Down Timeline PRO
    • Drill Down Combo Bar PRO Drill Down Combo Bar PRO

    Video tutorials

    Watch Now

    More than 90 videos on how to enhance Power BI with ZoomCharts

    Learn more
    All visuals
  • Resources

      Resources

    • Documentation
    • Report Examples
    • Blog
    • Webinars
    • Video Tutorials
    • Visuals Gallery

    Support

    • ZoomCharts Assistance
    • Contact Sales
    • Contact Support
    • FAQ

    Challenges

    Challenges

    Improve your report creation skills by participating in free challenges for report creators.

    Learn more
    Start trial
  • Services
    • Power BI Report Development
    • Custom Visual Development
  • Challenges
  • Pricing
Request a quote Start Free Book a Demo Sign in
Get it now
Go back

Contents

Go back

Share

Logo

Welcome to the FP20 Analytics December 2024 Challenge!

Dec 12 - Jan 15, 2024 | EST

Join Challenge 22 and create a Power BI report that uncovers key trends and insights from Christmas sales.

Timeline

Winner Announced

Winner Announced

16 January | 10:00

-

Registration Open

Registration Open

12 December | 19:00

-

Submissions Open

Submissions Open

12 December | 19:00

-

Workshop | How to Analyze Christmas Sales & Trends in Power BI

Workshop | How to Analyze Christmas Sales & Trends in Power BI

17 December | 09:00

-

1:1 Mentoring Sessions

1:1 Mentoring Sessions

17 December | 09:00

12 December - 11 January

Entry Submission Deadline

Entry Submission Deadline

11 January | 19:00

12 December - 11 January

Webinar | Reviewing the TOP 5 Reports of Christmas Sales & Trends

Webinar | Reviewing the TOP 5 Reports of Christmas Sales & Trends

16 January | 11:00

12 December - 11 January

Dataset

Get the dataset

See past FP20 Analytics challenges

See past challenges

Share the challenge

Submitted Reports
About challenge
How to participate
The Brief
Judging criteria
Timeline
Dataset
Past challenges

Winner of the challenge

Report Card

Christmas Sales and Trends Analysis

Author: Agbata Dickson Ukolojo

9

View Report

All Submissions

Report Card

Christmas Sales Report

Author: Andreas Miftakhul Pratama

13

View Report
Report Card

Christmas Sales Report

Author: Chakradhar Mantena

8

View Report
Report Card

Christmas Customer Behavior Analysis

Author: Ugochukwu Nwasuruba

5

View Report
Report Card

Christmas Sales Report

Author: Akhilesh Raut

1

View Report
Report Card

Christmas Sales and Trends Analysis

Author: Sushree Jena

0

View Report
Report Card

Xmax Sales & Trends

Author: Phan Thanh Doan

1

View Report
Report Card

Xmas Shopping Canada Dashboard

Author: Norman Reynaldo Sabillon Castro

1

View Report
Report Card

Christmas Sales & Trends

Author: Sweety Antoni David

0

View Report
Report Card

Xmas Gift Sales

Author: Eniola Adekoya

1

View Report
Report Card

Christmas Challenge Report

Author: Steven Stanford

0

View Report
Report Card

Christmas Sales Trends

Author: Rigoberto Garcia

0

View Report
Report Card

Christmas Sales Report

Author: Biokpo (Victor) Amachree

1

View Report
Report Card

Christmas Sales and Trends

Author: Vaishali Rishi

0

View Report
Report Card

ZoomCharts Christmas Analytics Challenge December 2024

Author: Sajid Shaikh

0

View Report
Report Card

Christmas Sales Report

Author: Talwa Valluvar

0

View Report
Report Card

Xmas Sales Report

Author: Weronika Kokorzycka

0

View Report
Report Card

Christmas Sales Report

Author: Muhammad Naveed Ziai

0

View Report
Report Card

Christmas Sales Report

Author: Md Mizanur Rahman Nayan

5

View Report
Report Card

Zulay Vivas de Arrieta

Author: Zulay Vivas

3

View Report
Report Card

Xmas Sale Report

Author: Jithil John

4

View Report
Report Card

FP20 Xmas Analysis

Author: Igboejesi Chidera

0

View Report
Report Card

Christmas Sales and Trends

Author: Ethan Guyant

4

View Report
Report Card

Christmas Sales Analysis

Author: Suleman Abdulmalik

5

View Report
Report Card

Christmas Sales Report

Author: Uche Sopuru

0

View Report
Report Card

Christmas Sales and Trends Analysis

Author: Bimbo Oyeyele

0

View Report
Report Card

Christmas Sales Report

Author: Nwanma Jerry

0

View Report
Report Card

Christmas Sales Analysis Report

Author: Shivaraju J

0

View Report
Report Card

Xmas Sales Report

Author: Pier Cardinale

2

View Report
Report Card

Análisis de Tendencias Navideñas

Author: Cynthia Marin Quiroz

1

View Report
Report Card

Christmas Sales Analysis

Author: Ikram Driba

0

View Report
Report Card

The Tale of Two Seasons: Christmas Cheer and Everyday Grind

Author: Evguenia Fonova

0

View Report
Report Card

Christmas Sales and Trends

Author: Pema Namgay

0

View Report
Report Card

FP20 Christmas Sales & Trend Analysis

Author: Justice Ofokansi

0

View Report
Report Card

Christmas Sales Dashboard

Author: Houssam Damerji

3

View Report
Report Card

FP20 Analytics Challenge 22 Christmas Sales and Trends

Author: Hanieh Salimian

0

View Report
Report Card

FP20 Christmas Sales Analysis

Author: Adeola Azeez

0

View Report
Report Card

FP20 Analytics Challenge 22 M. Umer Adeeb

Author: Muhammad Umer Adeeb

0

View Report
Report Card

Christmas Sales Trend Analysis

Author: Saeed Khan

1

View Report
Report Card

Christmas Sales and Trends Analysis

Author: Rachanaben Bhatt

0

View Report
Report Card

Christmas Sales & Trends Analysis 2018-2020

Author: Lashmi Dissanayake

0

View Report
Report Card

Christmas Sales Analysis

Author: Lazeena Rizvi

0

View Report
Report Card

Christmas Sales Report

Author: Emmanuel Idowu

0

View Report
Report Card

🎄Christmas Sales and Trends Analysis🎄

Author: Natnicha Taosiri

0

View Report
Report Card

Christmas Sales Analysis

Author: Rim Jamli

0

View Report
Report Card

Christmas Data Analysis

Author: Richard Mukechiwa

1

View Report
Report Card

Christmas Sales Analysis

Author: Shelly Nagar

0

View Report
Report Card

Christmas Sales & Trends Analysis

Author: Lieumo Njopnu

3

View Report
Report Card

Xmas Sales Report

Author: Andres Rosales Rubione

0

View Report
Report Card

Chrismas Sales Trends Analysis

Author: Miguel Lozano

0

View Report
Report Card

Christmas Sales & Trend Analysis

Author: Rishabh Chauhan

0

View Report
Report Card

Christmas Sales and Trends Analysis

Author: Lalit Mohan Pant

0

View Report
Report Card

Christmas Sales and Trends Analysis

Author: Kalpana Sanikommu

0

View Report
Report Card

Chirstmas Sales & Trends

Author: Qasim Tasawar

3

View Report
Report Card

Christmas Sales Analysis

Author: Hitesh Choudhary

2

View Report

About FP20 Analytics ZoomCharts Challenge

Want to learn to build PRO reports? With personalized feedback and informative workshops, this is your opportunity to take your report-building skills to the next level, build your professional portfolio, and network with like-minded people.

The ZoomCharts challenge is hosted in partnership with FP20 Analytics – a group that unites passionate and inspiring data enthusiasts, and helps new data analysts improve their skills and build a competitive portfolio. Join in and sharpen your skills together with this open and friendly data community. Read more about the challenges on the FP20 Analytics website. Join the community on LinkedIn.

Participate in FP20 Analytics ZoomCharts Challenge to enrich your skill in creating PRO reports that help business users explore data quickly and intuitively. 

  1. Free License: All participants receive a free ZoomCharts Developer License that gives access to the full Drill Down PRO visuals library. License will remain active for 1 year after the challenge.
  2. Learn from Experienced Professionals: As part of the challenge, we host live workshops on report building and visualizing the challenge’s dataset in Power BI. Challenge participants can also book an individual consultation with an experienced Power BI mentor to ask questions and get personalized tips.
  3. Tailored Feedback: Every challenge submission will receive personalized feedback, giving participants the chance to hone their skills and improve their reports.

Prizes

The best report’s creator will receive a $300 Amazon gift card from ZoomCharts. The ZoomCharts winner will be announced in a special live webinar session on January 16th, where we will review the Top 5 entries from the challenge. 

Webinar recordings

Recording thumbnail

How to Analyze Christmas Sales & Trends in Power BI

Don't miss this opportunity to turn Christmas shopping data into powerful business insights 🎄📈

Watch the recording
Recording thumbnail

Reviewing the TOP 5 Reports of Christmas Sales & Trends

Dive into the magic of Christmas Sales & Trends with the top Power BI reports from the FP20 Analytics & ZoomCharts Challenge! 🎁

Watch the recording

How to participate? 

1. Register for the challenge: 

  • Download the Challenge dataset either on this Challenge page or from FP20 Analytics website. 
  • Register for the FP20 Analytics ZoomCharts Challenge. 
  • Activate your free Drill Down Visuals Developer License for Power BI. Read license setup instructions.
  • Read the challenge brief (see "The Brief" section) for additional info about the dataset and to see what questions your report should answer.  

2. Build your report in Power BI: 

  • Set up an account in Power BI using the assigned license details (if you have participated in ZoomCharts Challenges in the past, you can use the same account you set up before).
  • Use the account to access the full library of custom ZoomCharts Drill Down visuals. 
  • Use the dataset to build a Power BI report including at least 2 ZoomCharts Drill Down Visuals in one report page. 
  • The recommended number of pages in the report is up to 3 pages, including drill-through pages. 

3. Improve your report and learn new skills: 

  • To learn more about applying ZoomCharts visuals in your reports, participate in the challenge workshop. 
  • If you have any questions or need advice, you can book a free individual consultation. 
  • Check out the submissions from past challenges for inspiration. 

4. Submit your challenge entry: 

  • Submit your report in .pbix format for validation. 
  • If your submission doesn’t match the challenge criteria, you will be notified by email indicating the reason. Don't worry if this happens! You can fix the issue and resubmit your report. 
  • Together with validation confirmation, you will receive a publish to web link that you can use to add the report to your portfolio or publicly share online. 
  • All validated entries will receive personalized feedback from the evaluation team. You can use this feedback to revise your report and resubmit it before the deadline. Feel free to resubmit your entry as many times as necessary before the deadline. 

5. Finalize your participation to compete for the ZoomCharts grand prize: 

  • (Optional) Upload your publish to web link on NovyPro. If you opt to post your report on NovyPro, for instructions on how to do this, refer to the video link provided. NovyPro: https://www.novypro.com/  
    Instruction Video: https://www.youtube.com/watch?v=jkcAYgFGWUY
  • Post the final version of your submission in PDF format on your LinkedIn profile. 
  • Use the caption "I am participating in FP20 Analytics Challenge 22”. 
  • Include a summary of your report's key insights and add the ZoomCharts publish to web link or NovyPro link. 
  • Use the hashtags #FP20Analytics, #builtwithzoomcharts, tag @Federico Pastor and @ZoomCharts. 
  • Additionally, post your report in the FP20 Analytics LinkedIn Community group. 
  • Follow ZoomCharts on LinkedIn 

6. Attend challenge closing webinar to hear the results: 

  • The submissions are evaluated by ZoomCharts team (see "Judging criteria" for more info). The submissions of Top 5 ZoomCharts Challenge finalists are analyzed live during the challenge closing webinar to share the best practices and learning opportunities with the community. 
  • The author of the best report is awarded with a $300 Amazon gift card.

About the dataset

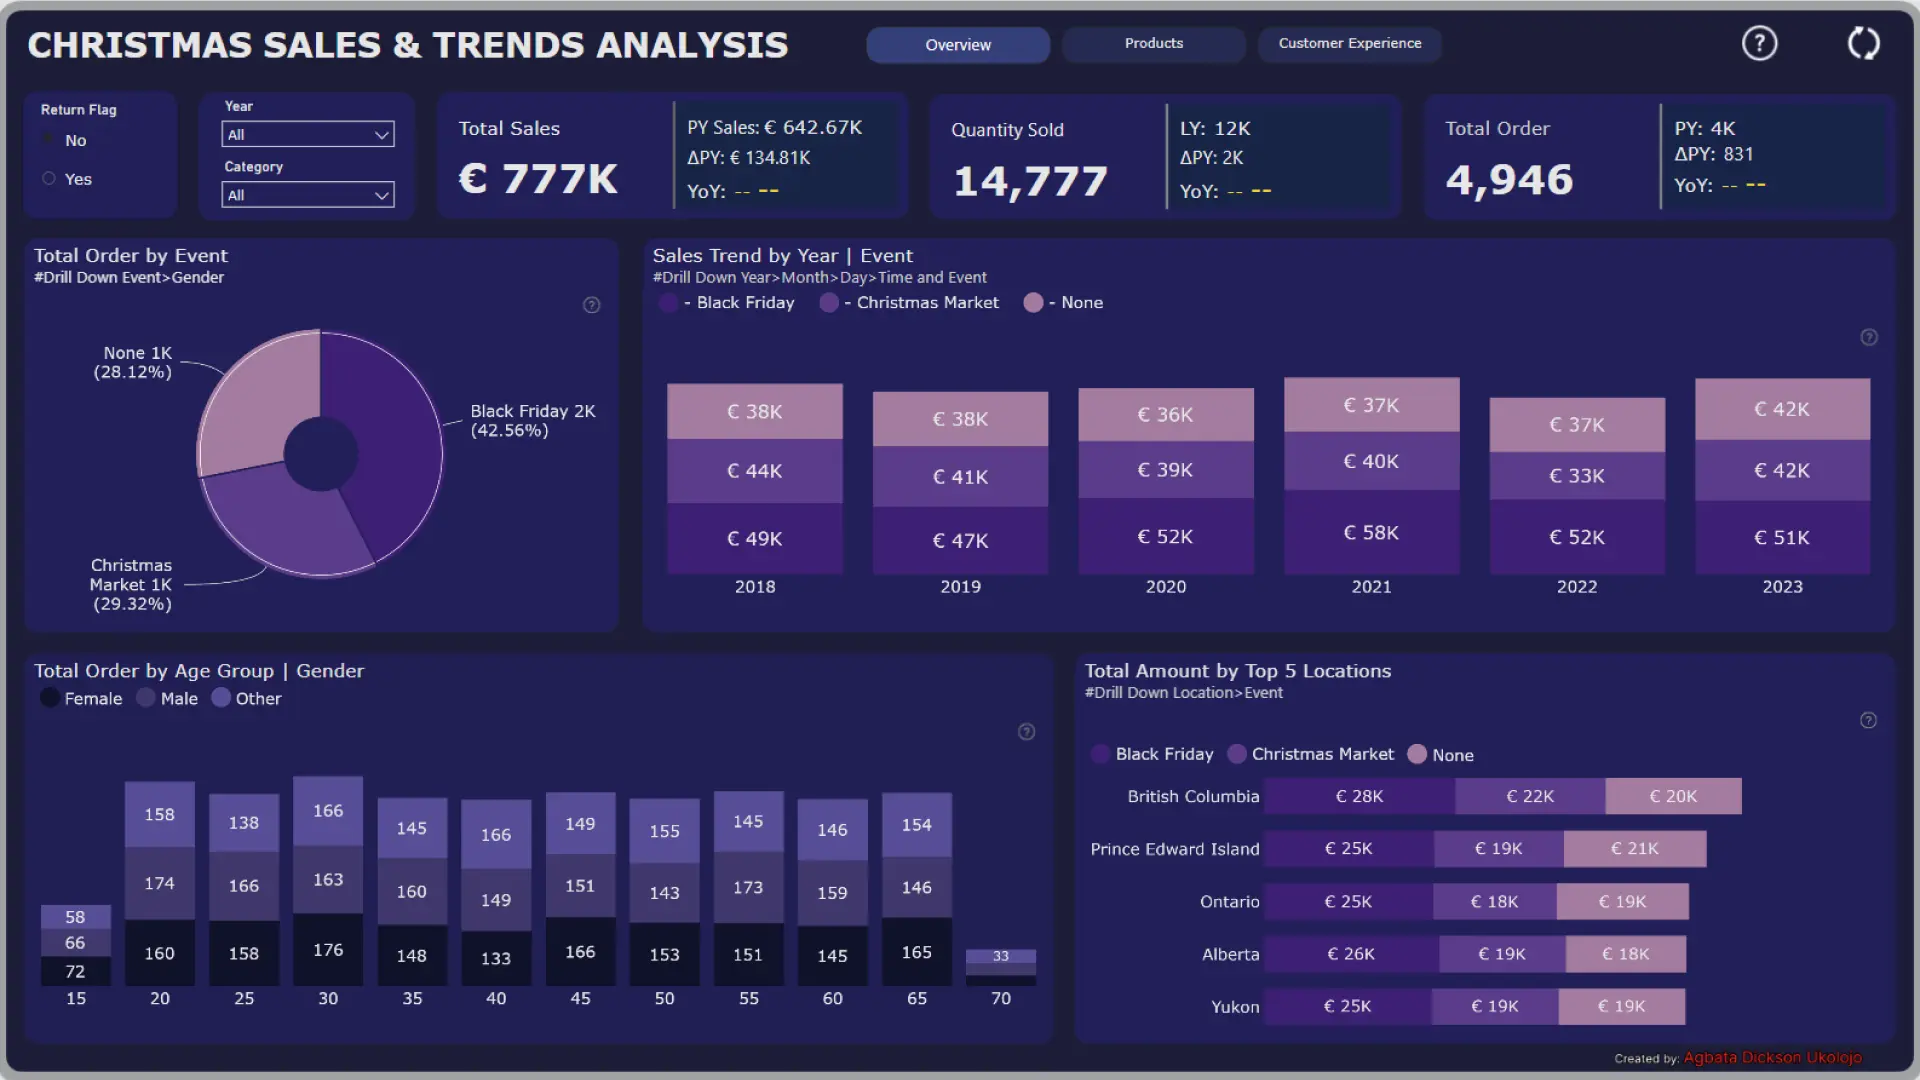
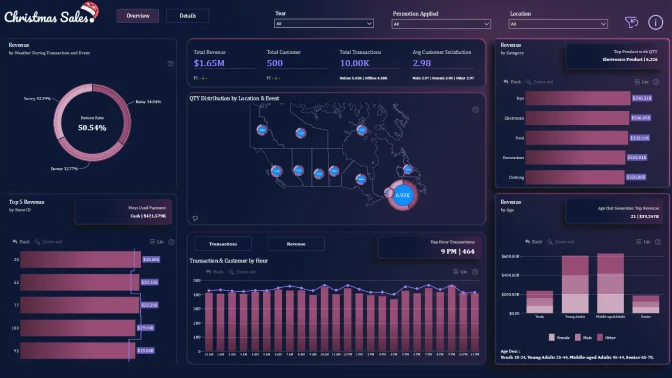
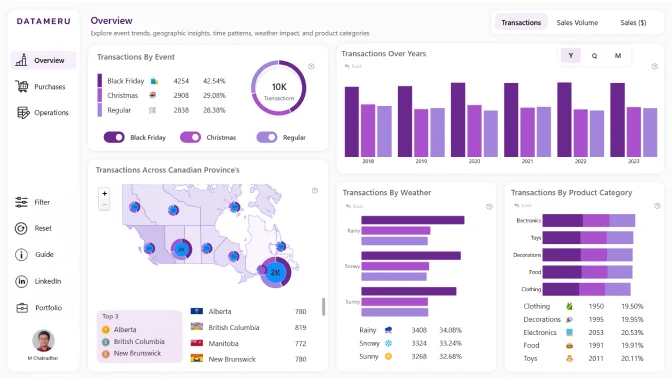
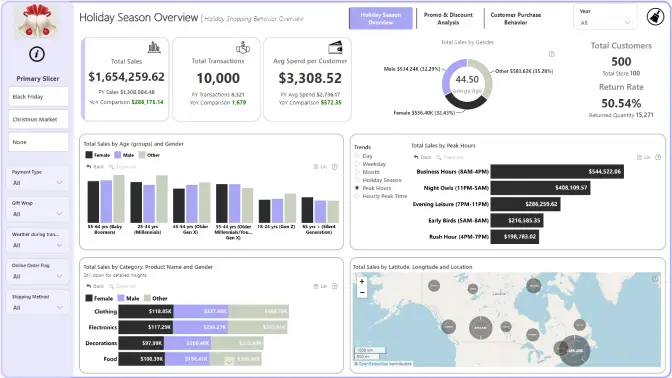
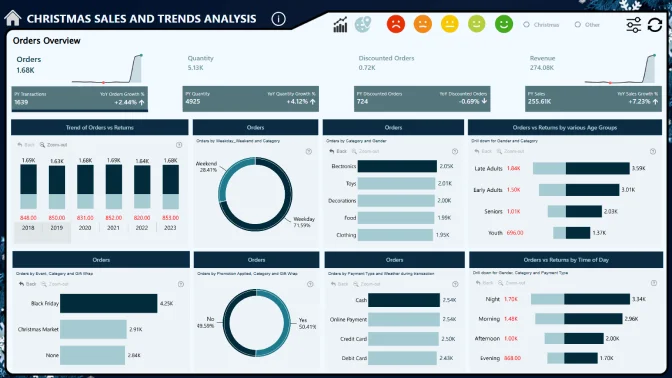
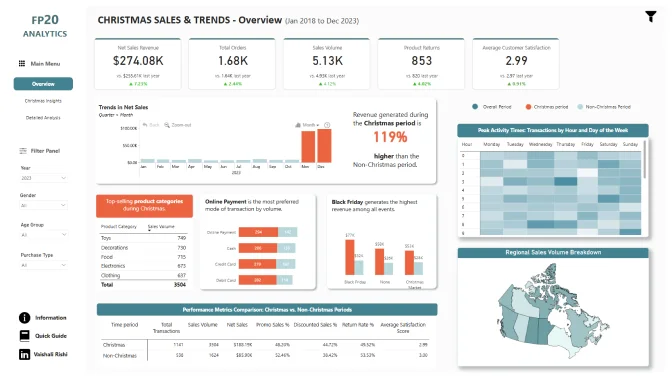
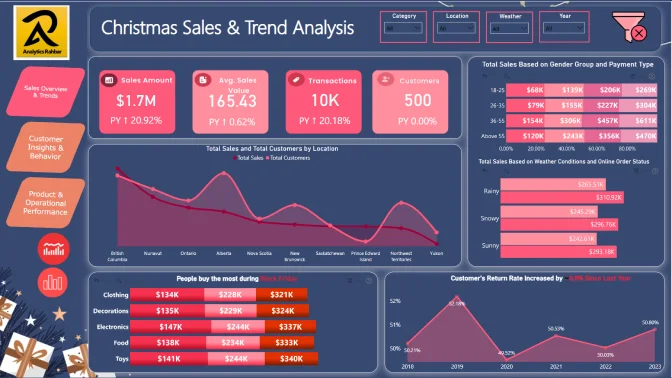
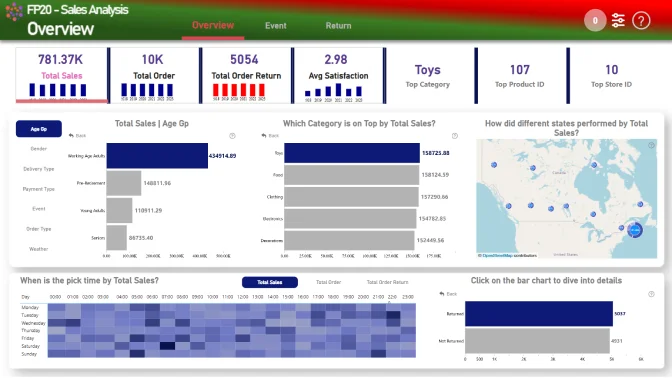
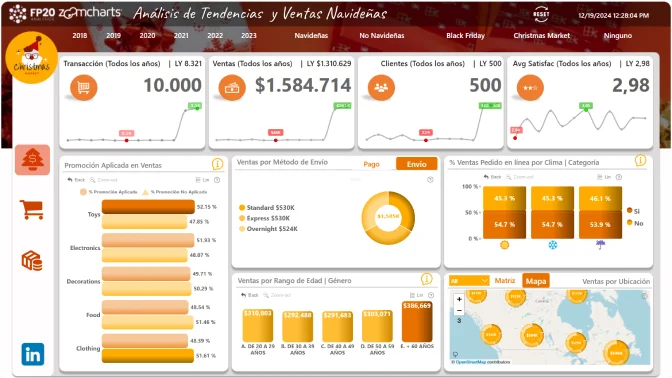
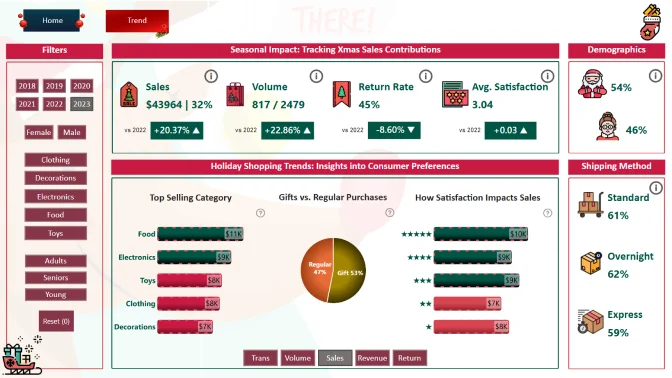
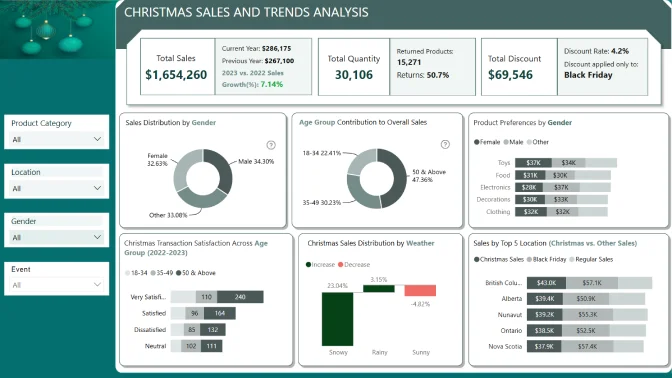
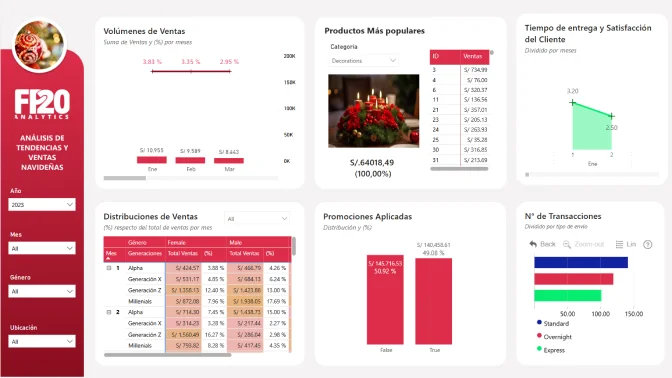
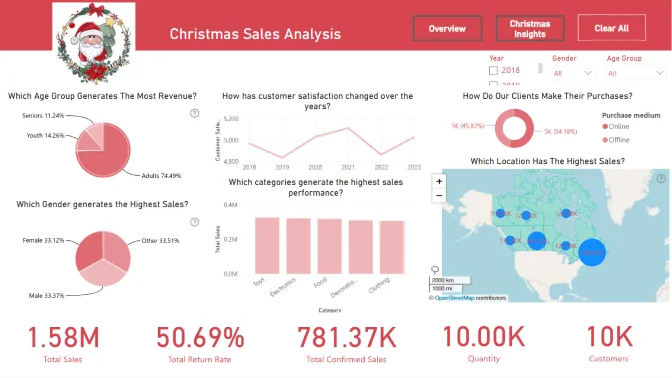
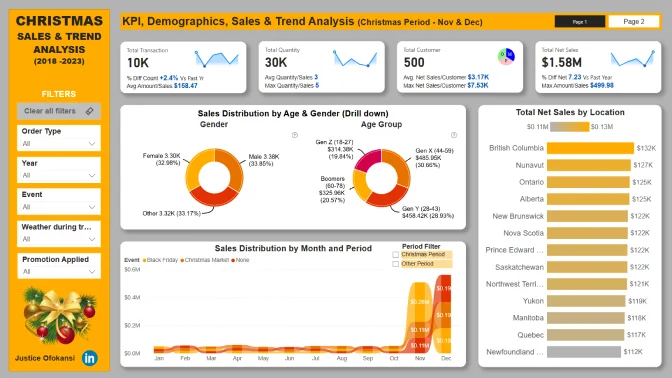
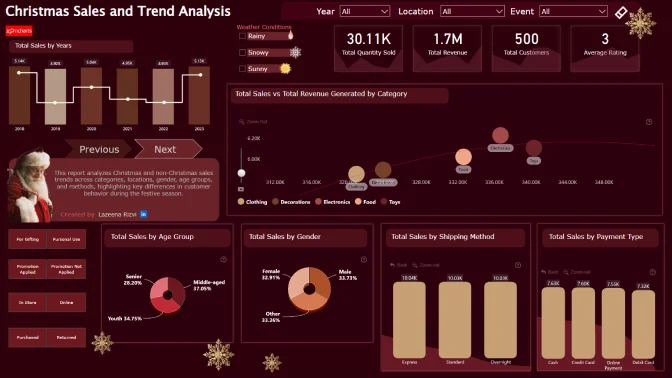
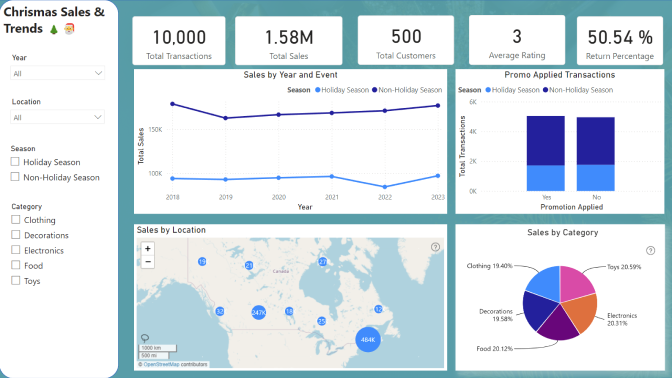
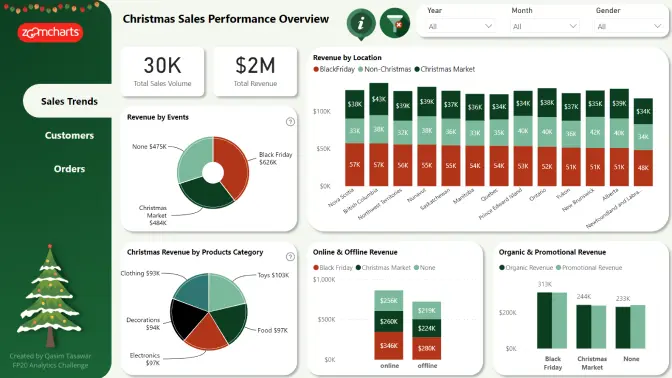
Are you ready to explore the bustling world of holiday shopping and uncover the secrets behind Christmas consumer behavior? In this challenge, you'll dive into a rich dataset capturing trends and insights from Christmas sales, shedding light on customer preferences and shopping patterns during the holiday season.

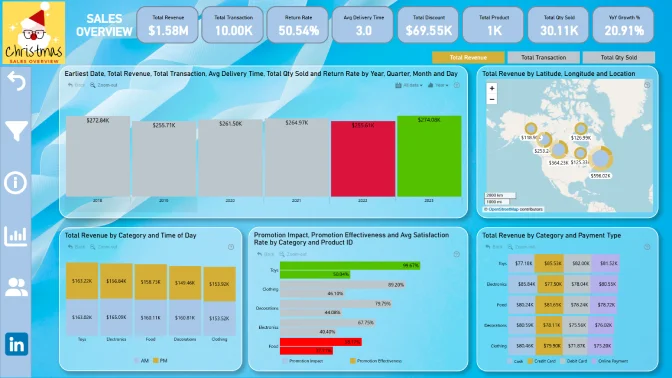
A leading market research firm has collected detailed data on holiday sales, including customer demographics, purchase behaviors, promotional effectiveness, and satisfaction metrics. Participants are tasked with analyzing trends in shopping habits, exploring the impact of promotions, identifying key drivers of satisfaction, and revealing insights to optimize future holiday strategies.

A few questions to help you with your analysis

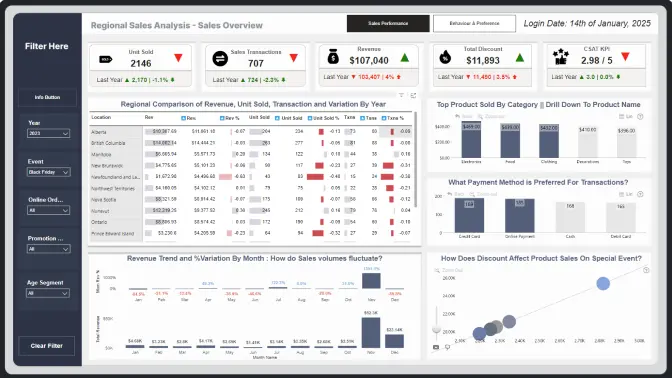
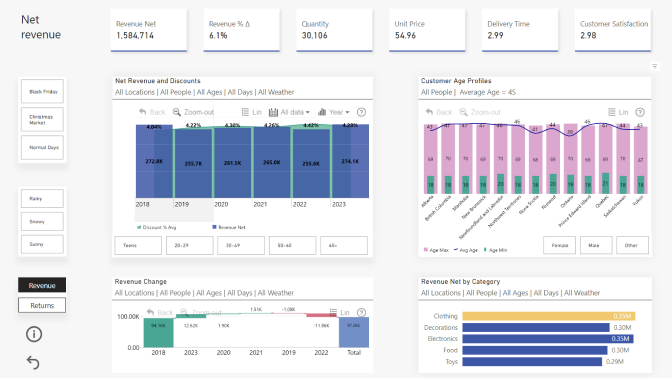
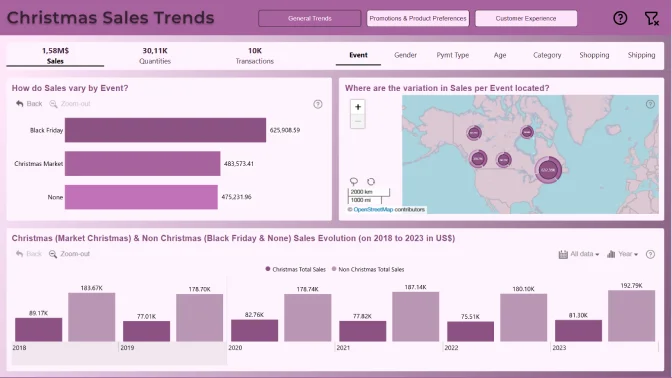
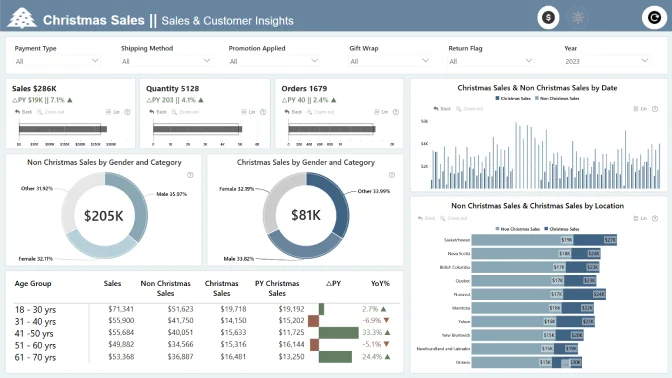
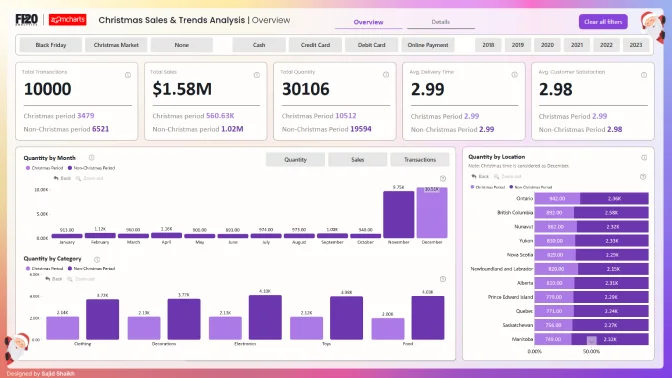
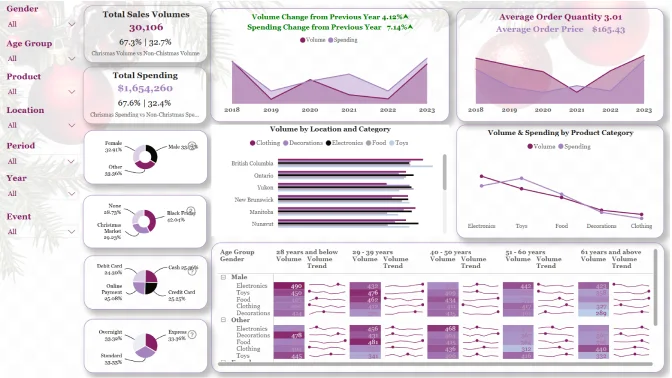
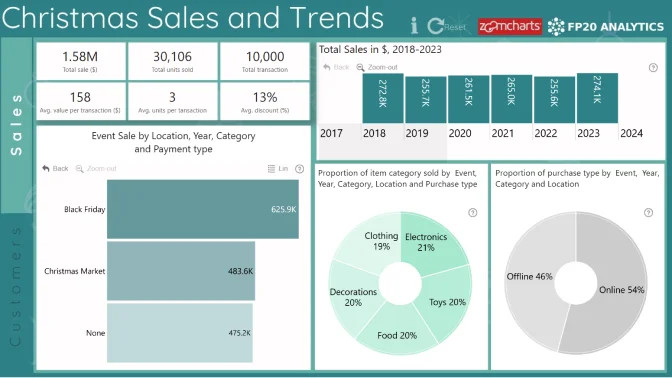
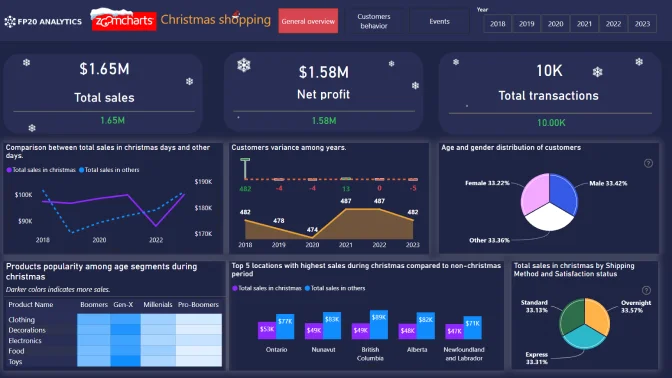
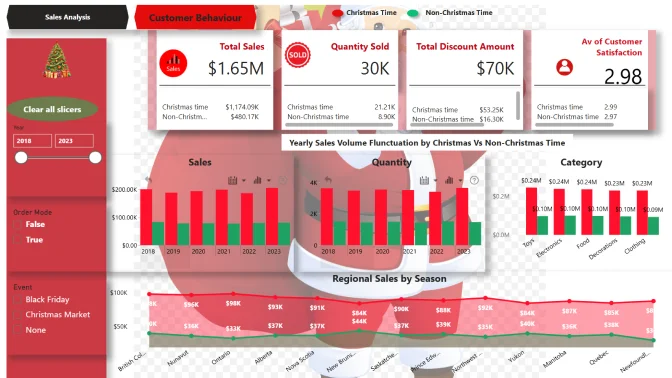
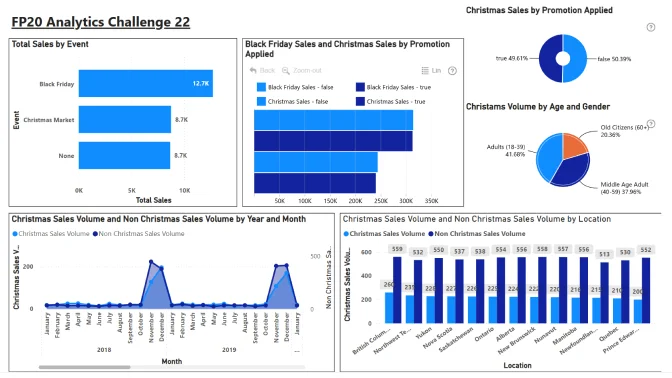
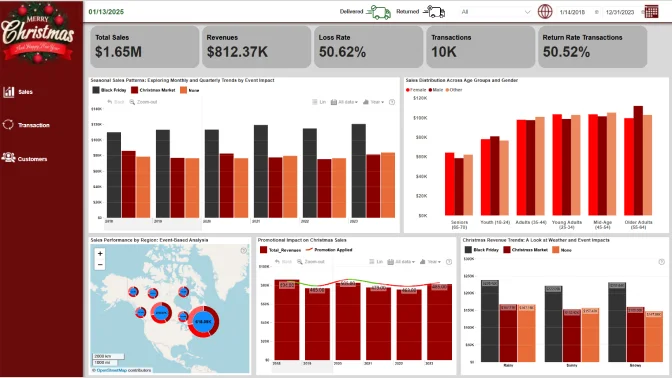
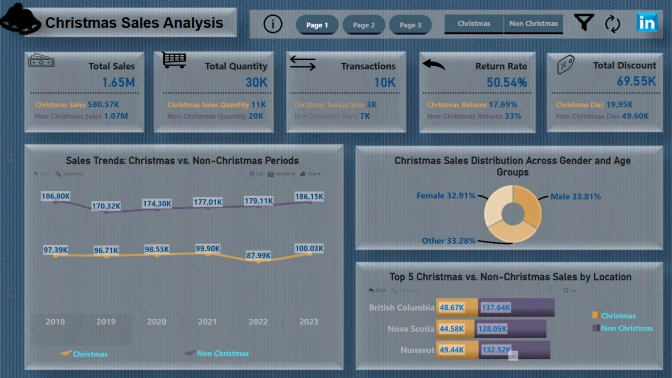
1. How do sales volumes fluctuate during Christmas compared to other periods in the dataset?

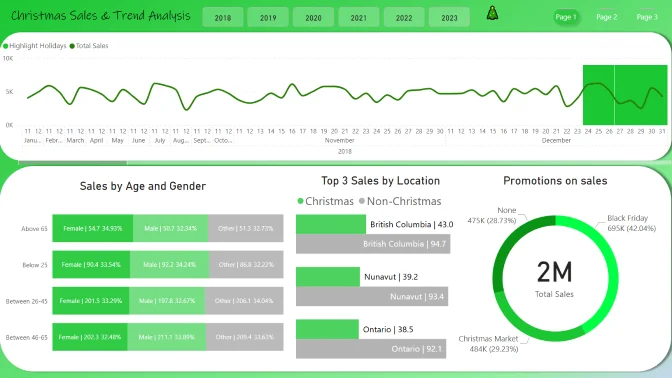
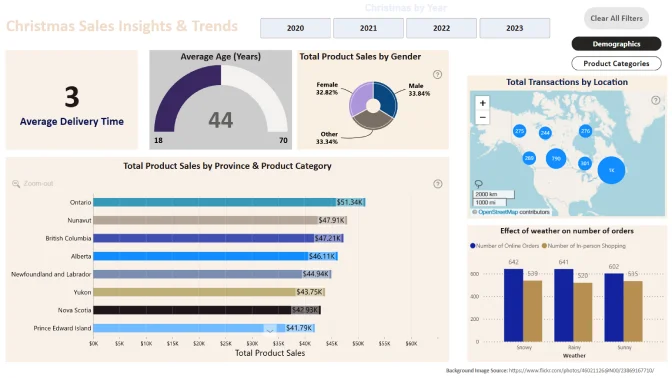
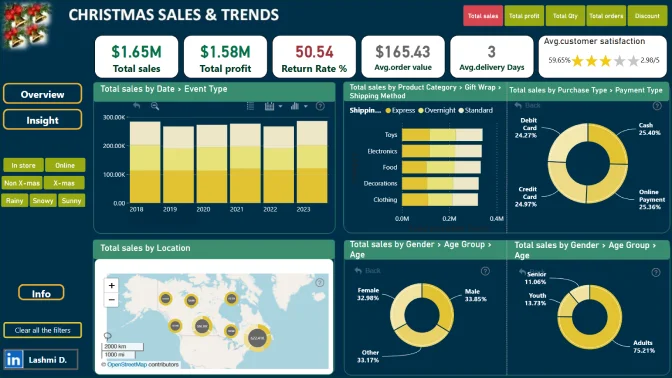
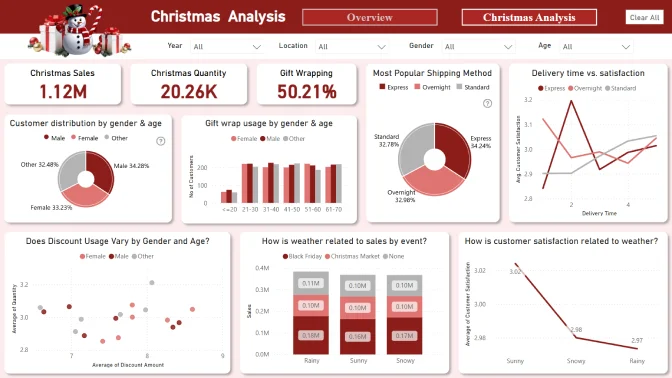
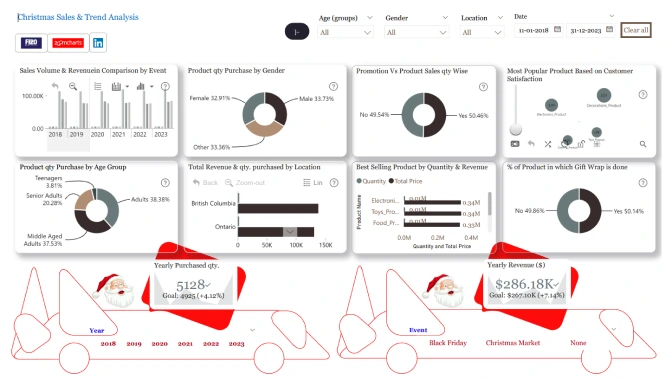
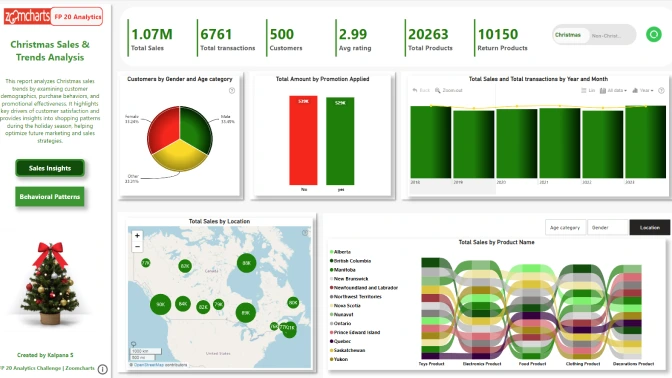
2. What are the age and gender distributions of customers making purchases during Christmas?

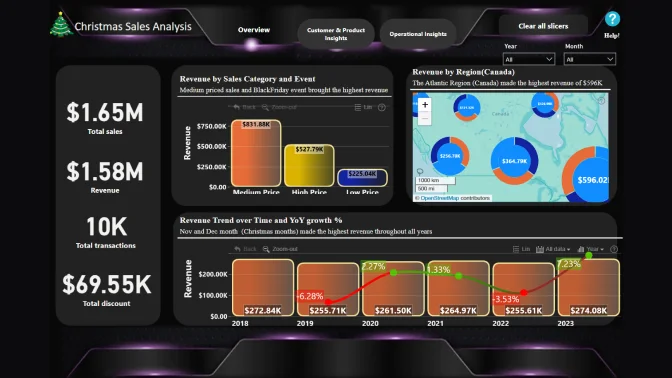
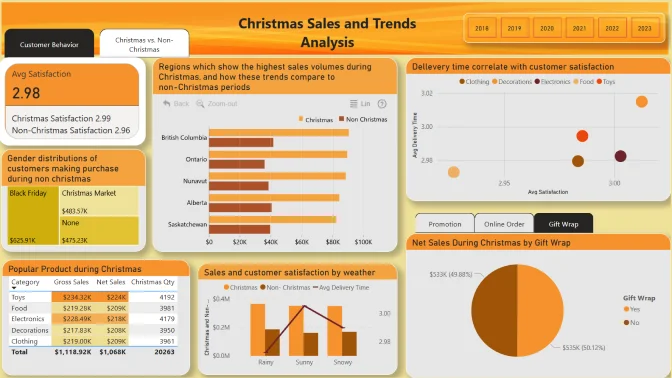
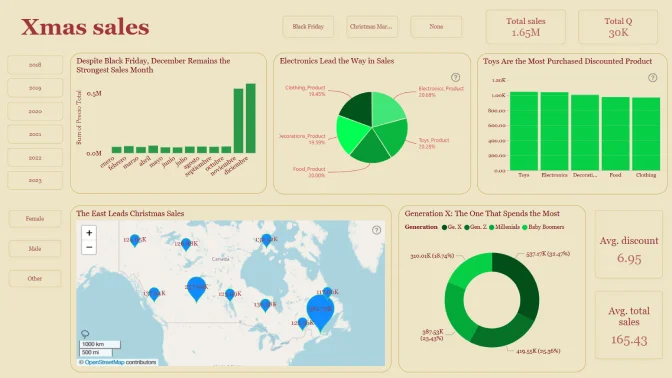
3. Which regions or cities show the highest sales volumes during Christmas, and how do these trends compare to non-Christmas periods?

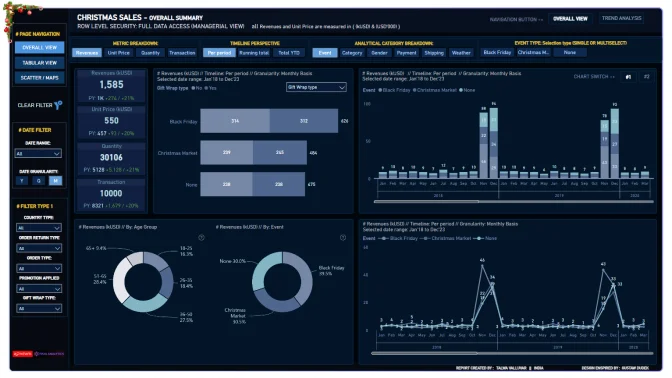
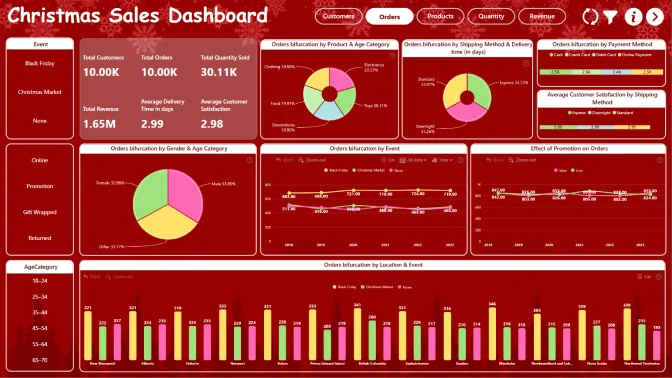
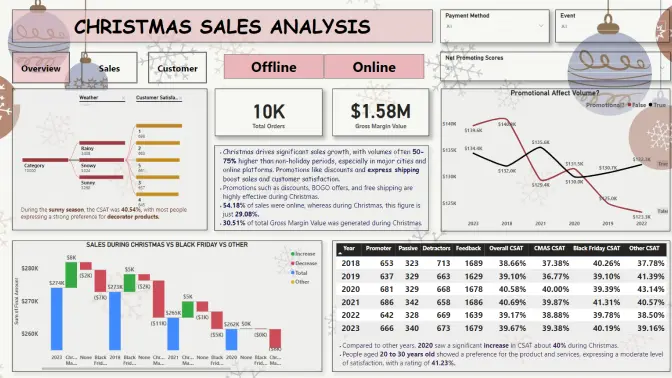
4. What is the effect of promotions on sales during Christmas? Are specific promotions more effective than others?

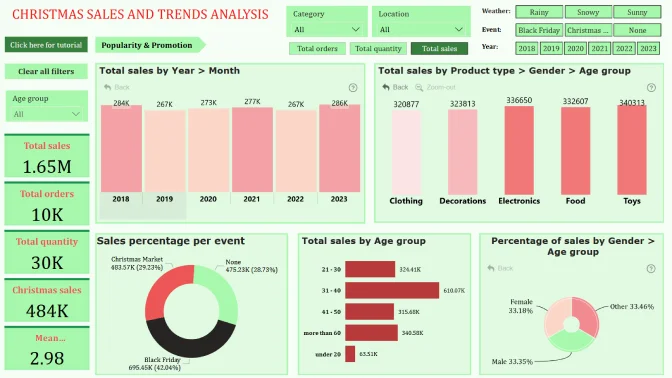
5. Which products are most popular during Christmas, and how do these preferences vary by age, gender, or location?

6. How do customer satisfaction scores differ for Christmas purchases compared to non-Christmas transactions?

7. What percentage of orders during Christmas include gift wrapping, and which demographics are most likely to use this service?

8. Are express shipping options more popular during the Christmas period? How does delivery time correlate with customer satisfaction?

9. What are the main reasons for product returns during Christmas, and do these differ from returns during other periods?

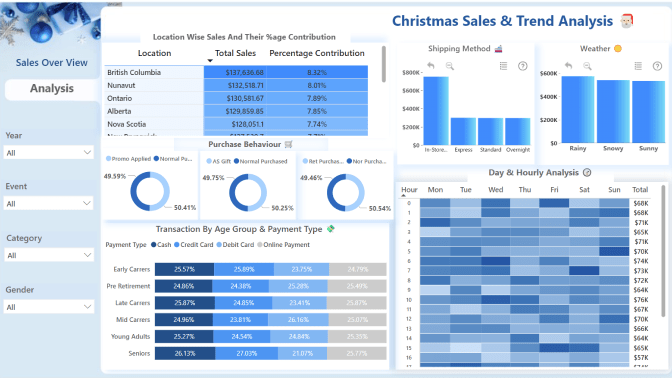
10. How do weather (e.g., snowy, sunny) or specific Christmas events (e.g., "Christmas Market") influence sales and customer behaviour?

Technical requirements

  • Build your report using only Power BI 
  • The recommended number of pages in the report is up to 3 pages, including drill-through pages.
  • Canvas size is 16:9 (Default Power BI size) or Full HD size = w:1920 - h:1080 
  • The report should contain at least 2 ZoomCharts Drill Down visuals within a single page. See a practical guide for using Drill Down visuals here

Judging criteria

Business users use reports to make data-driven decisions. That’s why reports are called effective if they enable users to drill down and filter data quickly and intuitively to find answers to any question they might have and analyse data in all possible directions and dimensions.

Each report is evaluated based on three main criteria: intuitiveness, insightfulness, and interactivity. These factors ensure that the reports are not only accurate and functional, but also meet the target audience's needs and are ready to be presented to the end-users. 

  1. Intuitive: How clear and easy it is to understand the report at a glance? (max 15 points)
    • Is the report visually appealing?
    • Choice of charts and visual elements
    • Does the report tell a story?
    • Is it not overwhelming to the user?
    • Choice of tooltips, titles, and legends

  2. Interactive: How engaging and seamless is the report exploration and interaction with data? (max 15 points)
    • Clear navigation that allows user to explore the report
    • Use of slicers and other interactive elements
    • Smooth cross-chart integration
    • Is report optimized for touch devices?
    • Are tutorials and guiding elements helpful to the user?

  3. Insightful: How accurate, complete, and meaningful is the data in driving decisions? (max 15 points)
    • Depth of analysis
    • Data cleaning and preparation
    • Does data show up accurately in the report?
    • Is report optimized for quicker loading time?
    • Does the report provide deeper exploration of data (drill-down)?


Timeline

Winner Announced

Winner Announced

16 January | 10:00

-

Registration Open

Registration Open

12 December | 19:00

-

Submissions Open

Submissions Open

12 December | 19:00

-

Workshop | How to Analyze Christmas Sales & Trends in Power BI

Workshop | How to Analyze Christmas Sales & Trends in Power BI

17 December | 09:00

-

1:1 Mentoring Sessions

1:1 Mentoring Sessions

17 December | 09:00

12 December - 11 January

Entry Submission Deadline

Entry Submission Deadline

11 January | 19:00

12 December - 11 January

Webinar | Reviewing the TOP 5 Reports of Christmas Sales & Trends

Webinar | Reviewing the TOP 5 Reports of Christmas Sales & Trends

16 January | 11:00

12 December - 11 January

Dataset

Get the dataset

See past FP20 Analytics December 2024 challenges

See past challenges

Your Drill Down Visuals Developers License

Use the email and password provided below to log in Power BI Desktop and access an account with a license to use all ZoomCharts Drill Down Visuals.

Upon logging in, you will need to change your password and enable two-factor authentication. If you encounter any problems, feel free to reach out to us via chat.

*This Developer License can be used to create a report for this ZoomCharts Mini Challenge or for your personal training purposes. Commercial use of this license is prohibited.

Upload failed
Attach file
File requirements: 16MB

Any questions? Feel free to use chat!

Are you sure you want to delete the report?

Activate your Drill Down visuals Developer License!

You can use these credential to access ZoomCharts visuals and create your report for this ZoomCharts Mini Challenge, or for your personal training purposes.


logo
[email protected]
+44 204 577 3993
logo

Products

Drill Down Network PRO Drill Down Waterfall PRO Drill Down Graph PRO Drill Down Combo PRO Drill Down Combo Bar PRO Drill Down Donut PRO Drill Down Pie PRO Drill Down TimeSeries PRO Drill Down Timeline PRO Drill Down Map PRO Drill Down Scatter PRO All Visuals

Resources

Report Examples Webinars Blog ZoomCharts Academy Visuals Gallery Documentation Custom Visual Development Subscribe to News

Solutions

Custom Visual Development

Company

Pricing About Us Partners Leave feedback Join PowerGroup EU Funding

Help

ZoomCharts Assistance Contact Sales Contact Support FAQ

Drill Down Network PRO Drill Down Waterfall PRO Drill Down Graph PRO Drill Down Combo PRO Drill Down Combo Bar PRO Drill Down Donut PRO Drill Down Pie PRO Drill Down TimeSeries PRO Drill Down Timeline PRO Drill Down Map PRO Drill Down Scatter PRO All Visuals

Report Examples Webinars Blog ZoomCharts Academy Visuals Gallery Documentation Custom Visual Development Subscribe to News

Custom Visual Development

Pricing About Us Partners Leave feedback Join PowerGroup EU Funding

ZoomCharts Assistance Contact Sales Contact Support FAQ
+44 204 577 3993
[email protected]

Ready to get in touch?

Contact our experts with any question about Power BI and ZoomCharts for Free!

Contact us

© 2025, Data Visualization Software Lab

U.S. Patents No. 11,645,343; 11,921,804

Cookies Policy
Manage cookies
Privacy Policy
Global
EULA
Patent
warning

Error message

success

Success info: Done!

ZoomCharts AI Assistant

We noticed you're using an old OS version.

For the best experience, we recommend upgrading to ensure that all website features display correctly.

Cookie settings

We use necessary cookies for site functionality, as well as statistic, marketing, and preference cookies to enhance your experience. For more information and to manage your preferences, please visit our Cookie policy