1035
Christmas Sales and Trends Analysis 5
Christmas Sales and Trends Analysis 5
More Report pages
Report Author: Rachanaben Bhatt
1035
Share template with others
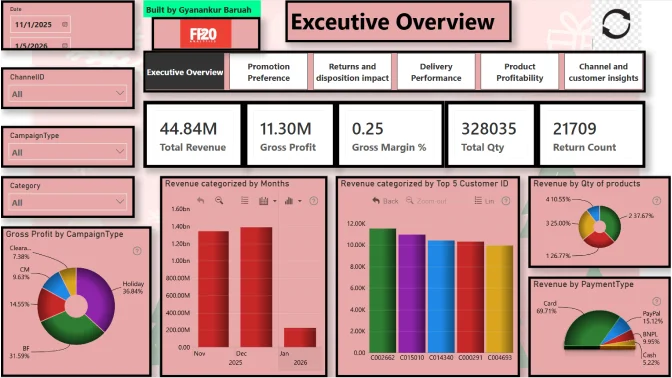
Report submitted for the FP20 Analytics ZoomCharts Challenge, December 2024. The report was built using the Christmas Sales & Trends Dataset and includes ZoomCharts custom Drill Down PRO visuals for Power BI.
Author's description:
This analysis seeks to uncover valuable insights about consumer behavior and business performance during the Christmas season, enabling businesses to optimize strategies and maximize profitability.
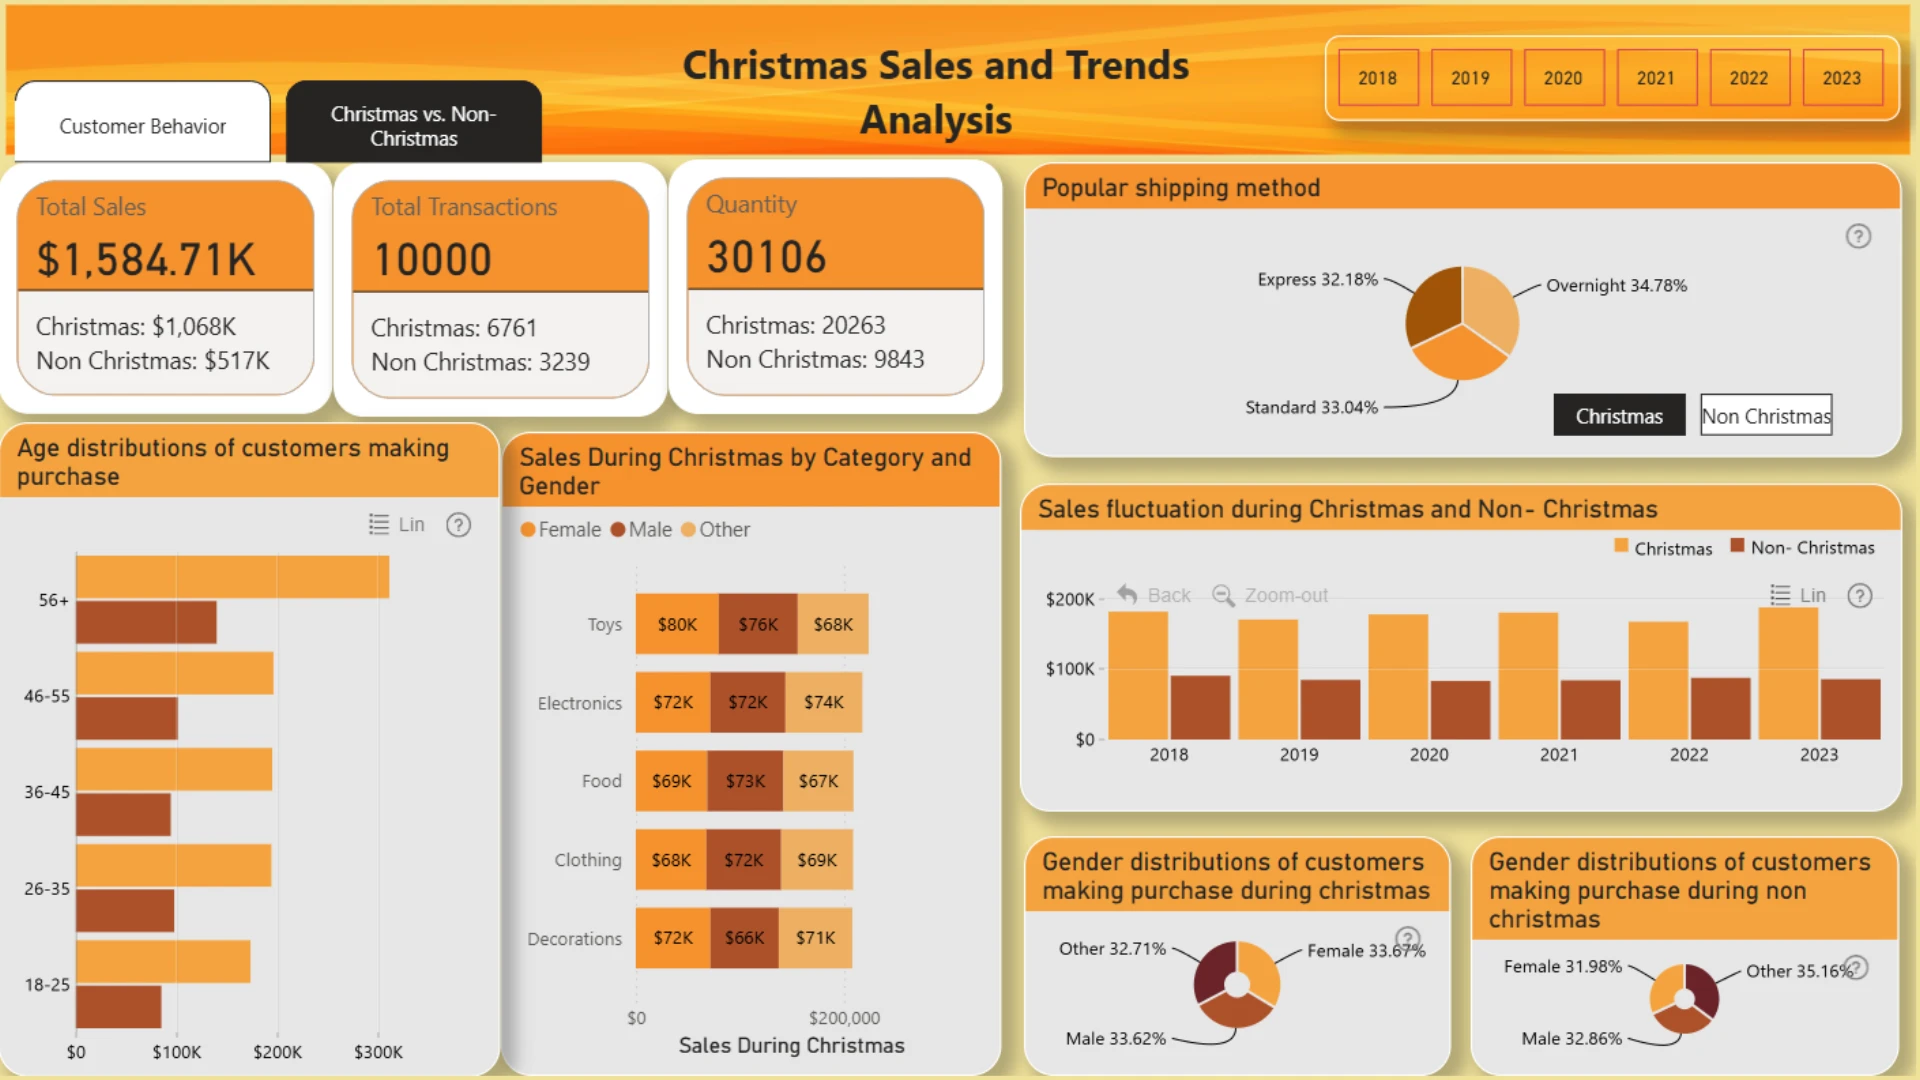
1. Identify Sales Trends
- Objective: Understand overall sales performance during the Christmas period and identify significant sales trends.
- Key Metrics:
- Total Revenue: Analyze total revenue generated during the Christmas period and compare it to non-Christmas periods.
- Sales Uplift: Measure the percentage increase in sales during Christmas compared to non-Christmas times.
- Category Performance: Examine which product categories contributed the most to sales (e.g., Toys, Electronics, Clothing).
- Insights:
- Revenue Growth: Identify the sales spike during peak events like Black Friday and Christmas Eve.
- Category Trends: Recognize which categories performed better during the holiday season, helping businesses stock up accordingly.
- Key Metrics:
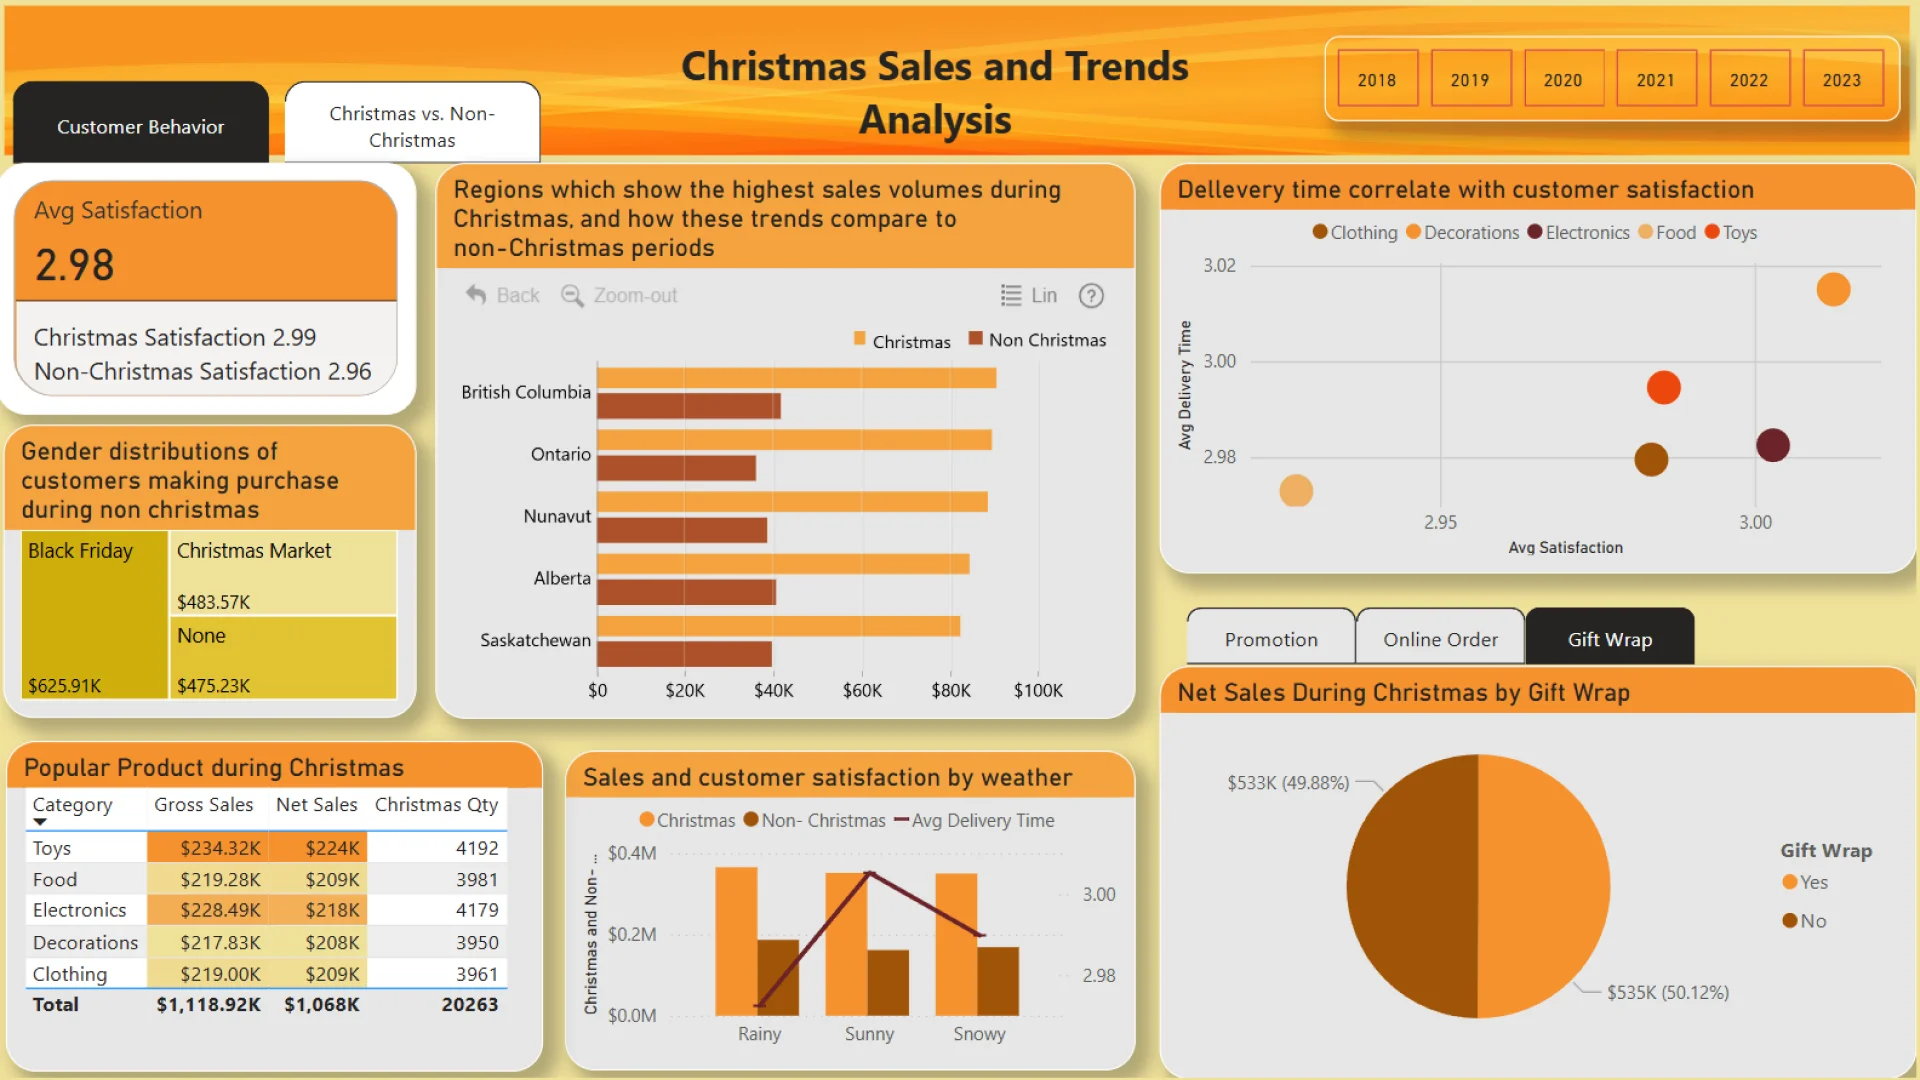
2. Customer Behavior Insights
- Objective: Gain a deeper understanding of customer preferences and purchasing patterns.
- Key Metrics:
- Product Preferences: Identify the most popular products or categories purchased during the Christmas season.
- Demographic Segmentation: Analyze customer behavior by age group, gender, and location.
- Purchase Method: Determine if customers prefer online or in-store shopping and the impact on sales.
- Insights:
- Customer Demographics: Understand which demographic segments contributed the most to sales (e.g., Working Adults, age groups, etc.).
- Purchase Method: Recognize whether online or in-store purchases drove more sales and how promotional efforts affected each.
- Key Metrics:
3. Seasonal Timing
- Objective: Pinpoint the peak shopping periods during the holiday season to optimize sales strategies.
- Key Metrics:
- Peak Sales Days: Identify specific days with the highest sales, such as Black Friday, Cyber Monday, or Christmas Eve.
- Time-of-Day Sales Patterns: Analyze sales patterns by time of day (e.g., morning, afternoon, evening).
- Weekday vs. Weekend Trends: Understand whether weekdays or weekends generate more sales during the holiday season.
- Insights:
- Peak Shopping Times: Identify the optimal days and times for targeted promotions, offers, and marketing.
- Consumer Preferences: Discover when customers are most likely to make purchases, enabling businesses to plan for high-traffic times.
- Key Metrics:
4. Shipping and Delivery Performance
- Objective: Assess the role of shipping services in customer satisfaction and its impact on purchasing decisions.
- Key Metrics:
- Express Shipping Demand: Evaluate how much demand there is for express shipping during the holiday period.
- Delivery Times and Satisfaction: Analyze the relationship between delivery speed and customer satisfaction.
- Insights:
- Express Shipping: Determine whether customers are willing to pay for expedited shipping and its effect on sales.
- Delivery-Related Satisfaction: Recognize delivery performance as a key factor influencing overall customer satisfaction during the holiday season.
- Key Metrics:
5. Gift-Wrapping and Add-on Services
- Objective: Understand the popularity of gift-wrapping and other add-on services.
- Key Metrics:
- Gift-Wrapping Usage: Calculate the percentage of orders with gift-wrapping services.
- Demographic Preferences for Add-on Services: Identify which customer segments are most likely to use gift-wrapping and other add-on services.
- Insights:
- Gift-Wrapping Demand: Understand the demand for gift-wrapping services during the holiday season.
- Target Demographics: Identify customer groups most inclined to purchase add-on services like gift-wrapping, allowing businesses to create targeted promotions.
- Key Metrics:
ZoomCharts visuals used
4U Report Challenges
Participate in data challenges, build and submit reports to get free template downloads.
Join CommunityMobile view allows you to interact with the report. To Download the template please switch to desktop view.
Was this helpful? Thank you for your feedback!
Sorry about that.
How can we improve it?