652
The Tale of Two Seasons: Christmas Cheer and Everyday Grind
The Tale of Two Seasons: Christmas Cheer and Everyday Grind
Report Author: Evguenia Fonova
652
Share template with others
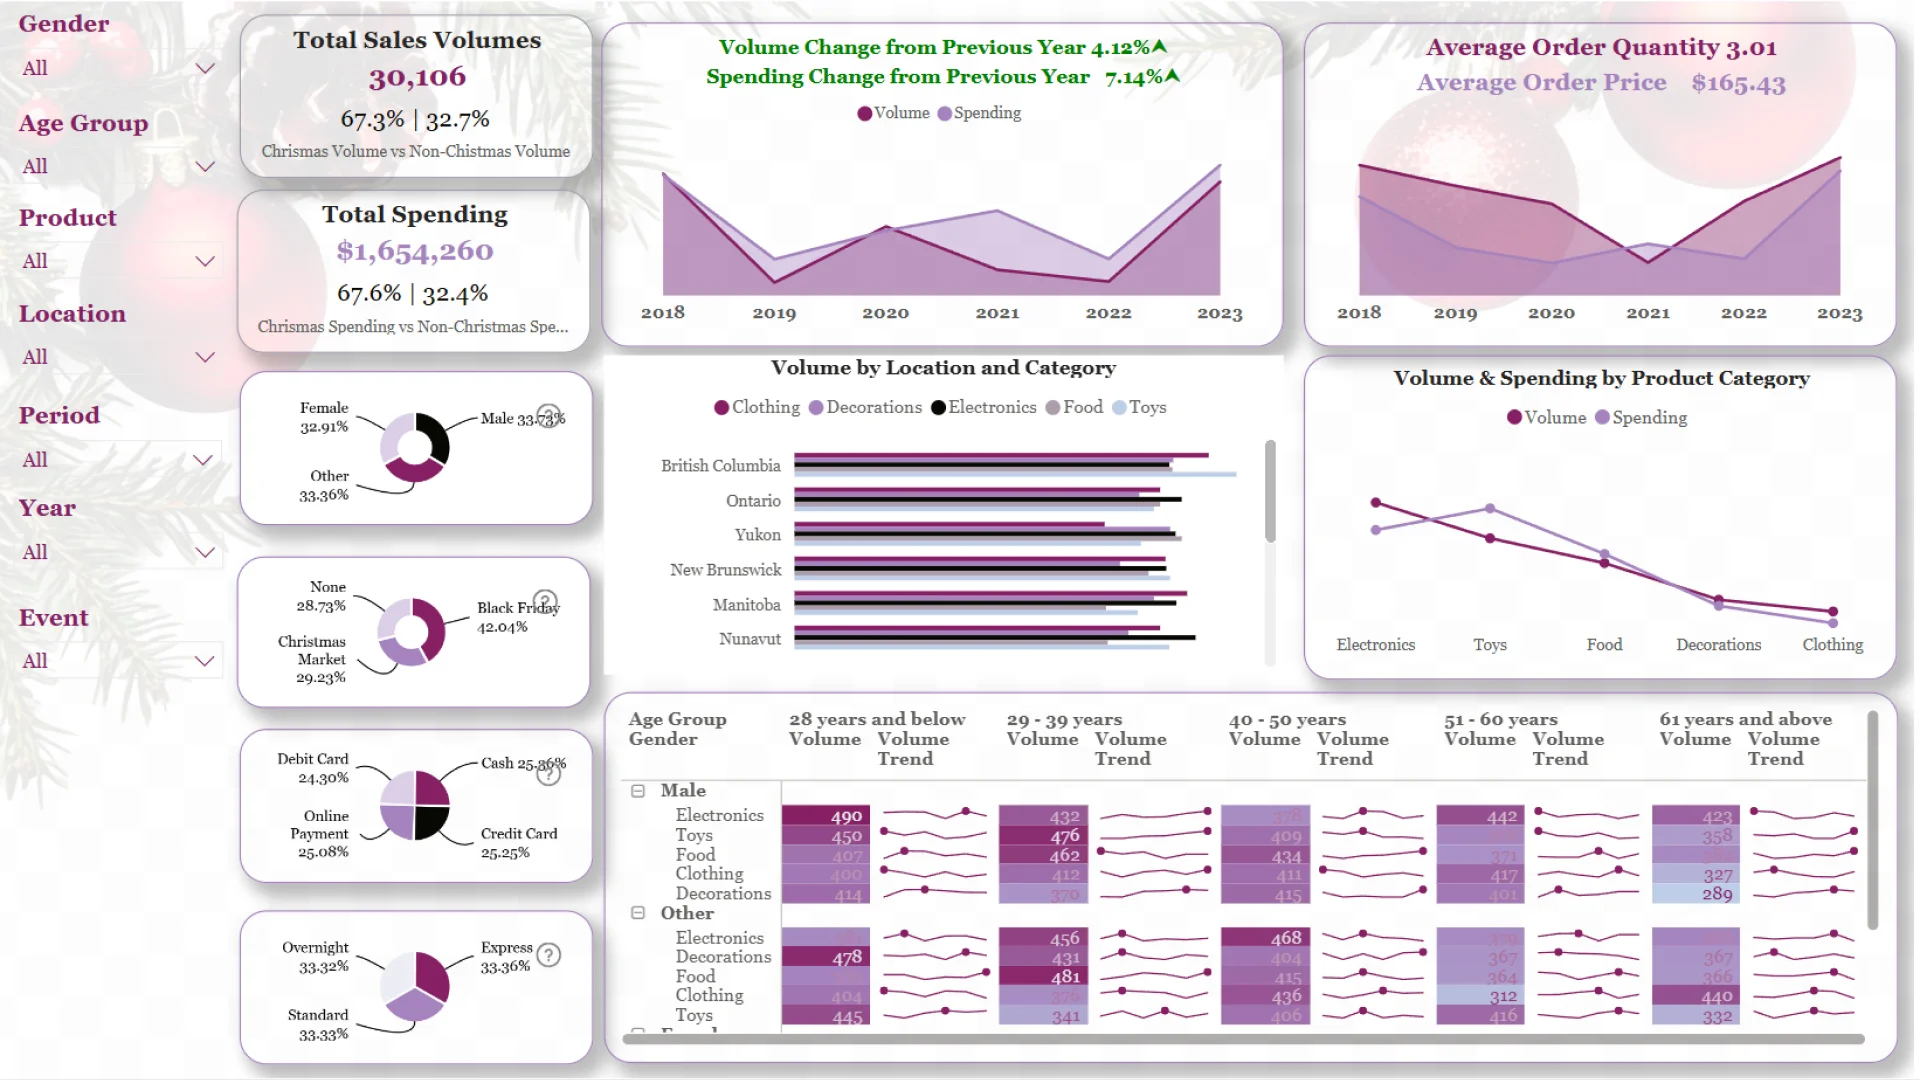
Our analysis explored the contrasting sales dynamics between the holiday period (November-December) and the rest of the year. Christmas emerged as the undisputed sales powerhouse, contributing a substantial 68% of annual sales, both in volume and spending. Between 2022 and 2023, Christmas sales volumes increased by 9.19%, while spending grew by 11.72%. In contrast, non-Christmas periods saw a 5.36% decline in volume and a 1.73% drop in spending, highlighting just how vital the festive season is for businesses.
Who’s Buying What?
- Tech Lovers: Males under 28 led the charge, with Electronics being their preferred category.
- Foodies: Shoppers aged 29–39, identifying as "Other" gender, followed closely, focusing on Food.
- Decor Enthusiasts: Females and "Other" genders under 28 rounded out the top three, with a preference for Decorations.
Product Trends
- Holiday Hits: Electronics and Toys were the most popular during Christmas.
- Year-Round Staples: Electronics and Food remained popular year-round, while Toys dropped to fourth place outside the holiday season.
Seasonal Shifts and Trends:
- Clothing: Experienced a downward trend from 2018, with peaks in 2020 and 2021, likely tied to the "return to office" phenomenon post-pandemic. Interestingly, male clothing sales showed consistent growth since 2020.
- Decorations: Exhibited a strong upward trend and remained popular year-round.
- Electronics: Saw a decline after a peak in 2019 (likely due to pandemic-related stay-at-home habits), but this trend primarily affected females and "Other" genders. Male electronics sales rebounded after a dip in 2021.
- Food: Steadily increased during Christmas and remained relatively stable throughout the year.
- Toys: Experienced fluctuating trends outside of the Christmas season, with female purchases dominating. Male toy purchases showed a slight decline, while "Other" gender purchases remained relatively flat.
Regional Trends and Customer Insights
- British Columbia emerged as the top region for purchase volume year-round, followed by Ontario and New Brunswick during different seasons:
- Ontario: Ranked second during Christmas, driven by Electronics and Clothing purchases.
- New Brunswick: Secured second place in non-Christmas months, with preferences for Clothing and Decorations.
Customer Behavior Insights
- Customer Satisfaction: Satisfaction scores were almost identical across Christmas (2.99/5) and non-Christmas (2.96/5) periods. However, Quebec customers were the happiest during Christmas (3.17/5), particularly with Decorations and Electronics (both 3.29/5). During non-Christmas months, Manitobans topped the satisfaction chart (3.08/5), with Food being their favourite (3.21/5).
- Weather and Purchases: Most purchases occurred during rainy weather (34.39%), followed closely by snowy (33.27%) and sunny days (32.34%). This suggests that weather may influence buying habits, possibly triggering mood-based purchasing.
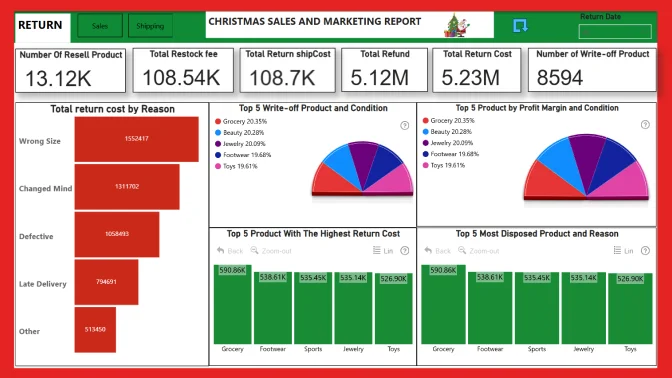
- Returns and Weather: Despite a steady 50% return rate, products bought on rainy days were returned more often—possibly due to the "rainy day blues" leading to impulsive buys. Snowy weather saw fewer returns, possibly due to more considered shopping.
- Satisfaction by Weather: Sunny weather generally boosted satisfaction for most shoppers, except for the "Other" gender group, who reported lower satisfaction on sunny days. This indicates that weather impacts satisfaction differently across different groups.
- Delivery Time and Satisfaction: While delivery time wasn't a major factor, satisfaction slightly dipped as delivery times increased. Food purchases were particularly sensitive to delays, suggesting that faster delivery could help keep customers happy.
- Discount Sensitivity: Females under 28 were most influenced by Clothing discounts, while the "Other" gender group in the same age range leaned towards Decorations. Males under 28 were most drawn to Electronics deals.
- Promotions and Spending: New Brunswick residents were most influenced by promotions (56.09%), while Yukon residents were the least influenced (46.17%). Ontario shoppers responded particularly well to Clothing promotions (57.53%), while Nova Scotia shoppers, especially females, were less affected (36.19%).
- Gift Wrapping Trends: Decorations were the most wrapped items during Christmas (52.03%), while Toys took the lead in non-Christmas months (53.37%). Clothing and Electronics were the least wrapped during their respective peak seasons.
4U Report Challenges
Participate in data challenges, build and submit reports to get free template downloads.
Join CommunityMobile view allows you to interact with the report. To Download the template please switch to desktop view.
Was this helpful? Thank you for your feedback!
Sorry about that.
How can we improve it?