627
Christmas Sales & Trends 2
Christmas Sales & Trends 2
More Report pages
Report Author: Sweety Antoni David
627
Share template with others
Report submitted for the FP20 Analytics ZoomCharts Challenge, December 2024. The report was built using the Christmas Sales & Trends Dataset and includes ZoomCharts custom Drill Down PRO visuals for Power BI.
Author's description:
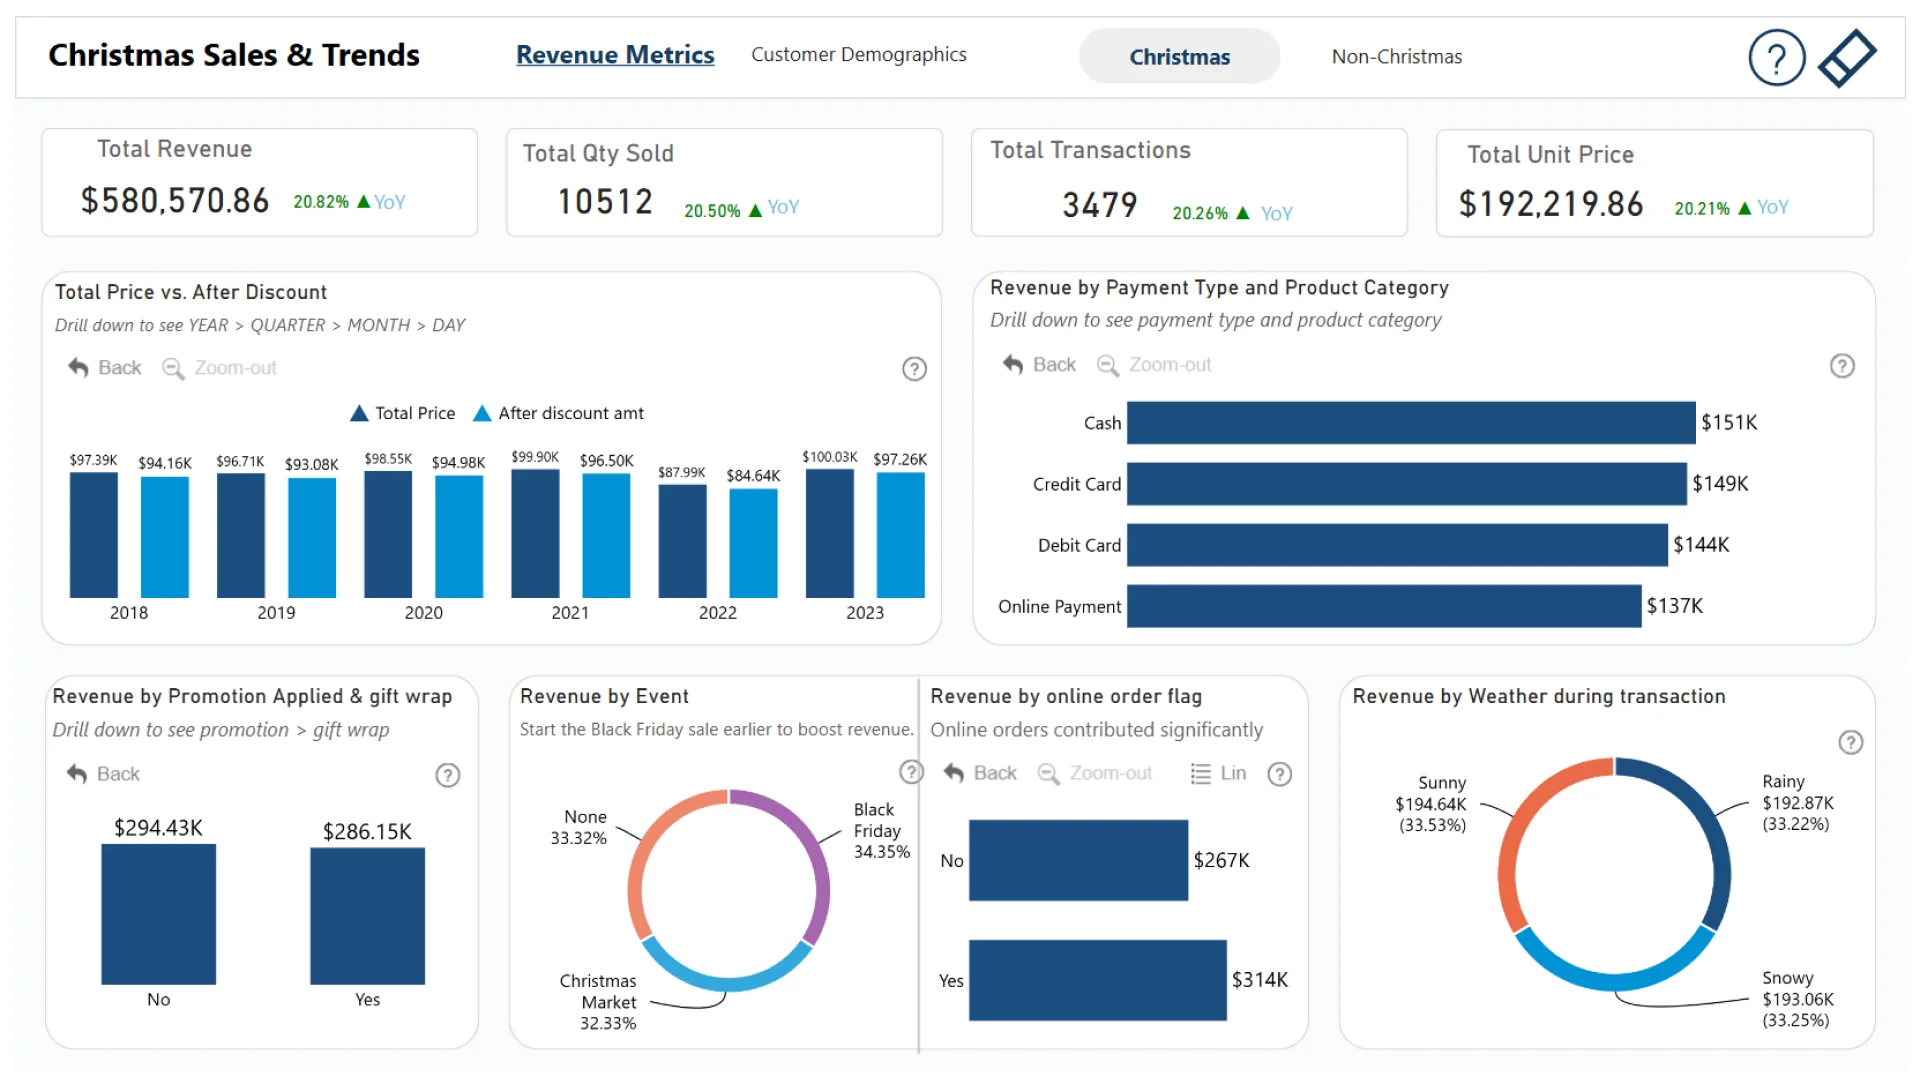
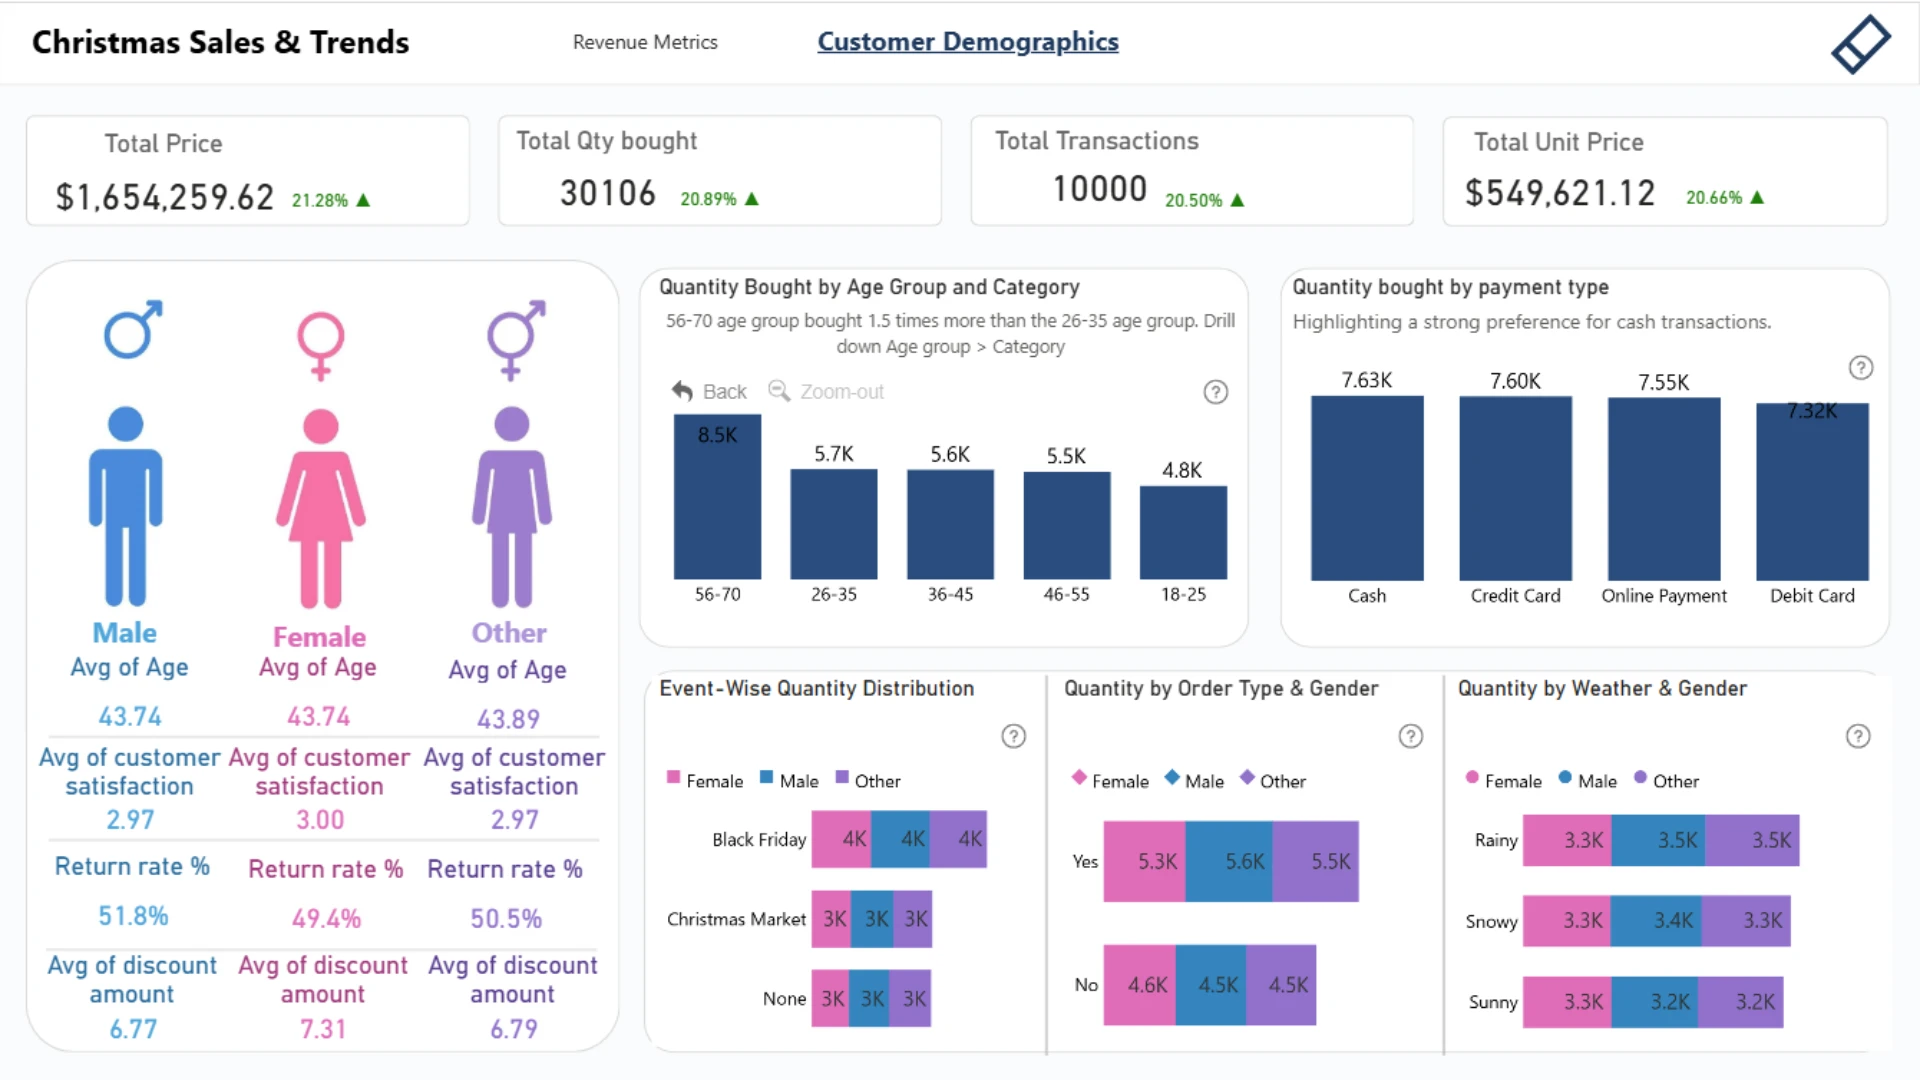
Christmas Sales & Trends Summary Page 1: Revenue Metrics- This page provides an in-depth analysis of revenue generated during the Christmas season, breaking down sales by different channels, products, and events. It highlights key trends such as the most profitable periods, sales spikes, and comparisons to previous years to help understand what drives holiday sales performance. Page 2: Customer Demographics - This page explores the demographics of customers making purchases during the Christmas period, focusing on key segments such as age groups, gender, and location. It uncovers insights into which demographic groups contributed most to the sales and their preferred purchasing methods, helping to tailor future marketing and sales strategies.
4U Report Challenges
Participate in data challenges, build and submit reports to get free template downloads.
Join CommunityMobile view allows you to interact with the report. To Download the template please switch to desktop view.

Was this helpful? Thank you for your feedback!
Sorry about that.
How can we improve it?