Registration Open
Registration Open
06 July | 09:00
-

Reset your password
We'll email you instructions on how to reset your password

Build an interactive Power BI dashboard to analyze legal case performance, profitability, lawyer workload, client satisfaction, and operational efficiency.
Workshop | Build a Legal Case Performance Dashboard in Power BI
Workshop | Build a Legal Case Performance Dashboard in Power BI
20 July | 07:00
-
Webinar | Top 5 Legal Case Performance Dashboards in Power BI
Webinar | Top 5 Legal Case Performance Dashboards in Power BI
12 August | 08:00
06 July - 06 August
Dive into the dataset, build a Power BI report, practice your data visualization skills, and compete for prizes.
Main ZoomCharts Prize
$300 Amazon Gift Card
FP20 Analytics Community Prizes
Skillwave, The Data Vis Force, and Enterprise DNA

Want to build professional Power BI reports and grow your portfolio?
This challenge helps you level up with expert feedback, hands-on workshops, webinars with MVPs, and visibility in our public results showcase. It’s a great way to learn, gain recognition, and connect with a supportive data community.
The challenge is hosted in partnership with FP20 Analytics, a LinkedIn community that brings together 22k+ passionate data professionals and helps new analysts improve their craft. It’s a welcoming space where you can practice, learn, and share your work with others.
➤ Live Workshops & 1:1 Mentoring
Learn from experienced Power BI professionals through practical workshops and one-on-one mentoring for tailored advice on your submission.
➤ Personalized Feedback
Receive detailed, constructive feedback on your report and improve your skills with real insights from experienced analysts.
➤ Free ZoomCharts Custom Visuals License
Get a ZoomCharts Developer License with full access to the Drill Down PRO visuals library.
➤ Free Report Downloads
Validated challenge participants receive 5 free downloads from the Power BI Report Gallery.
Live Winner Announcement
Winners will be announced during a special live webinar. Join the winner announcement and top submissions review to see standout reports, learn from the best entries, and celebrate the challenge results.
Follow these steps to register, build your Power BI report, submit your entry, and compete for the ZoomCharts Grand Prize.
If you have your own Microsoft account: select "See My License" and follow the setup instructions.
If you don’t have a work or school Microsoft account: select "See My Account" to activate a free Microsoft account provided by ZoomCharts exclusively for challenge participants.
Recommended pages
Up to 3 pages
Canvas size
16:9 or 1920 x 1080
Log in to your account on this page and upload your report in .pbix format for validation.
If your report does not meet all requirements:
You will receive an email explaining what needs to be fixed. You can update your report and submit it again.
Validation timeline:
Note: You may resubmit your entry as many times as needed before the challenge deadline.
To be eligible for all prizes, complete these steps:
Challenge Brief
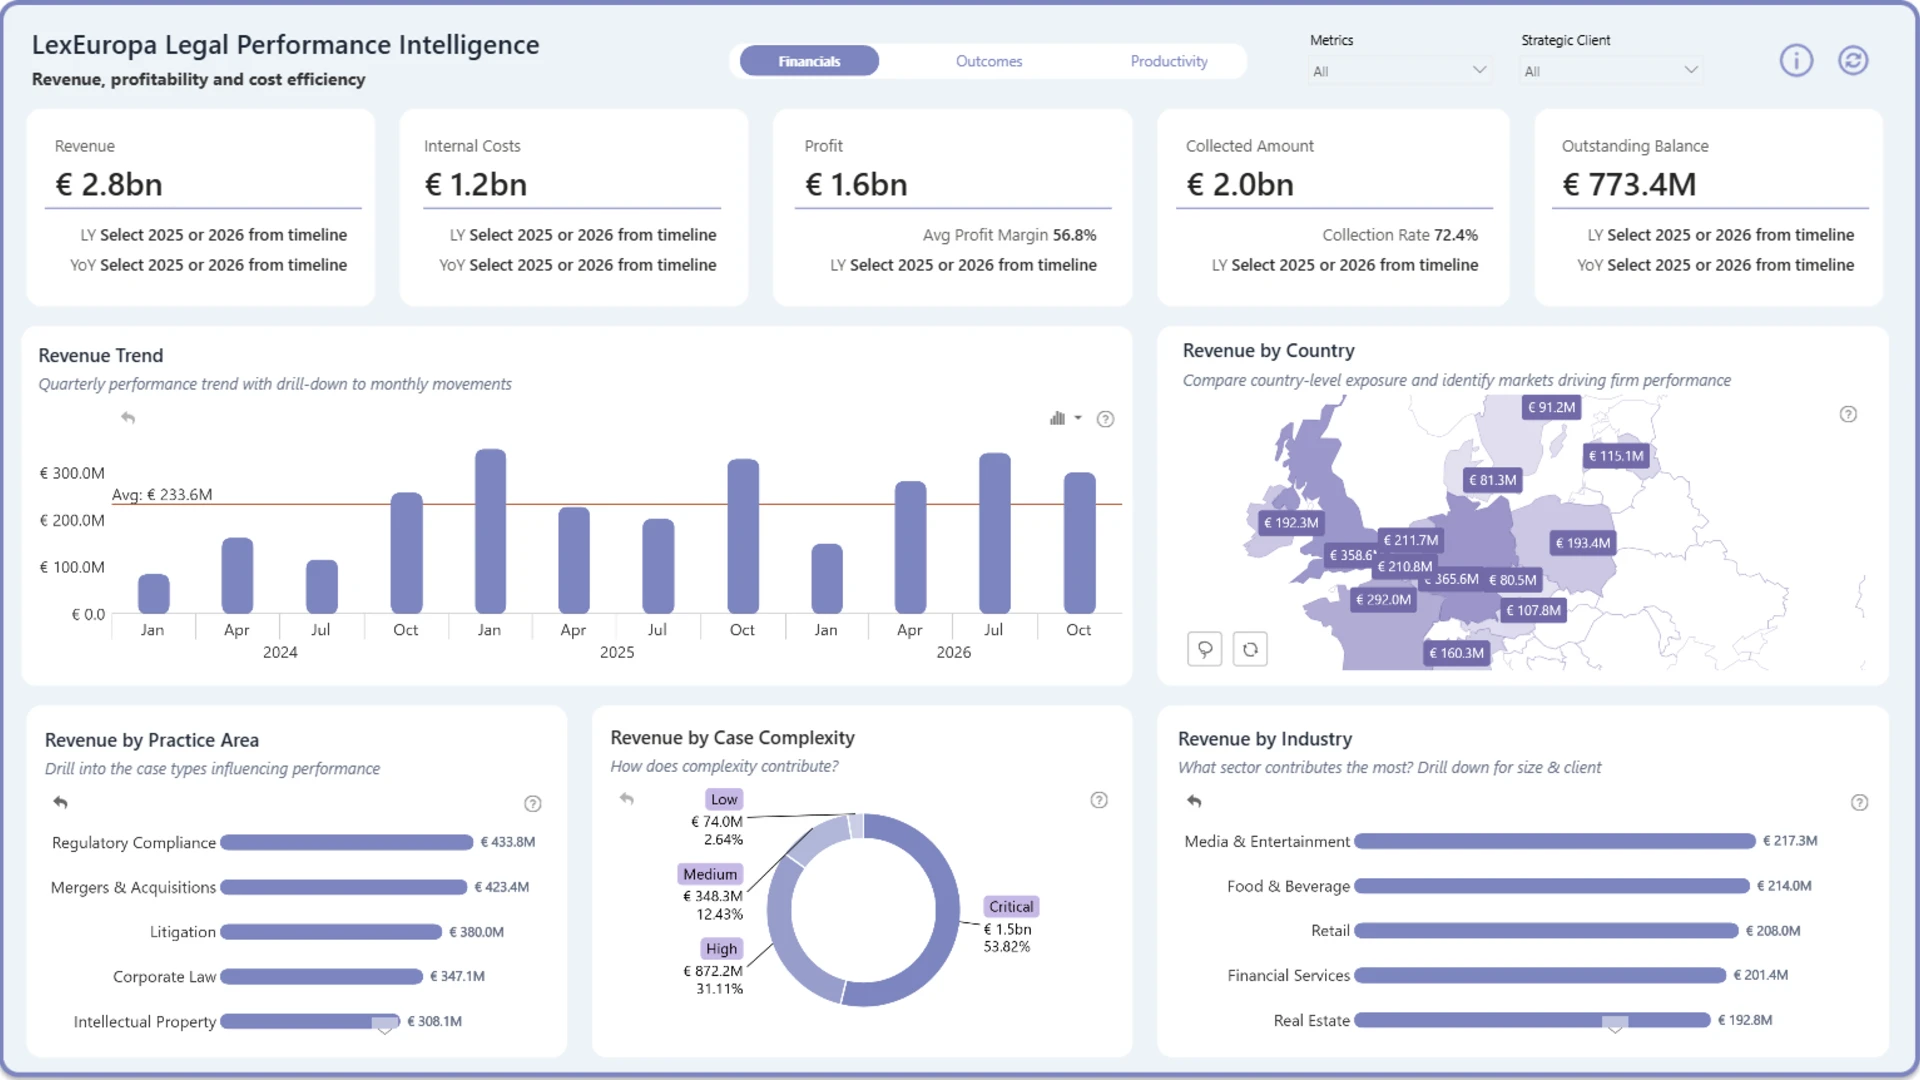
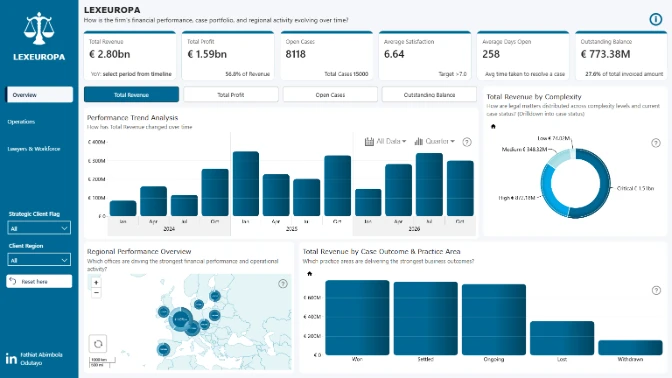
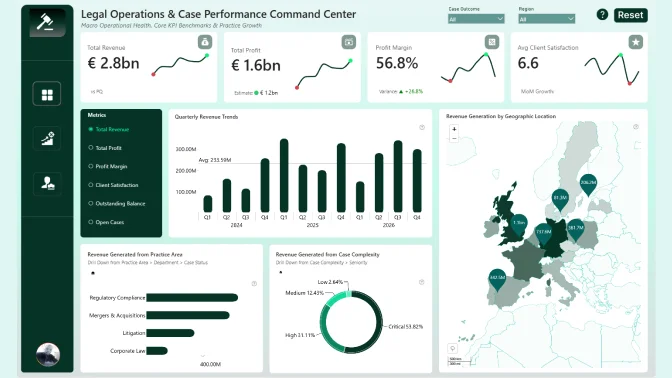
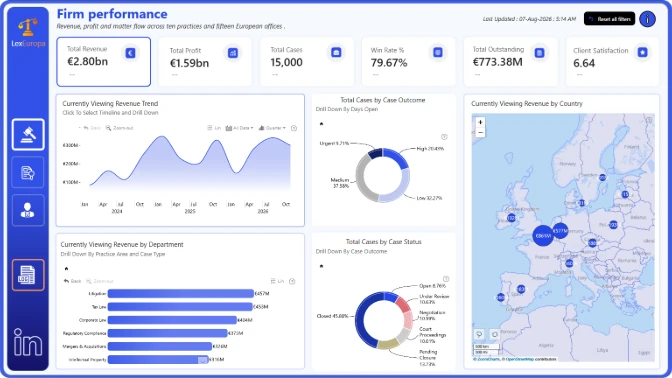
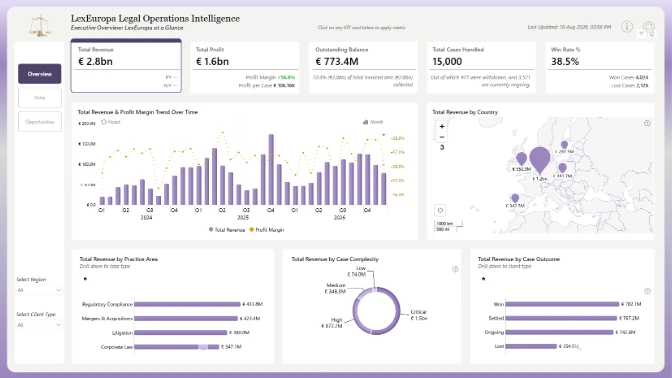
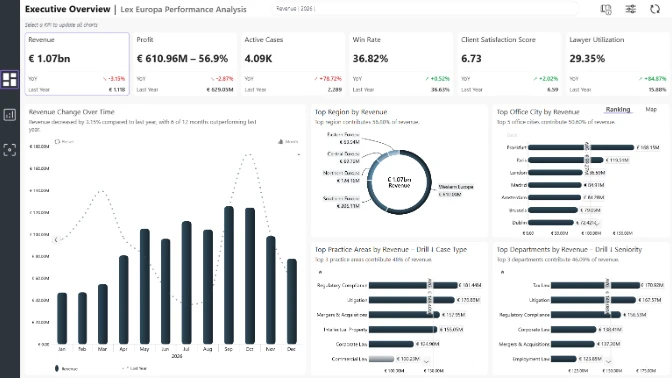
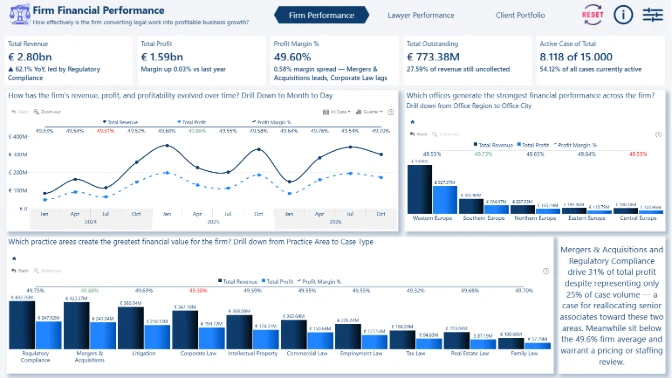
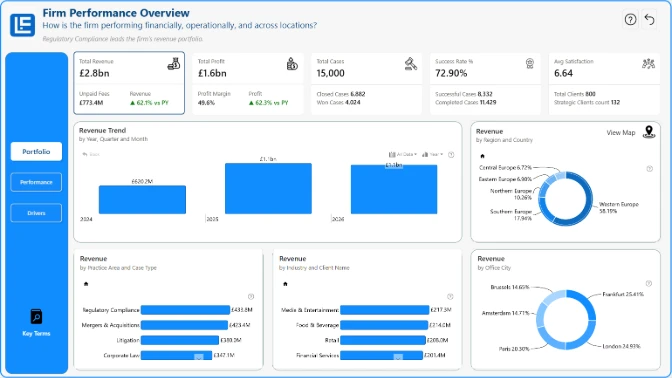
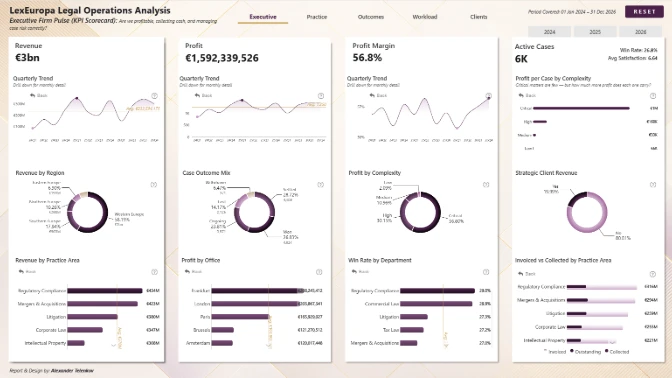
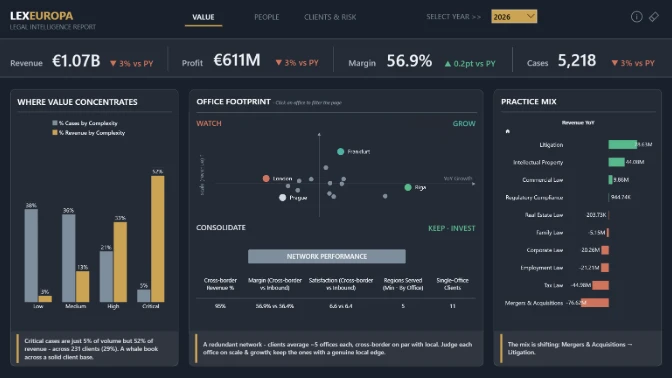
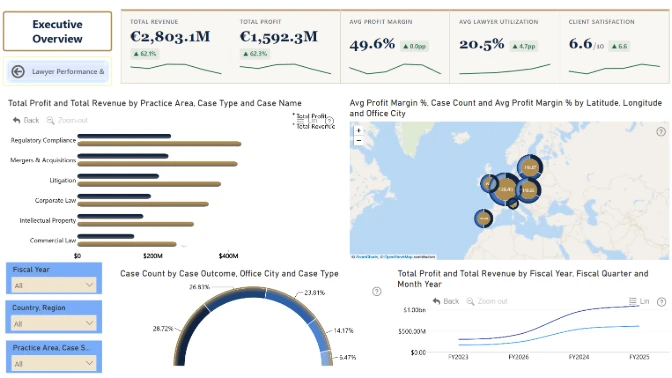
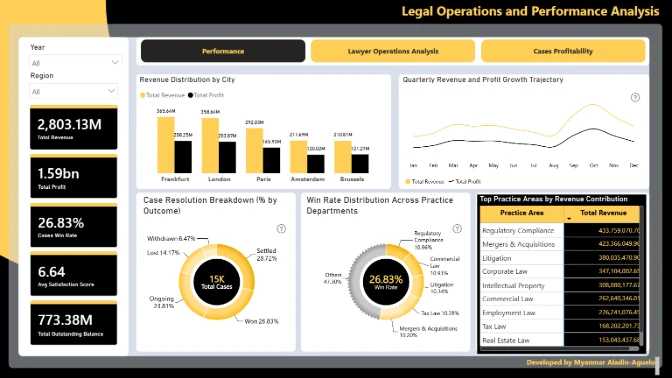
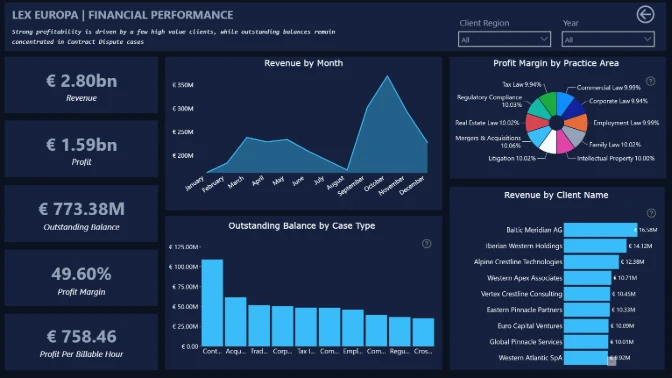
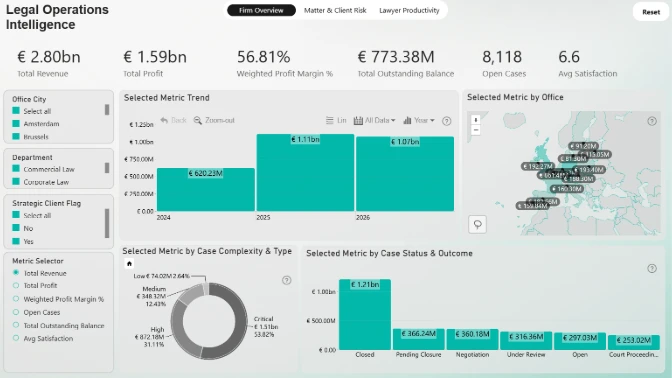
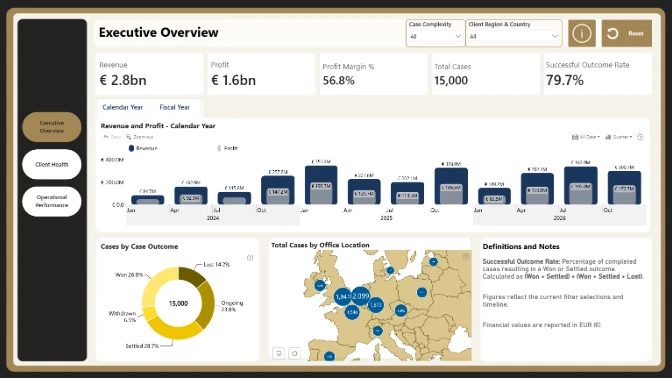
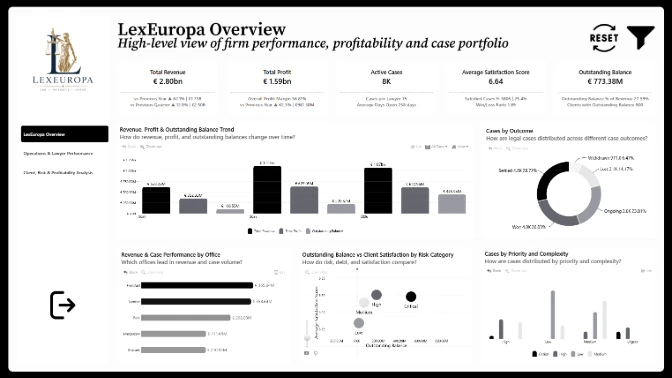
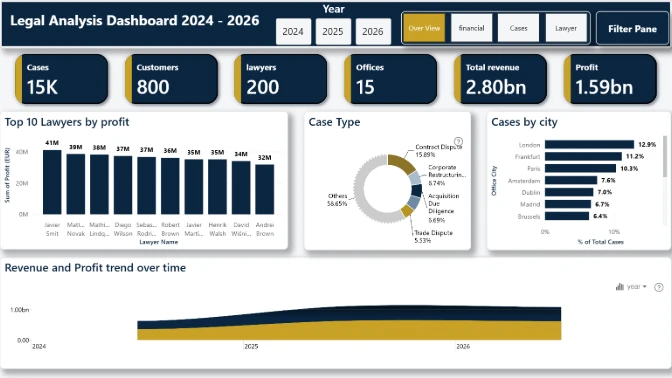
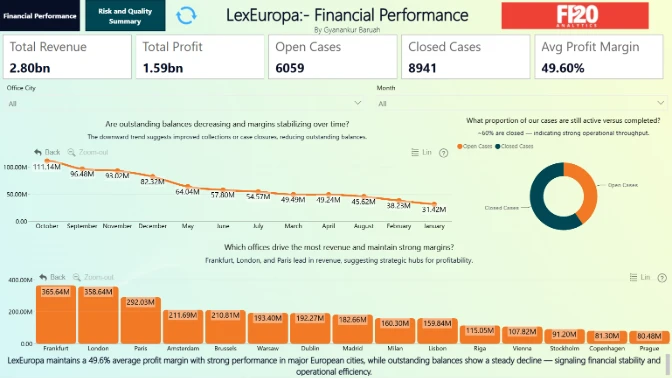
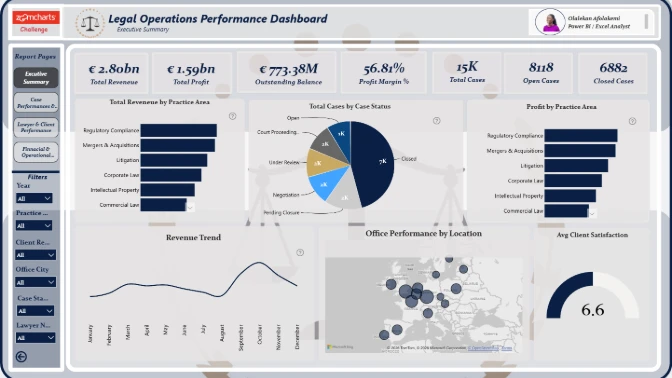
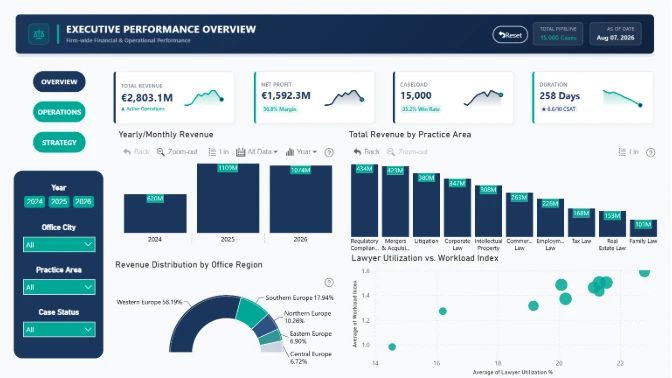
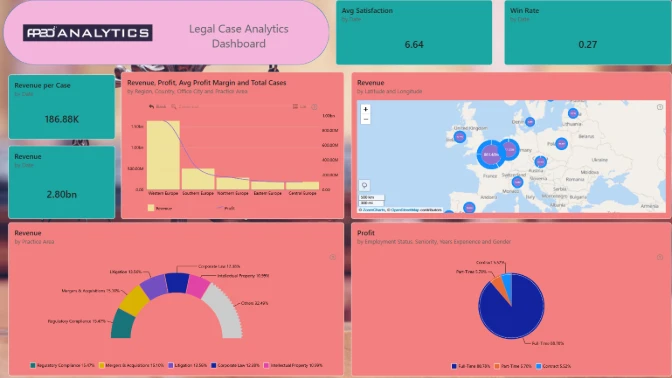
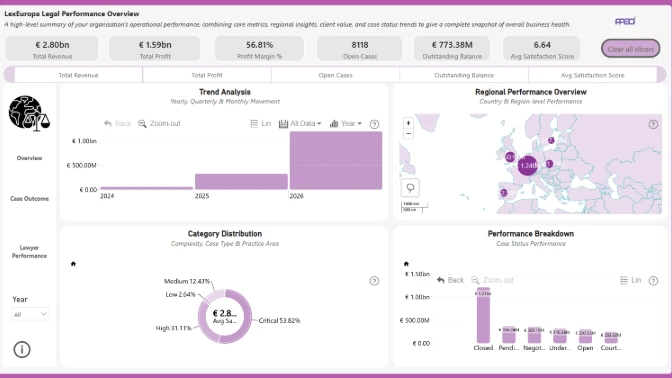
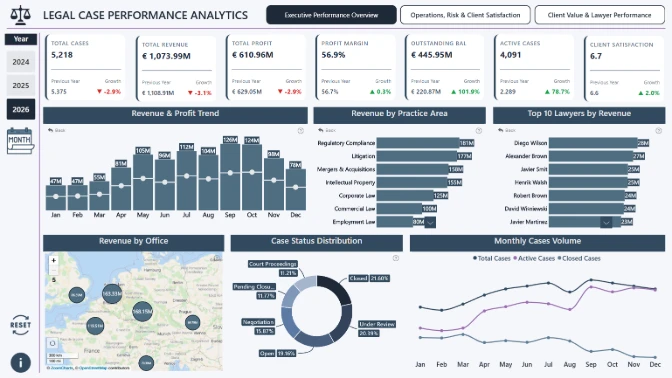
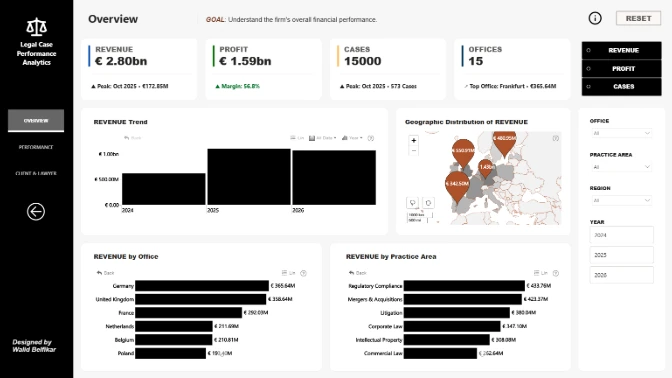
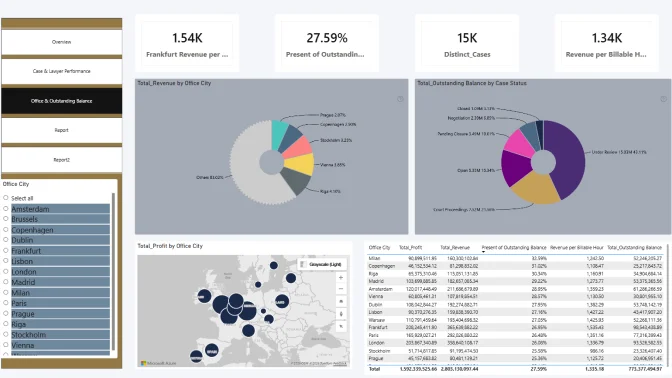
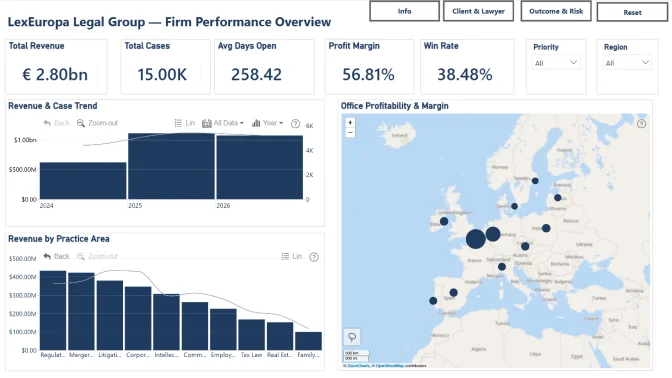
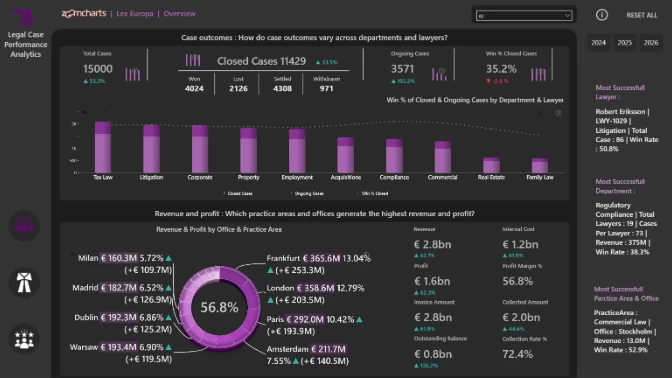
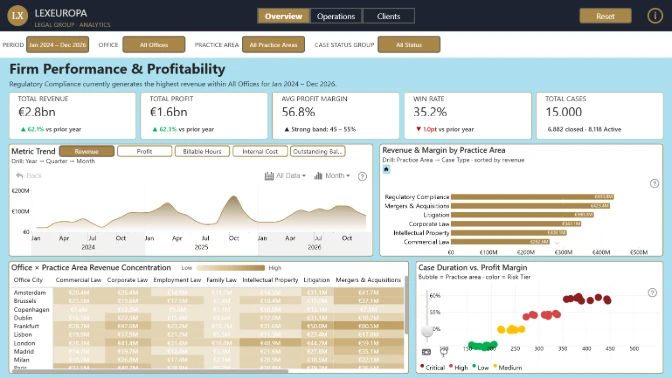
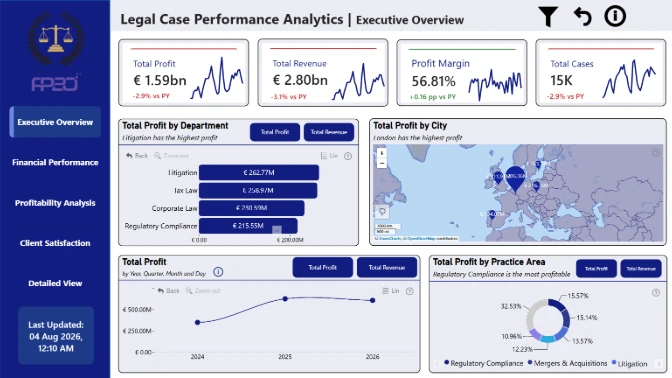
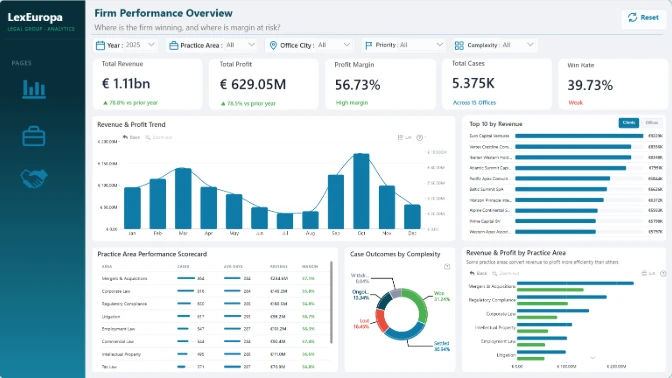
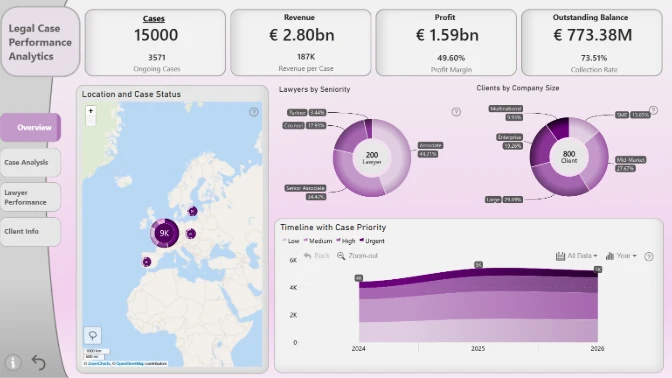
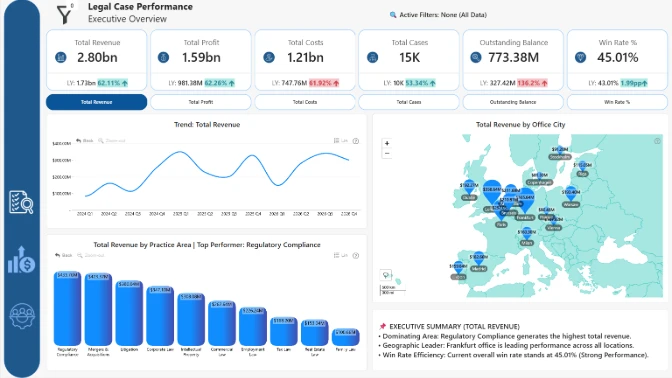
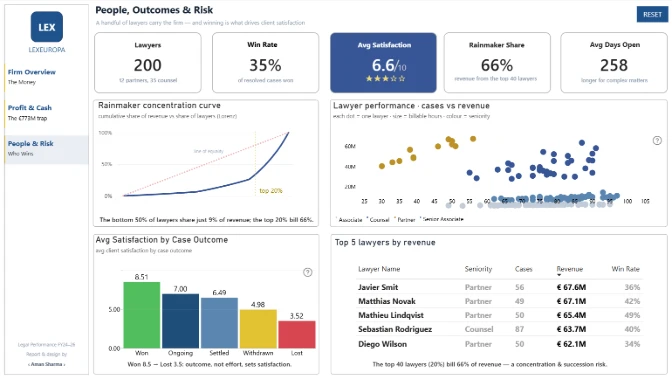
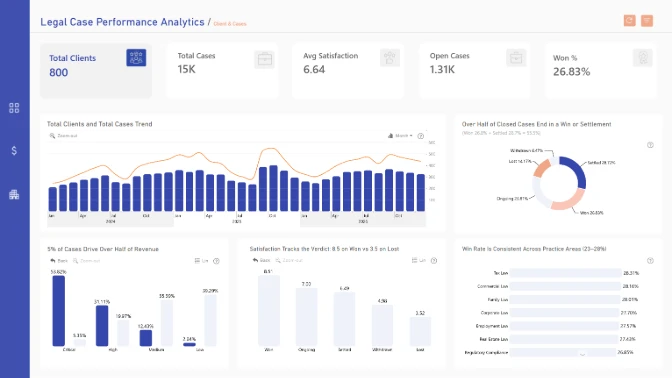
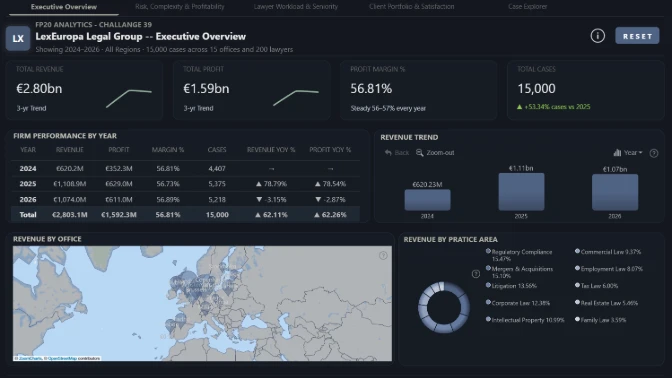
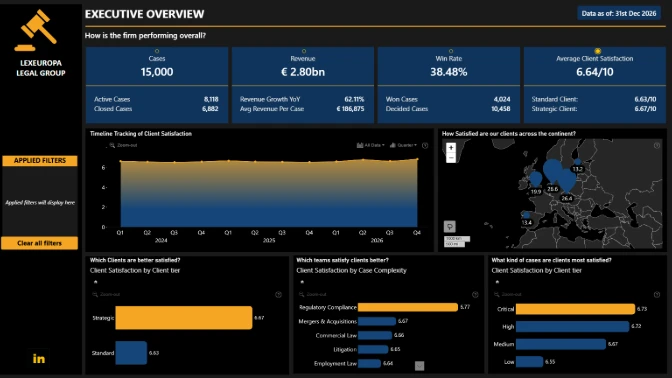
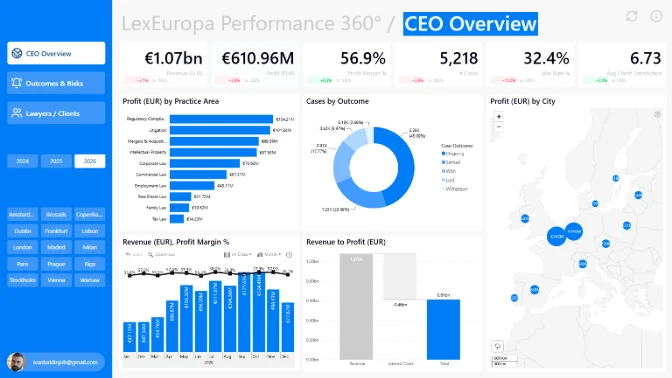
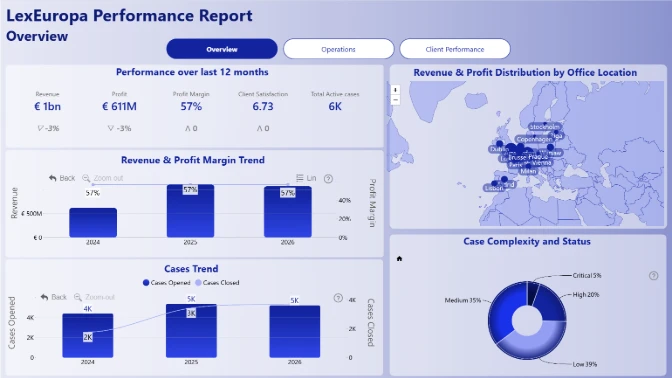
In the FP20 Analytics ZoomCharts Challenge 39, participants will work with a legal operations dataset from LexEuropa Legal Group, covering legal cases, lawyers, clients, offices, financial performance, case outcomes, workload, risk, and client satisfaction.
The goal is to create an insightful, decision-ready dashboard that helps partners and management teams monitor firm performance, improve profitability, optimize resource allocation, and understand what drives successful legal outcomes.
Revenue and profit
Which practice areas and offices generate the highest revenue and profit?
Case outcomes
How do case outcomes vary across departments and lawyers?
Lawyer workload
Which lawyers have the highest utilization and workload?
Risk and complexity
How do risk, case complexity, and duration impact profitability?
Client value
Which clients and practice areas contribute the most value?
Client satisfaction
How does client satisfaction relate to case performance?
Challenge starts
July 6, 2026
Workshop webinar
July 20, 2026
Submission deadline
August 6, 2026
23:59 BST / 22:59 UTC
Winners announcement webinar
August 12, 2026
Each report is evaluated based on three main criteria: Intuitiveness, Interactivity, and Insightfulness. These factors ensure that the report is accurate, functional, user-friendly, and ready to be presented to end users.
How clear and easy is the report to understand at a glance?
How engaging and seamless is the report exploration experience?
How accurate, complete, and meaningful is the data for decision-making?
Total possible score: 45 points. A strong submission should be easy to understand, smooth to explore, and rich enough to support meaningful decisions.
Workshop | Build a Legal Case Performance Dashboard in Power BI
Workshop | Build a Legal Case Performance Dashboard in Power BI
20 July | 07:00
-
Webinar | Top 5 Legal Case Performance Dashboards in Power BI
Webinar | Top 5 Legal Case Performance Dashboards in Power BI
12 August | 08:00
06 July - 06 August