361
Law Firm KPI Dashboard Power BI Example
Law Firm KPI Dashboard Power BI Example
More Report pages
Report Author: Prosper Oguzie
361
Share template with others
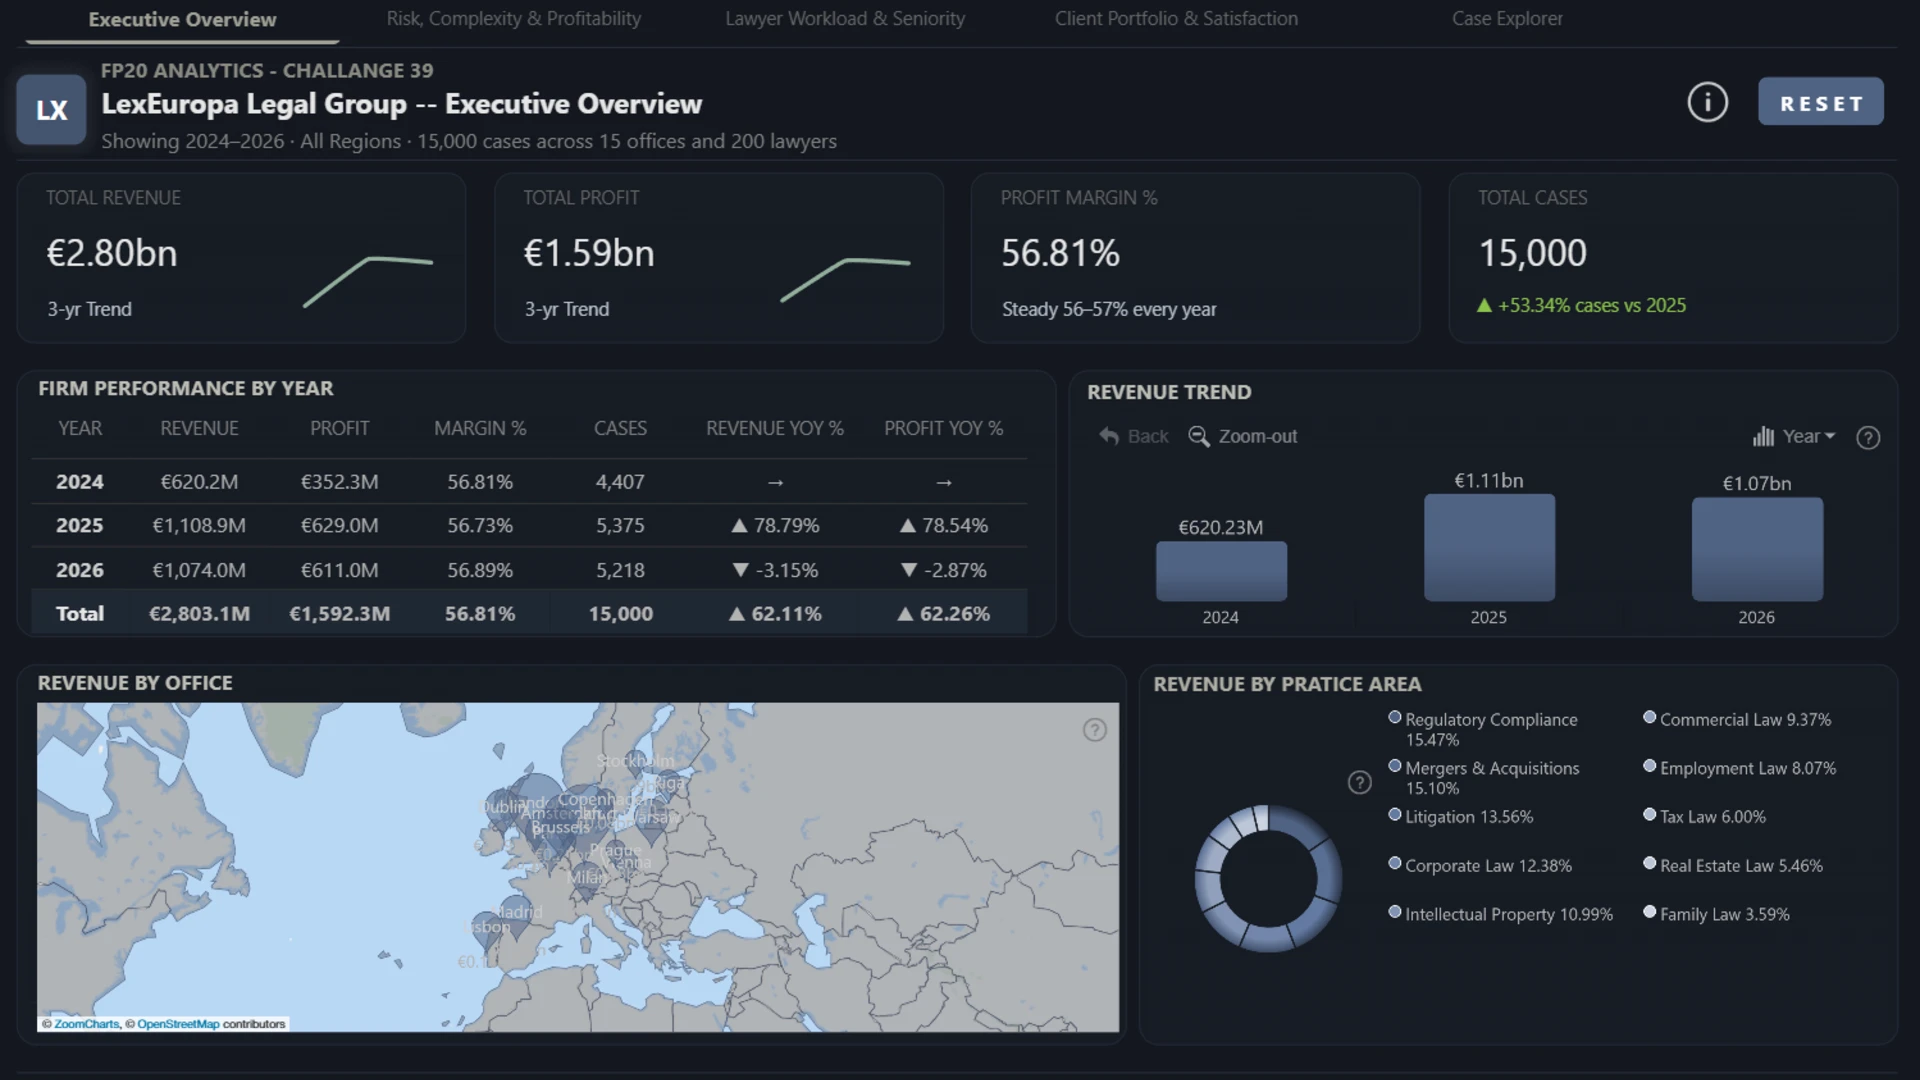
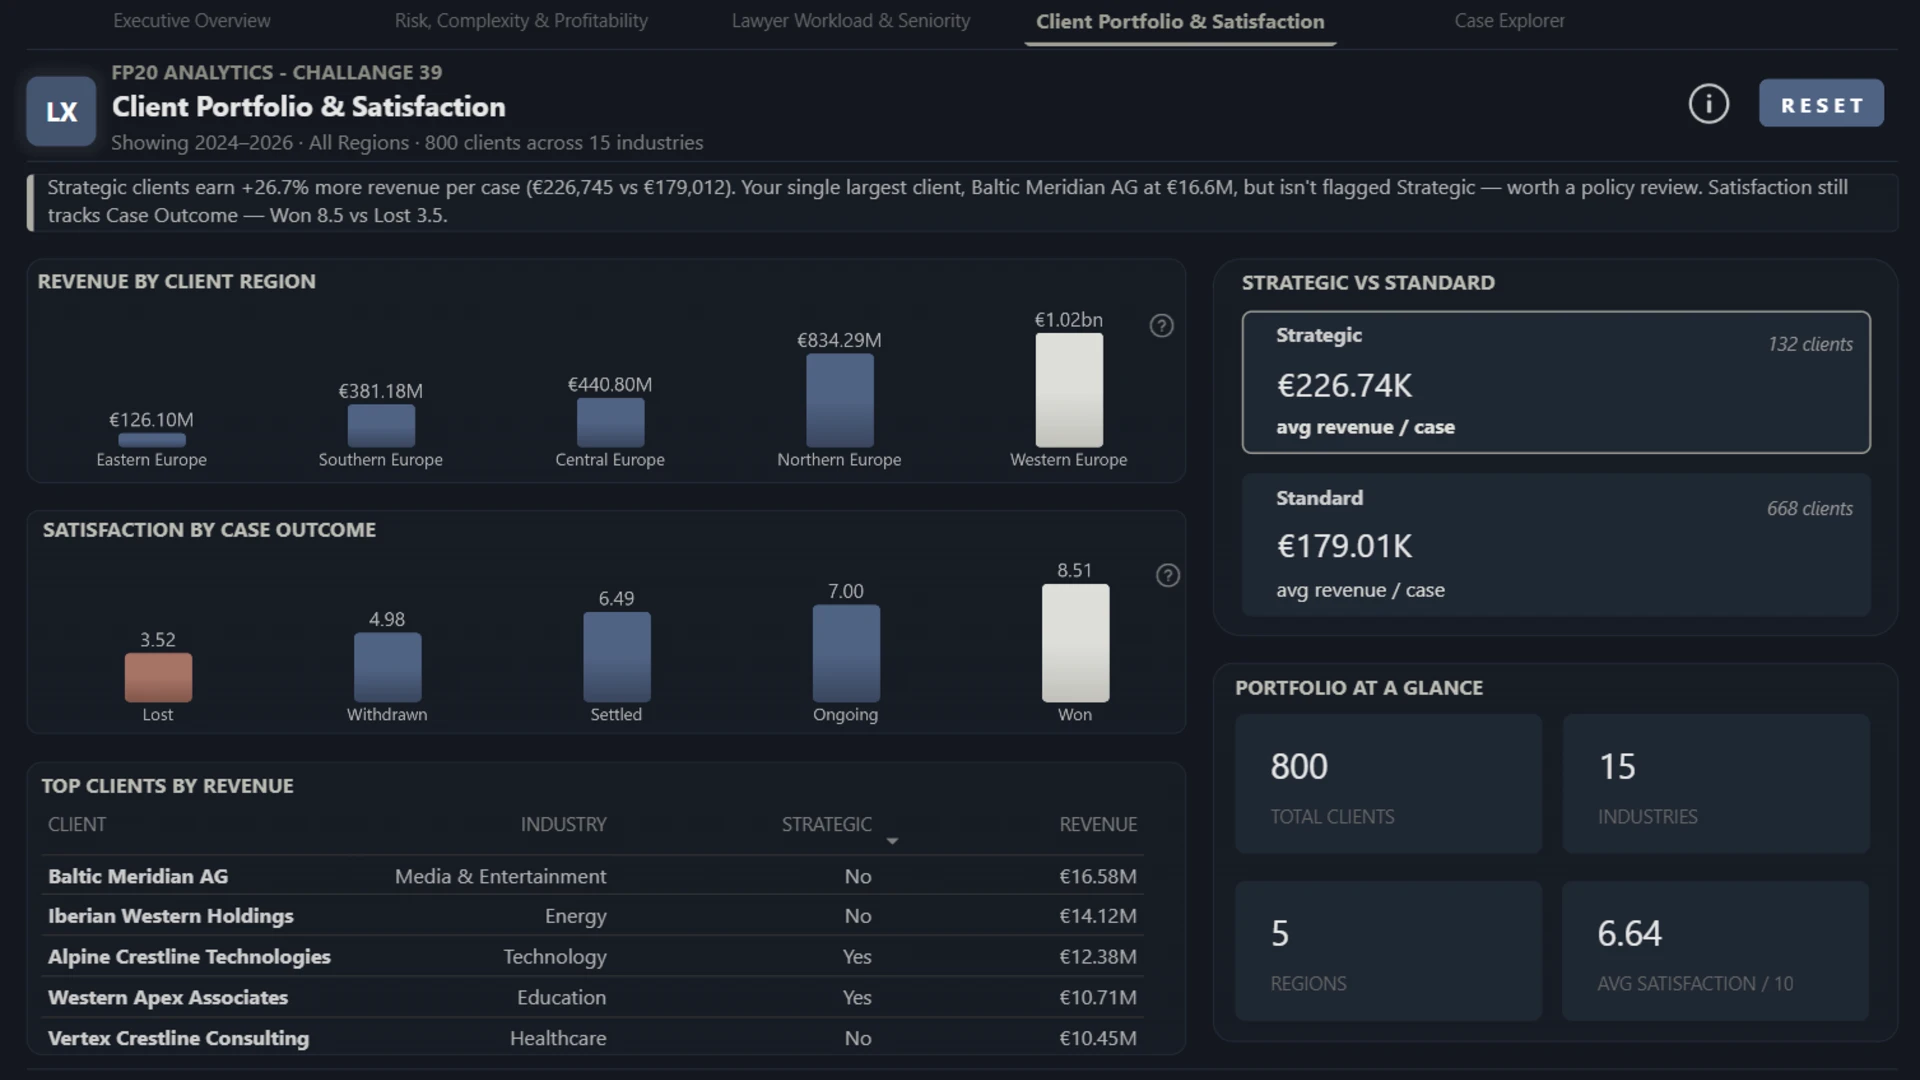
Discover a law firm KPI dashboard example in Power BI for tracking revenue, profit, case outcomes, utilization, risk, satisfaction, and office performance.
Author’s Description:
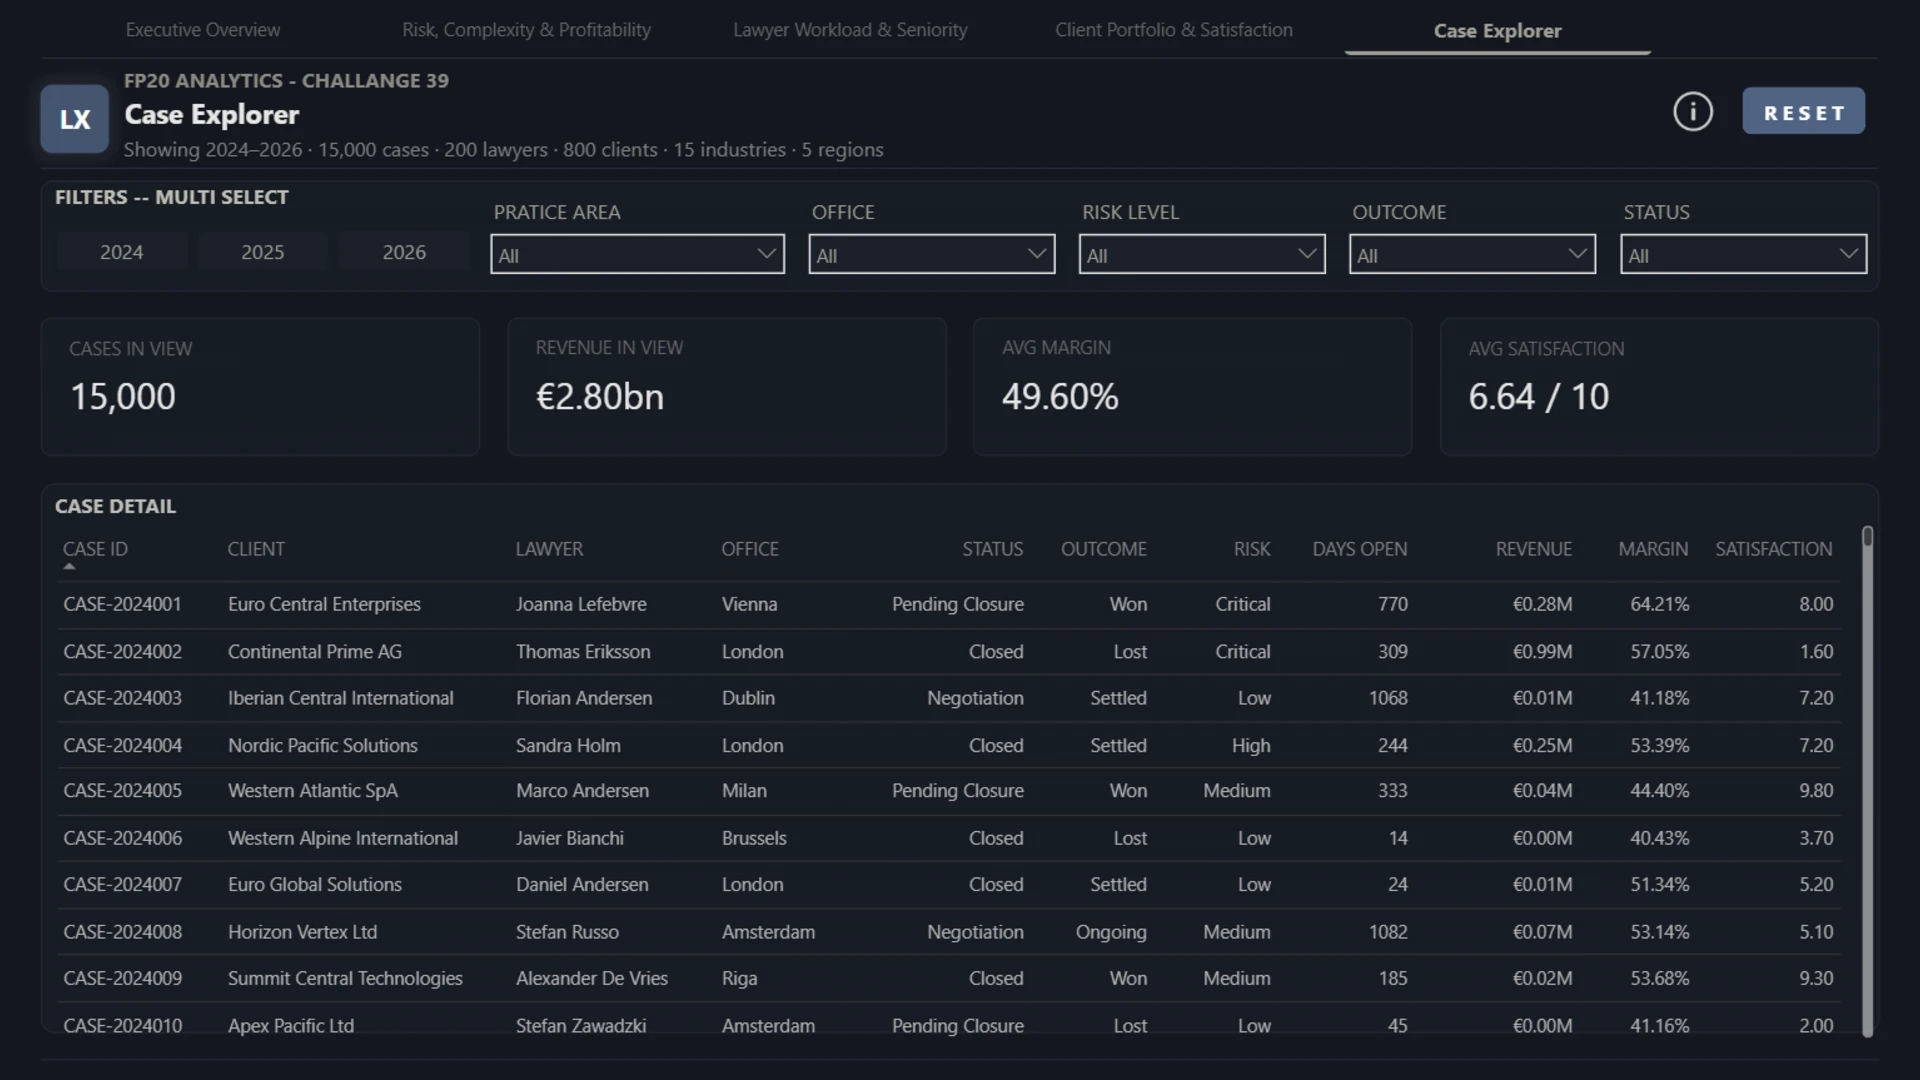
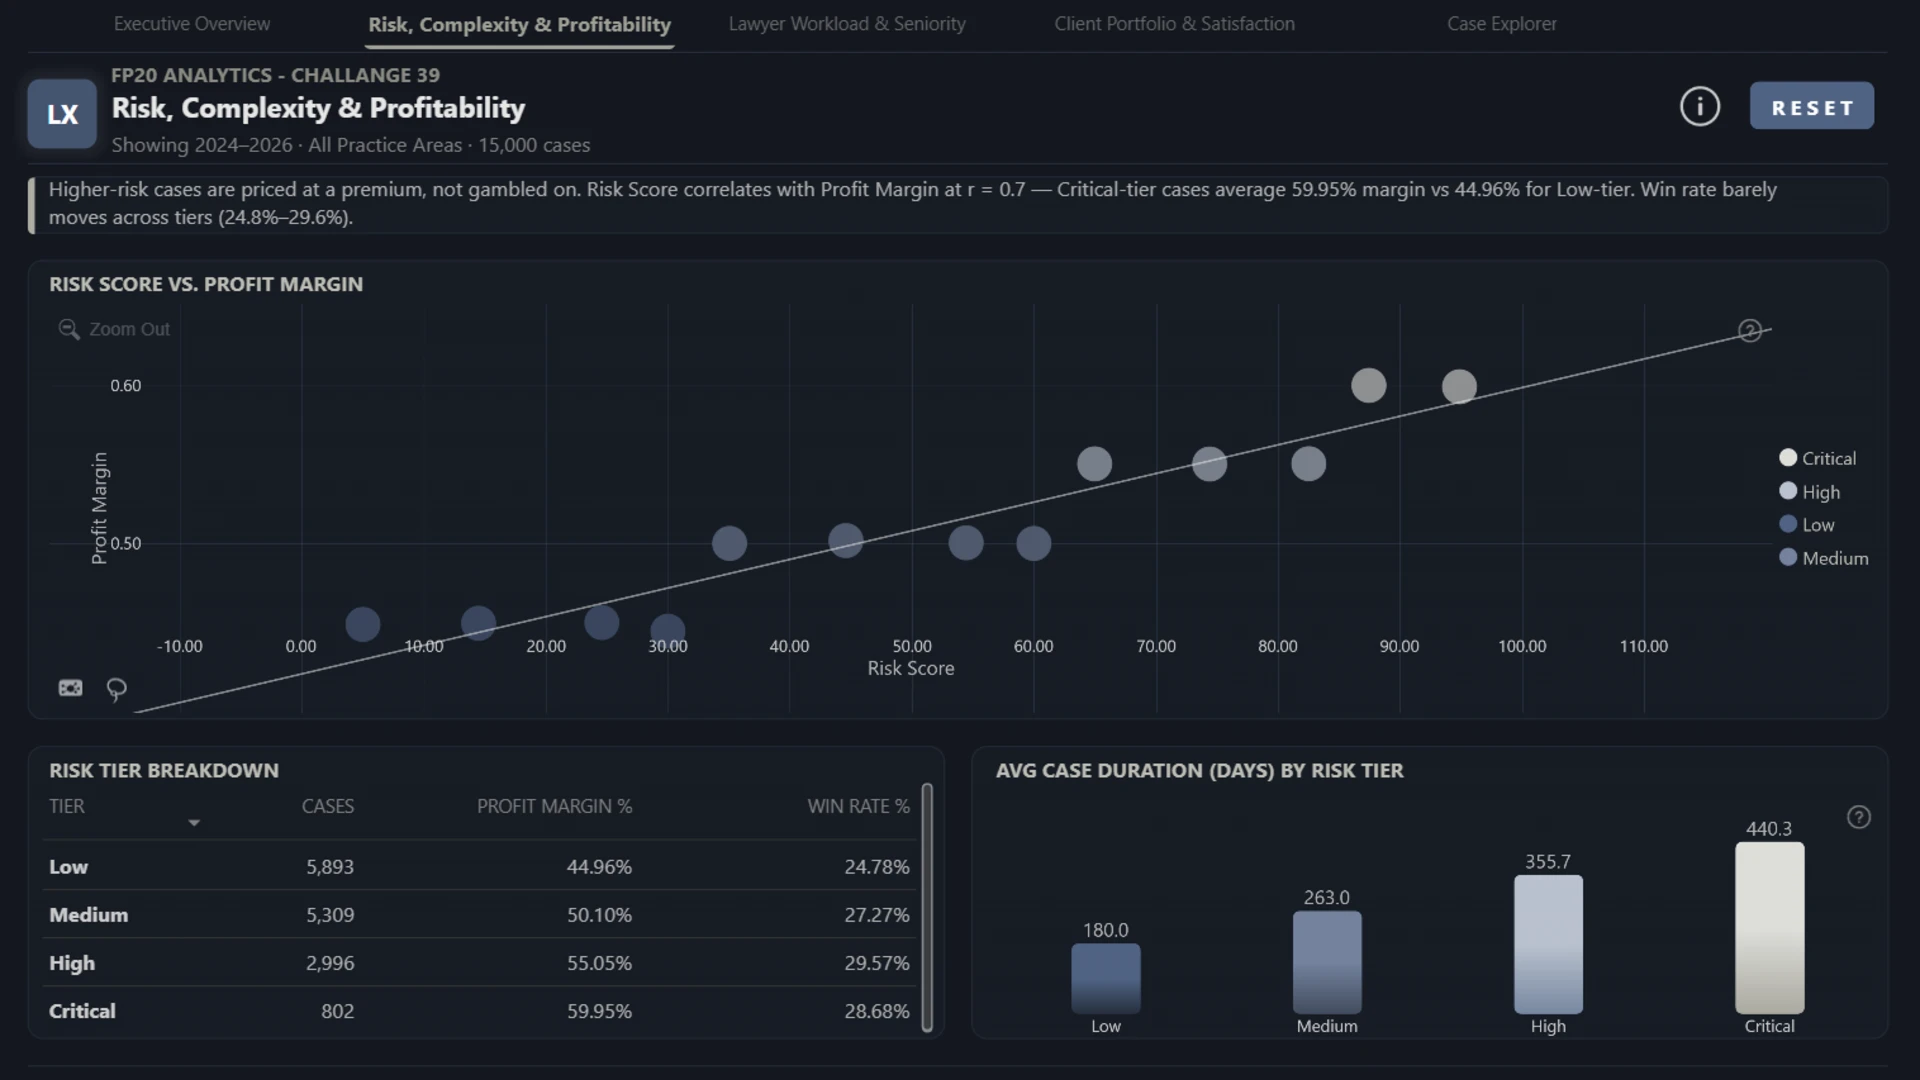
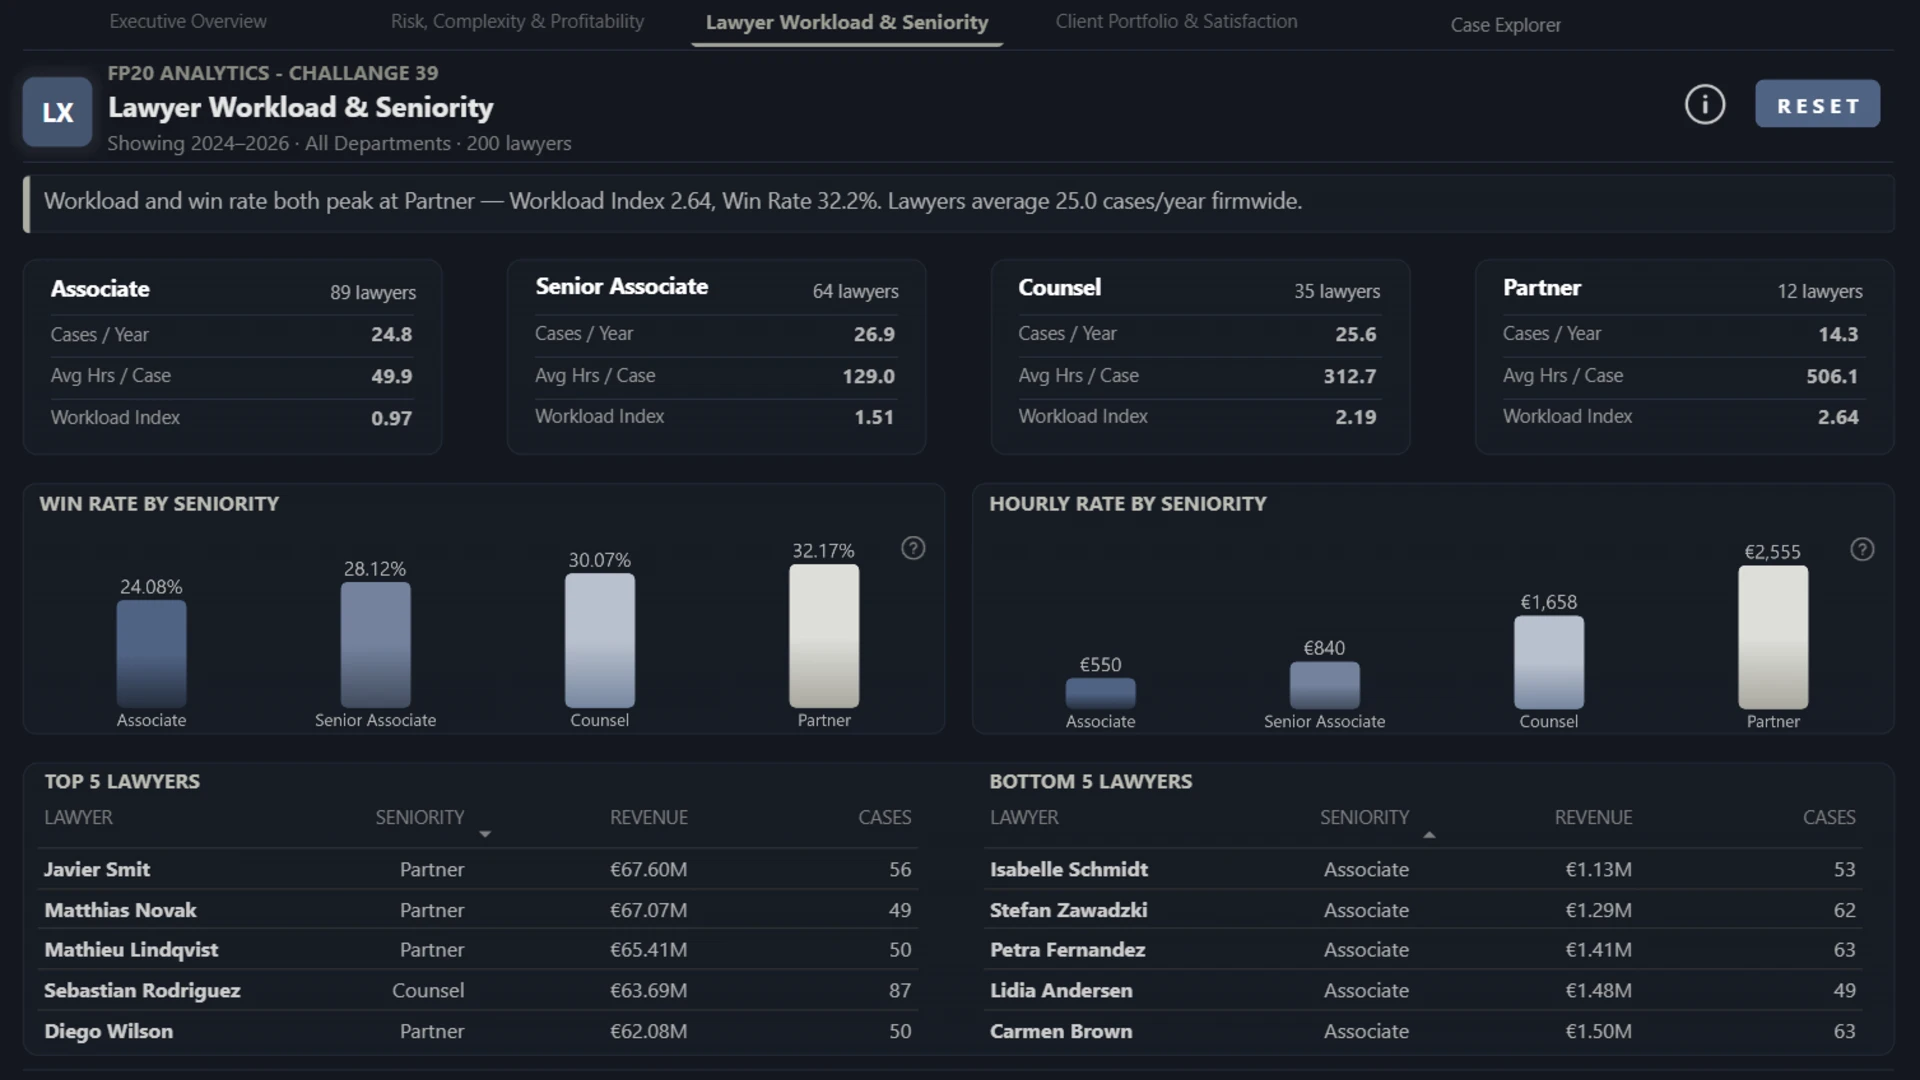
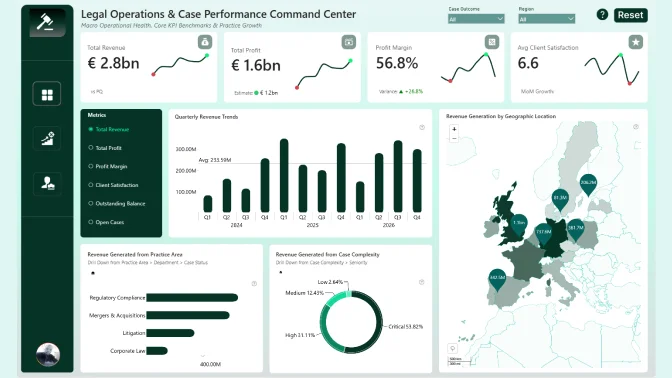
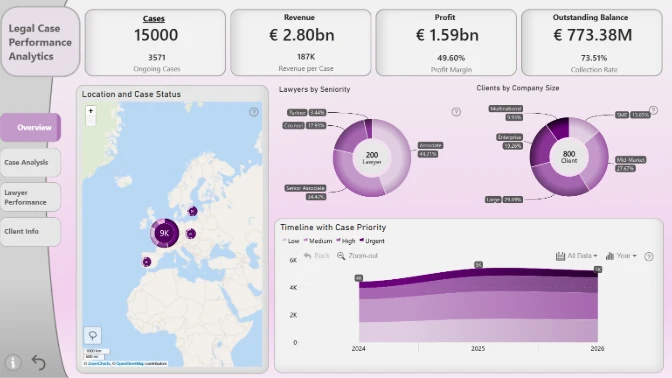
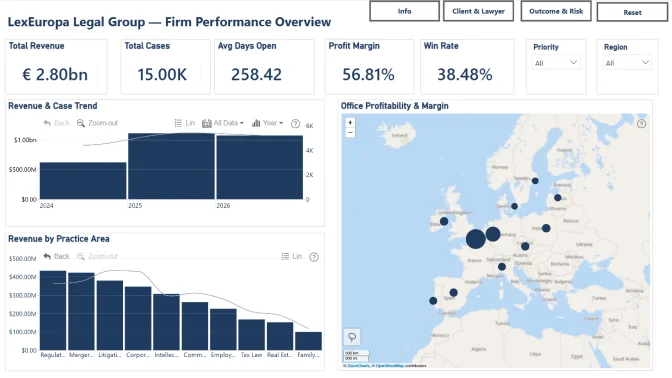
LexEuropa Legal Group - Legal Operations Performance Dashboard A five-page Power BI report for LexEuropa's partners covering firm performance, risk-adjusted profitability, lawyer workload by seniority, and client value - built with ZoomCharts Drill Down visuals and dynamic DAX-driven insights that update live with filters. The standout finding: a 0.70 correlation between case risk and profit margin, meaning high-risk work is priced at a premium, not gambled on. Includes a fully filterable case-level explorer page for drilling into the raw records behind any number.
ZoomCharts visuals used





4U Report Challenges
Participate in data challenges, build and submit reports to get free template downloads.
Join CommunityMobile view allows you to interact with the report. To Download the template please switch to desktop view.
How to use a PBIX template
Preview the interactive report, download the PBIX file, open it in Power BI Desktop, and replace the same data connection with your own dataset.
Preview and download
Explore the report online and download the PBIX template file.
Open in Power BI Desktop
Open the downloaded PBIX file in Power BI Desktop.
Connect your data
Replace the sample data source with your own dataset.
Refresh and adjust
Refresh the model and update fields or visual were needed.
Save and share
Save your report and publish it for your audience.


