1293
Legal Financial Performance Power BI Dashboard
Legal Financial Performance Power BI Dashboard
More Report pages
Report Author: Ugochukwu Nwasuruba
1293
Share template with others
Monitor legal financial performance with a Power BI dashboard for revenue, profit, practice areas, offices, cases, lawyers, clients, risk, and complexity.
Author’s Description:
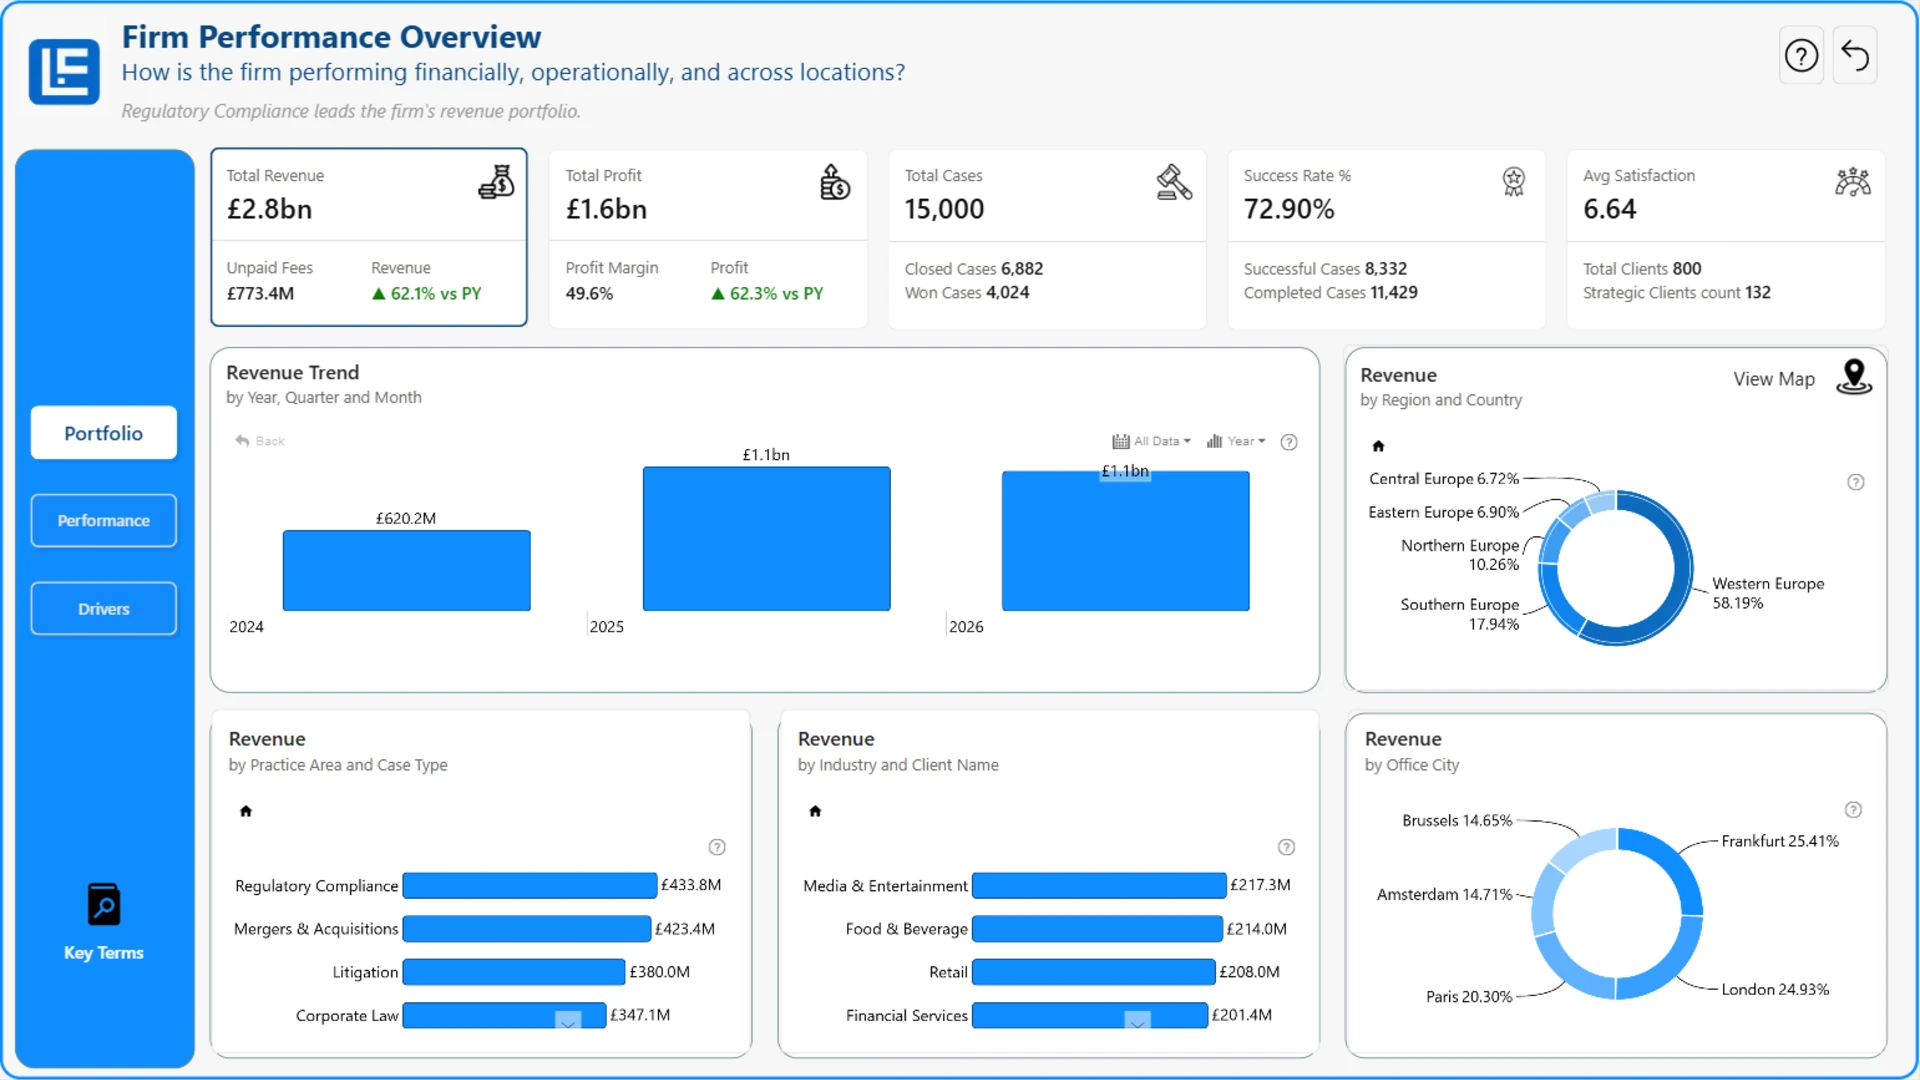
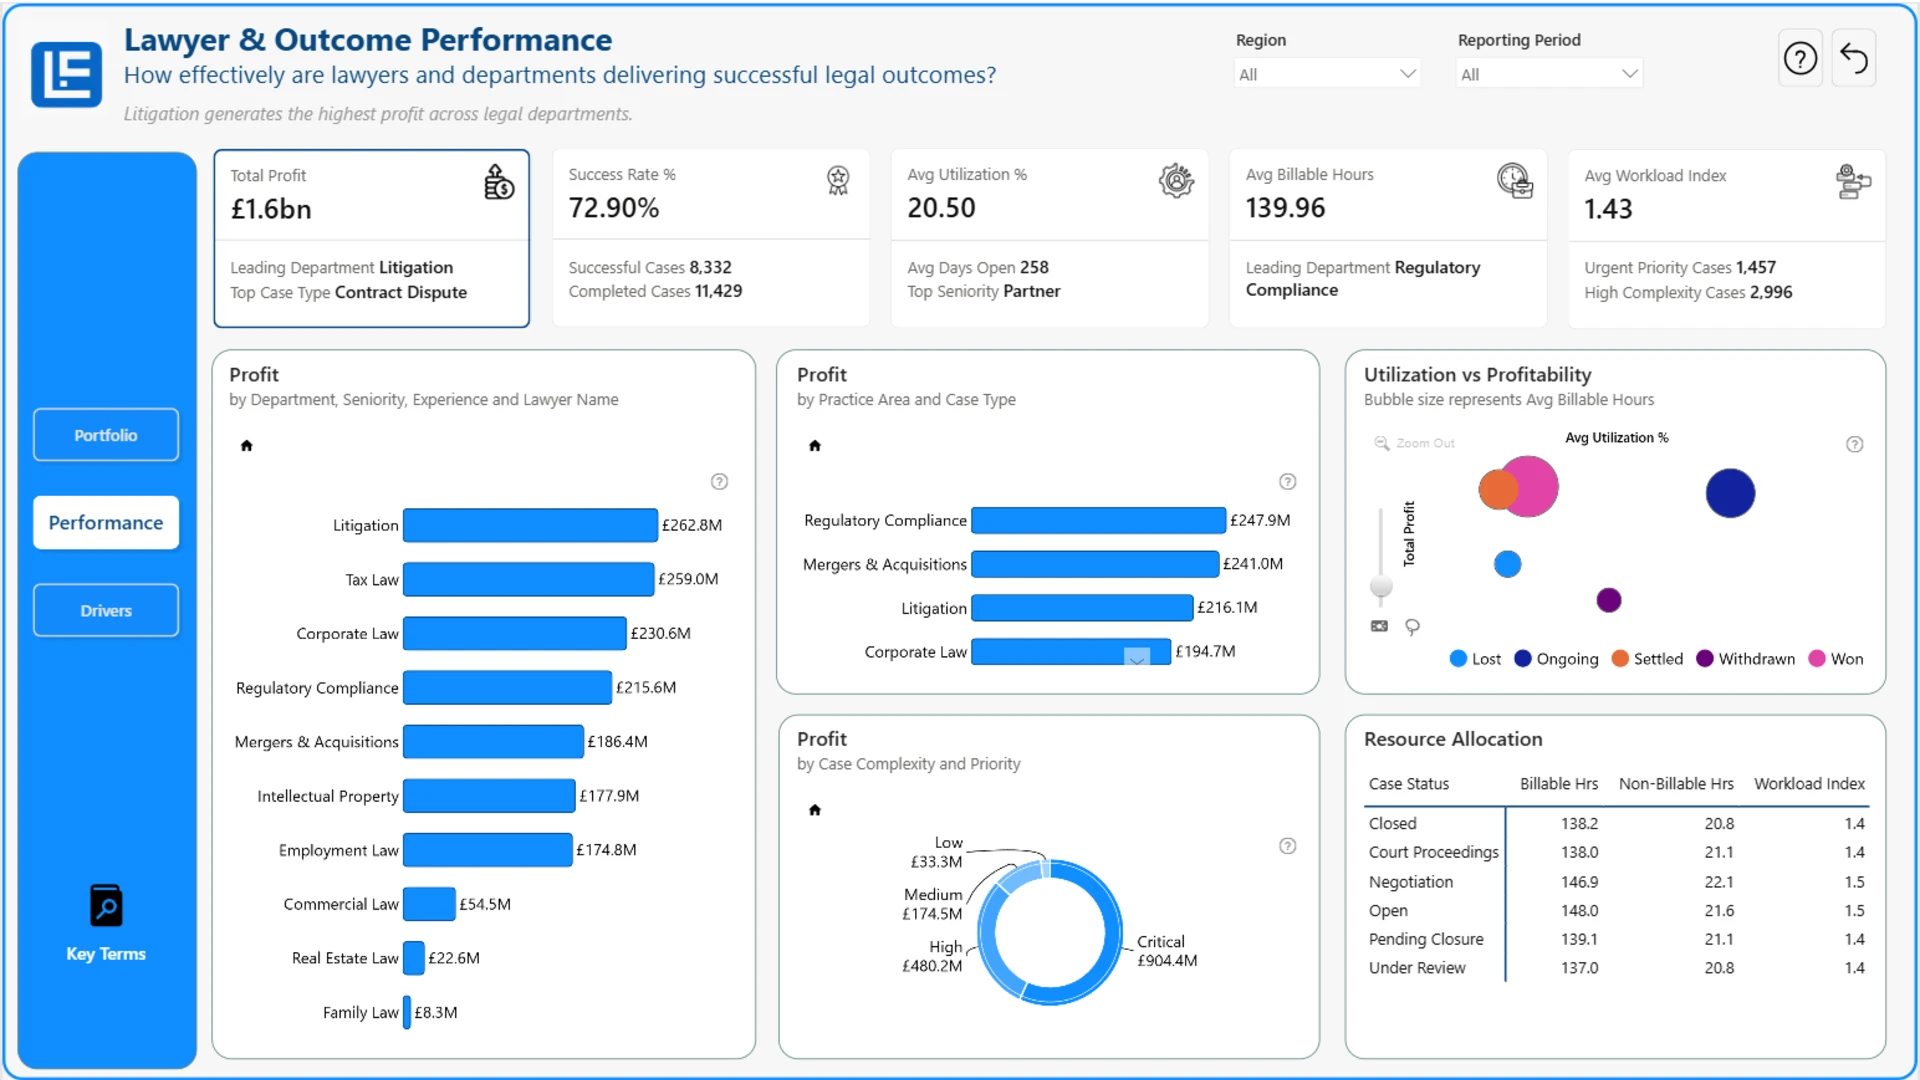
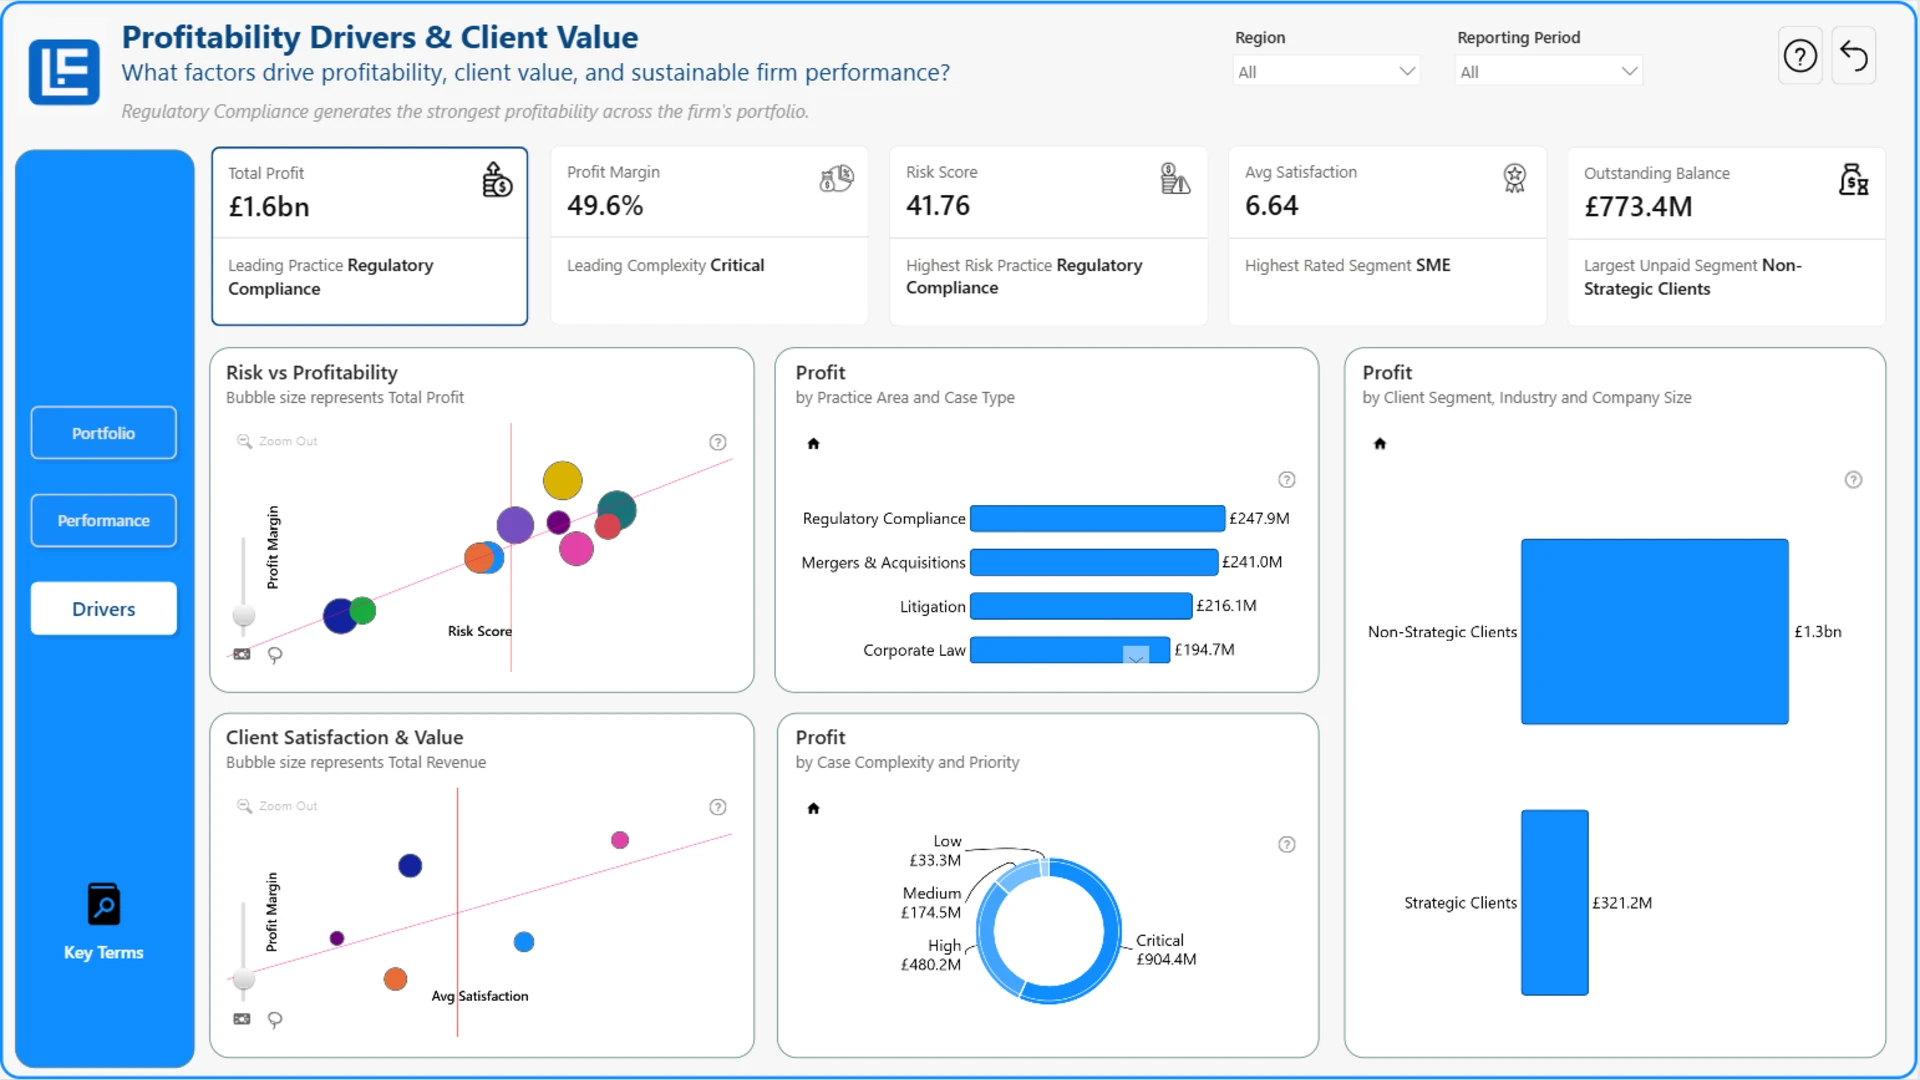
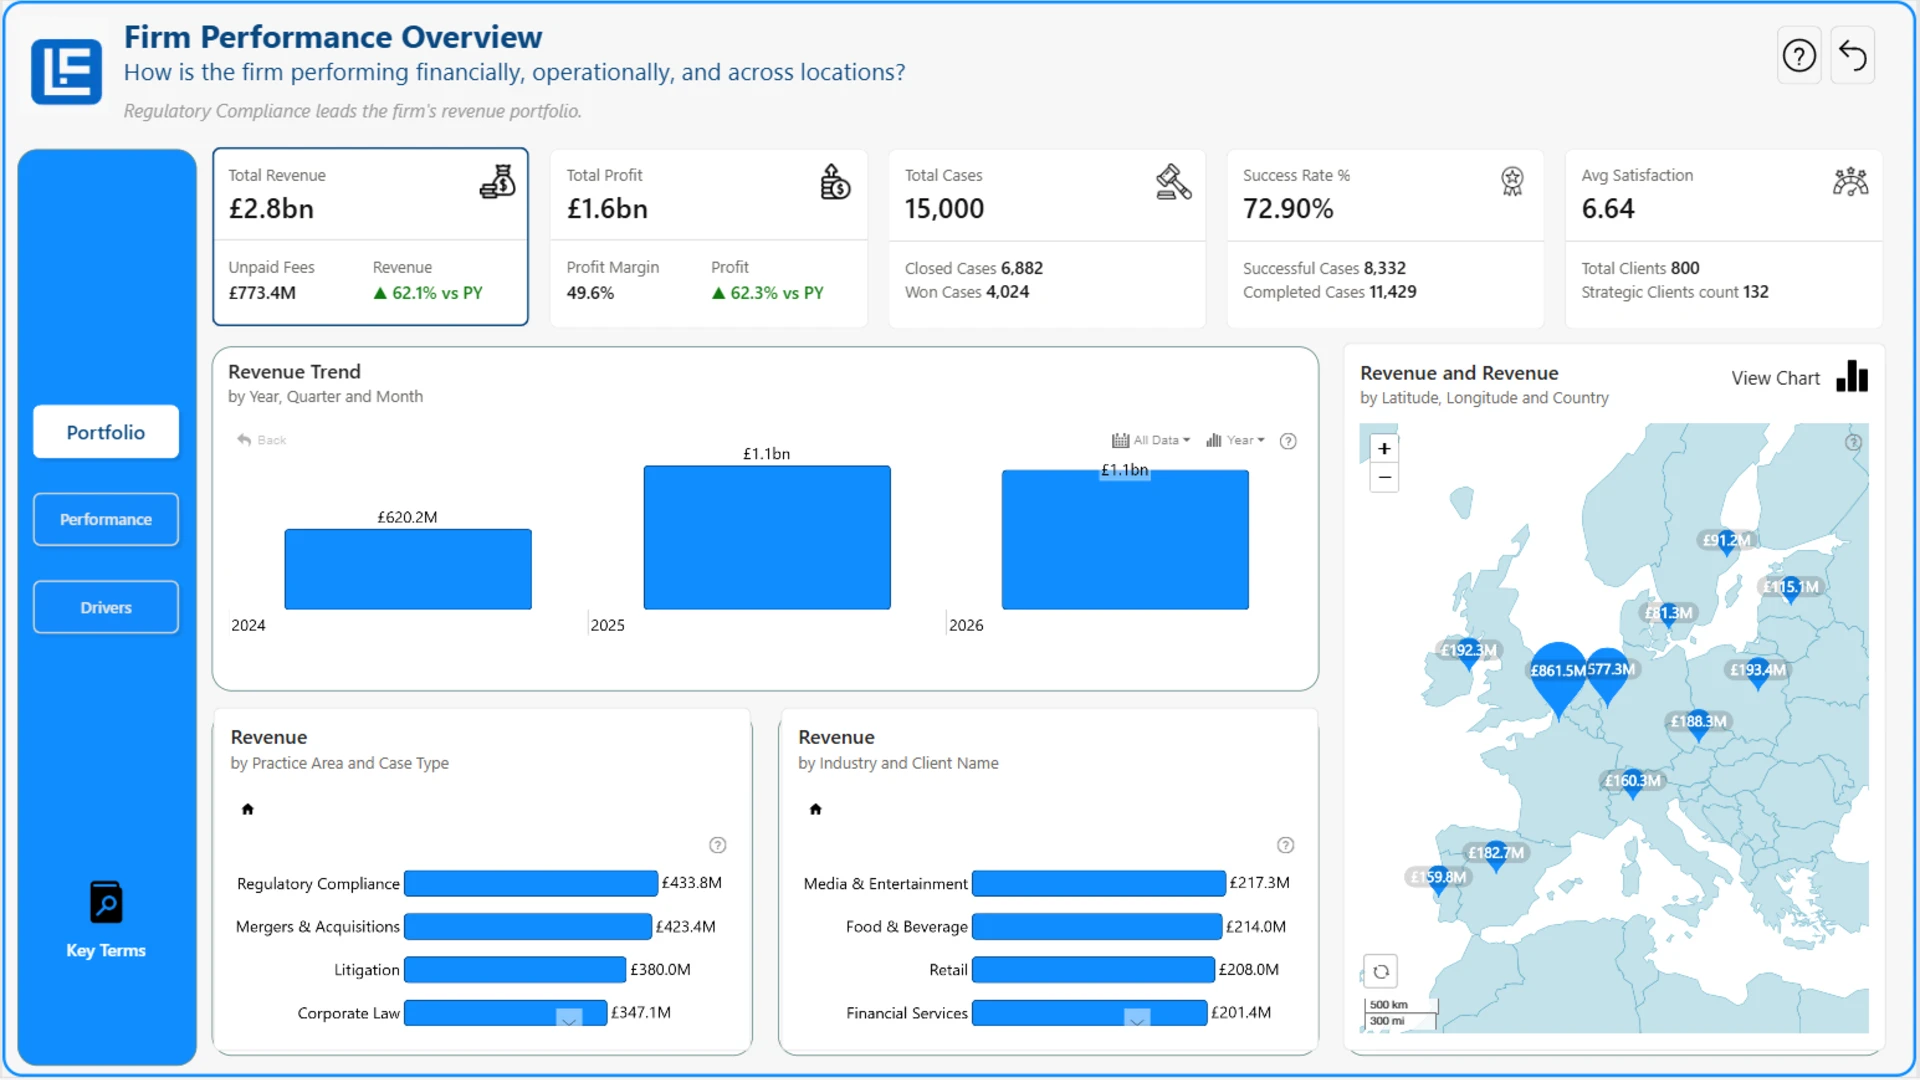
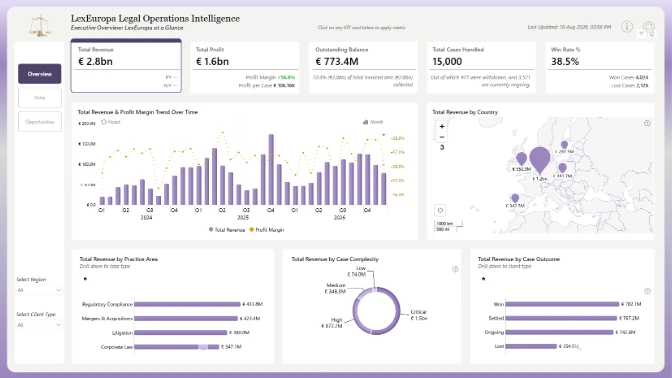
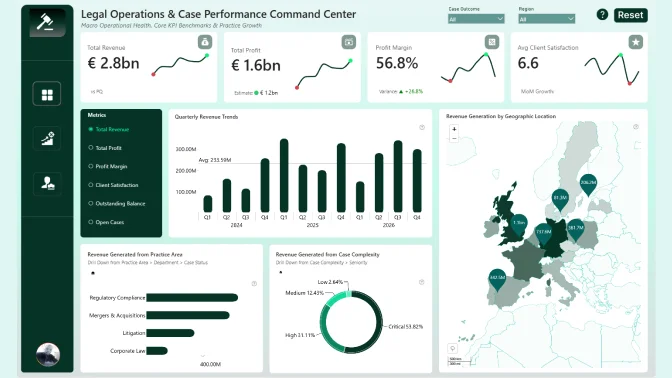
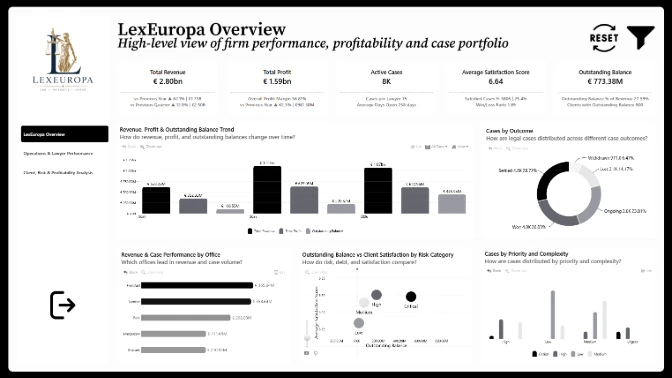
Legal Performance & Profitability Dashboard This interactive dashboard provides a comprehensive view of a law firm's performance, helping leadership understand what is happening, who is driving results, and why performance varies across the business. The report is structured into three analytical perspectives: Overview: Financial, operational, and geographic performance across the firm. Performance: Lawyer, department, and matter performance, with insights into utilization, workload, and legal outcomes. Drivers: Profitability, risk, client value, and the key factors influencing sustainable firm performance.
ZoomCharts visuals used





4U Report Challenges
Participate in data challenges, build and submit reports to get free template downloads.
Join CommunityMobile view allows you to interact with the report. To Download the template please switch to desktop view.
How to use a PBIX template
Preview the interactive report, download the PBIX file, open it in Power BI Desktop, and replace the same data connection with your own dataset.
Preview and download
Explore the report online and download the PBIX template file.
Open in Power BI Desktop
Open the downloaded PBIX file in Power BI Desktop.
Connect your data
Replace the sample data source with your own dataset.
Refresh and adjust
Refresh the model and update fields or visual were needed.
Save and share
Save your report and publish it for your audience.


