518
Legal Practice Area Performance Dashboard
Legal Practice Area Performance Dashboard
More Report pages
Report Author: Kenneth Amobi
518
Share template with others
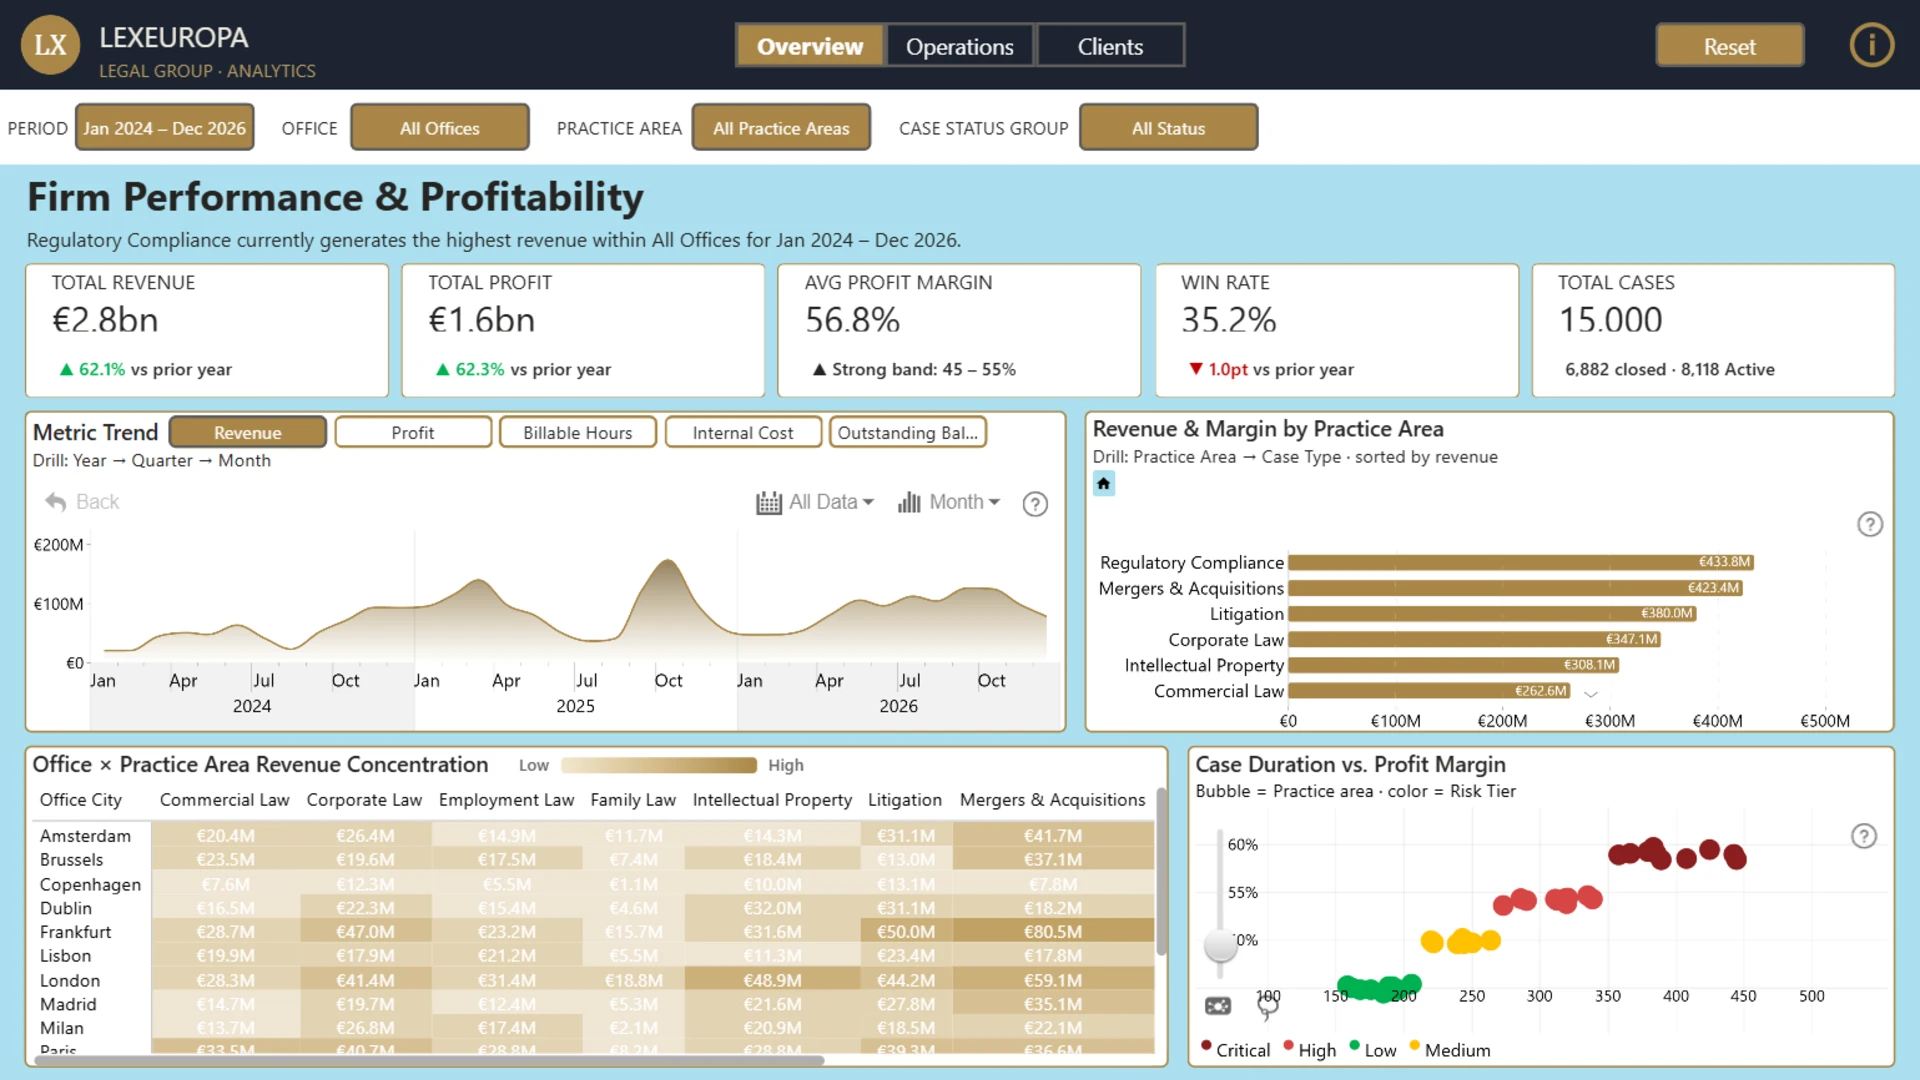
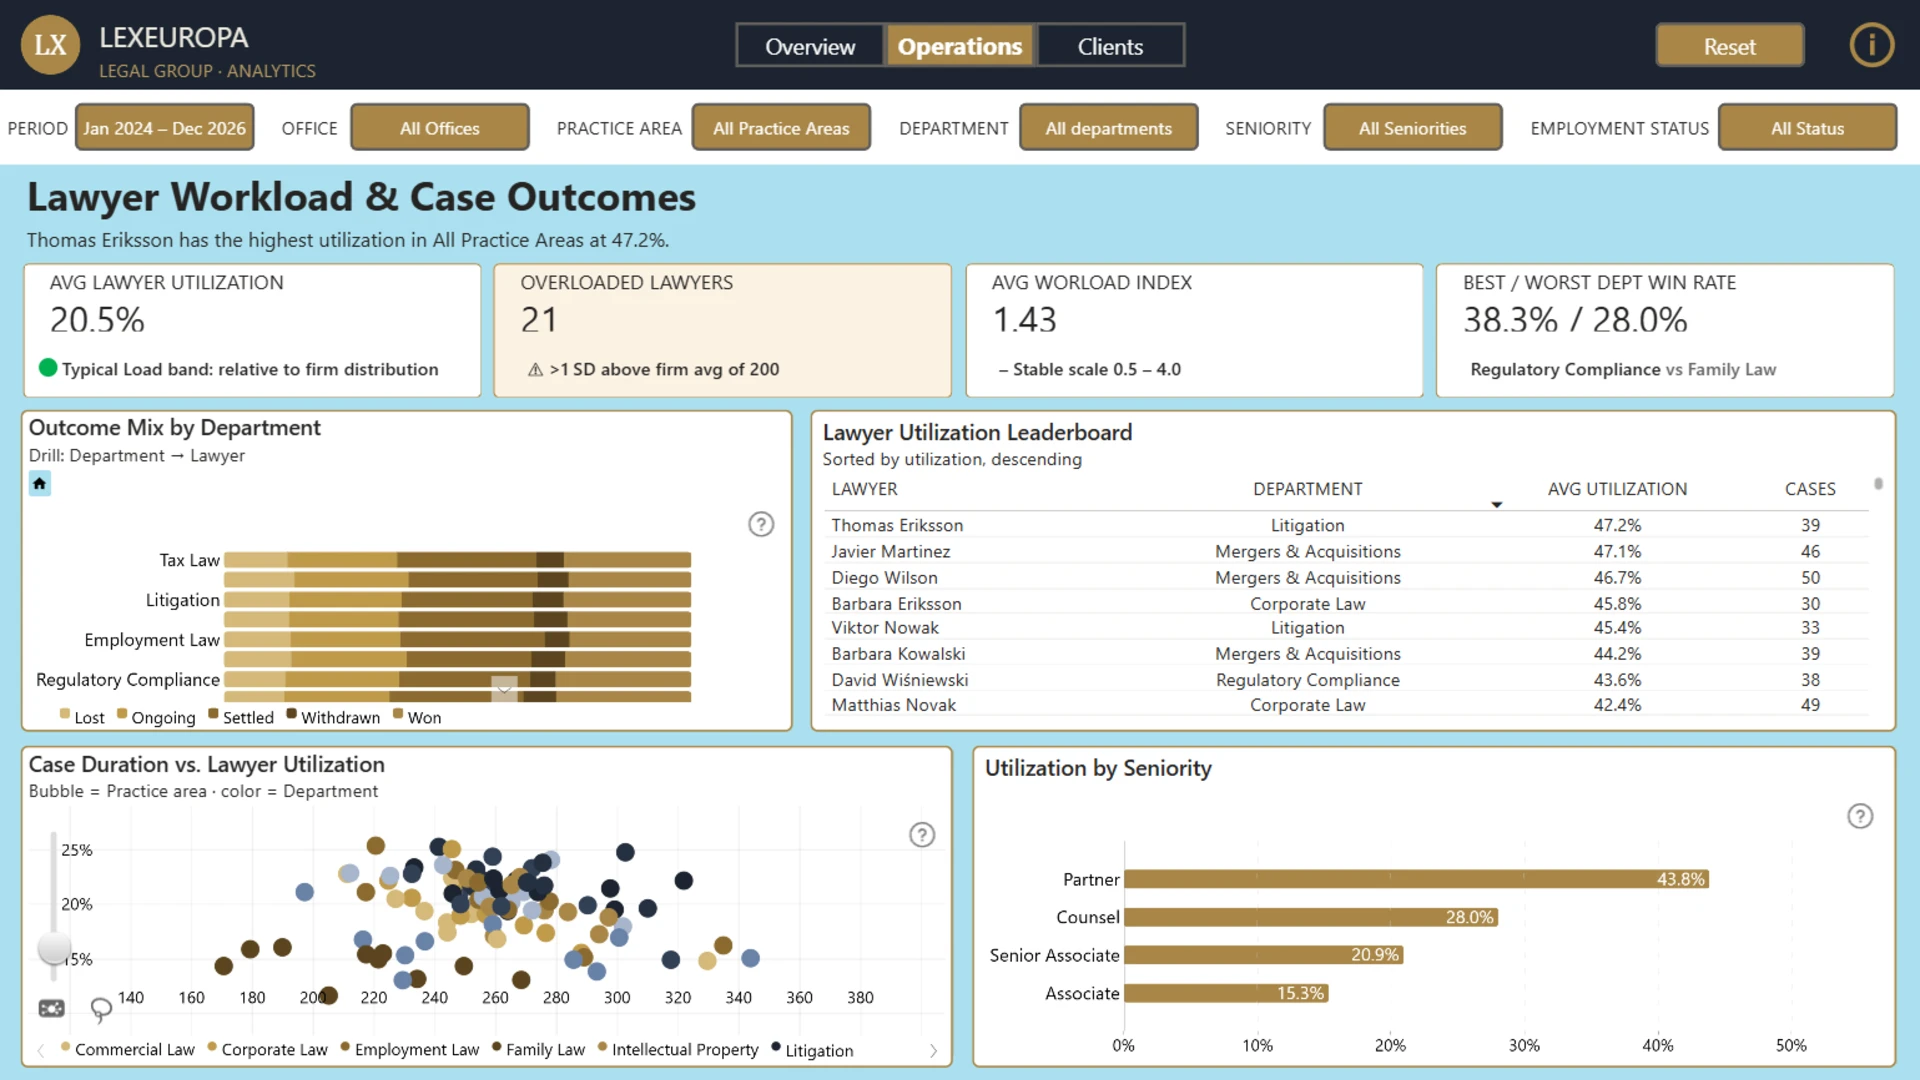
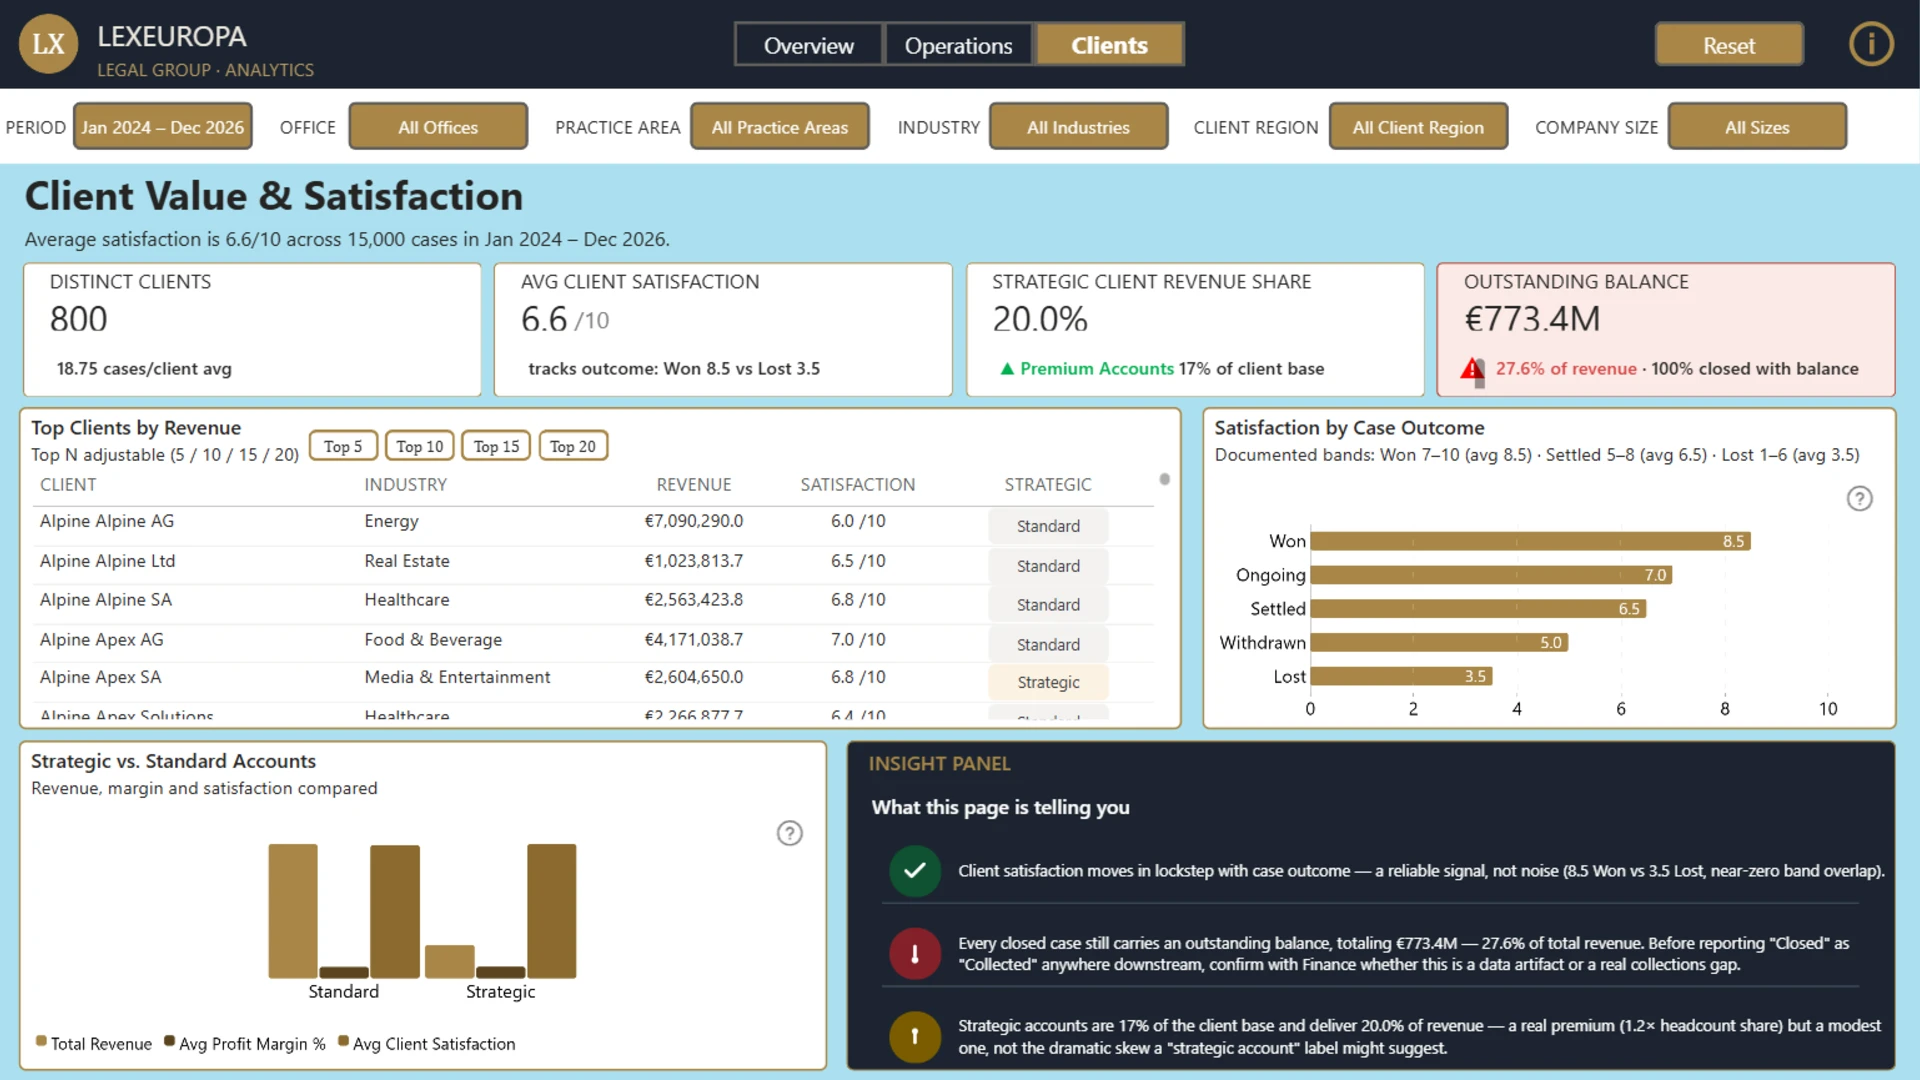
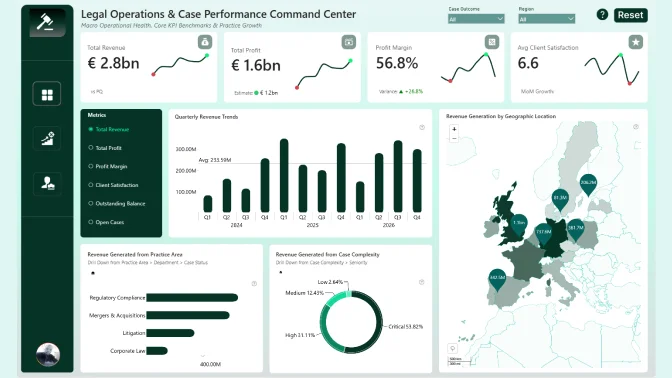
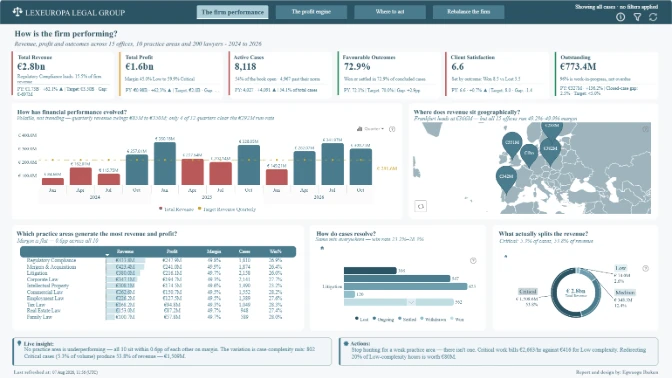
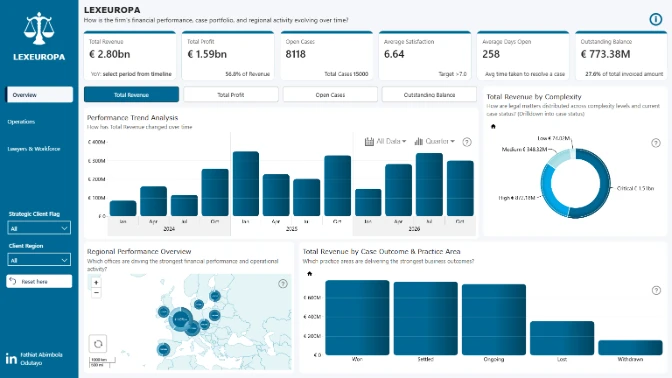
Compare practice area performance across revenue, profit, case outcomes, workload, risk, complexity, client value, and satisfaction in this legal dashboard.
Author’s Description:
Every number on the report is traced back to source and verified — the build process included a full data quality audit that caught a business-logic violation (100% of closed cases carry an outstanding balance against a "should be zero" spec, totaling €773M, 27.6% of revenue) and a workload metric that only weakly correlates with billable hours, both flagged directly on the report rather than smoothed over. 30+ DAX measures, 2 field parameters support the model.
ZoomCharts visuals used




4U Report Challenges
Participate in data challenges, build and submit reports to get free template downloads.
Join CommunityMobile view allows you to interact with the report. To Download the template please switch to desktop view.
How to use a PBIX template
Preview the interactive report, download the PBIX file, open it in Power BI Desktop, and replace the same data connection with your own dataset.
Preview and download
Explore the report online and download the PBIX template file.
Open in Power BI Desktop
Open the downloaded PBIX file in Power BI Desktop.
Connect your data
Replace the sample data source with your own dataset.
Refresh and adjust
Refresh the model and update fields or visual were needed.
Save and share
Save your report and publish it for your audience.


