451
Legal Case Duration Analysis Power BI Report
Legal Case Duration Analysis Power BI Report
More Report pages
Report Author: Jamiu Lawal
451
Share template with others
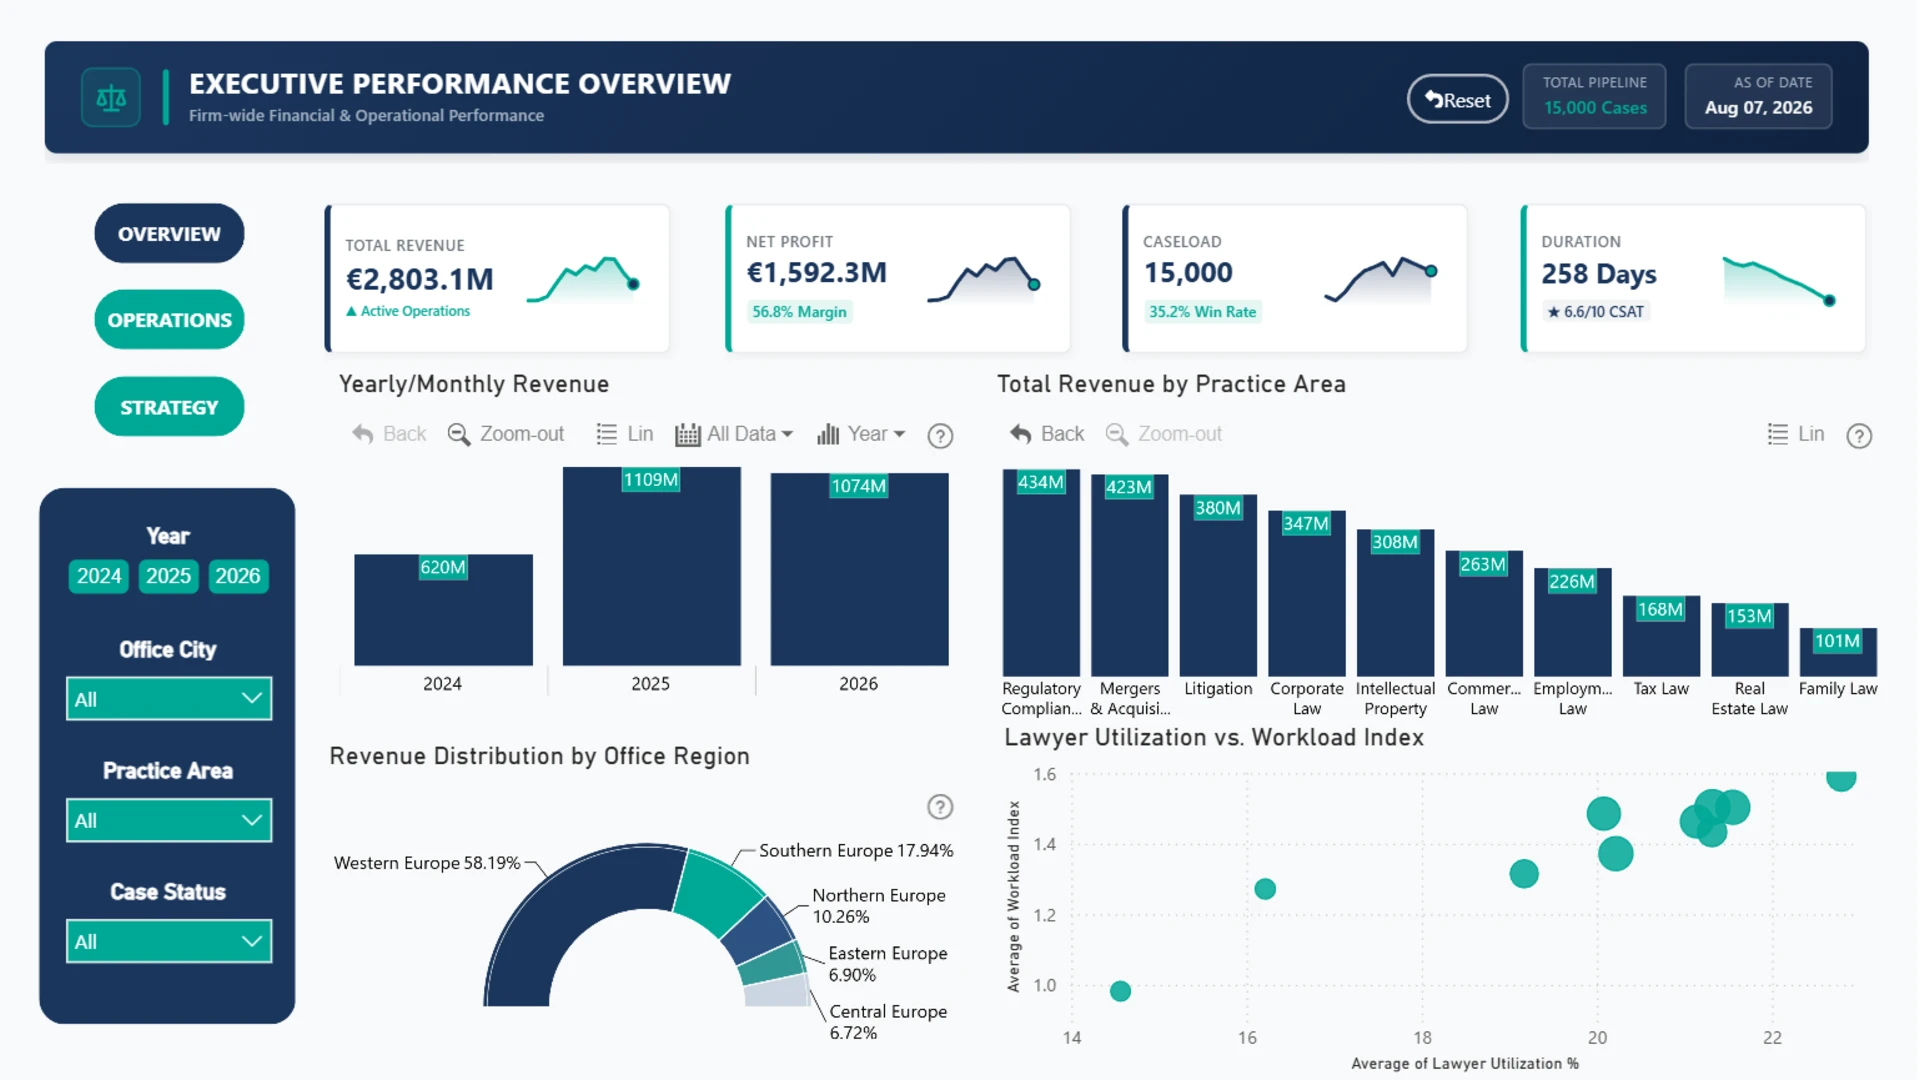
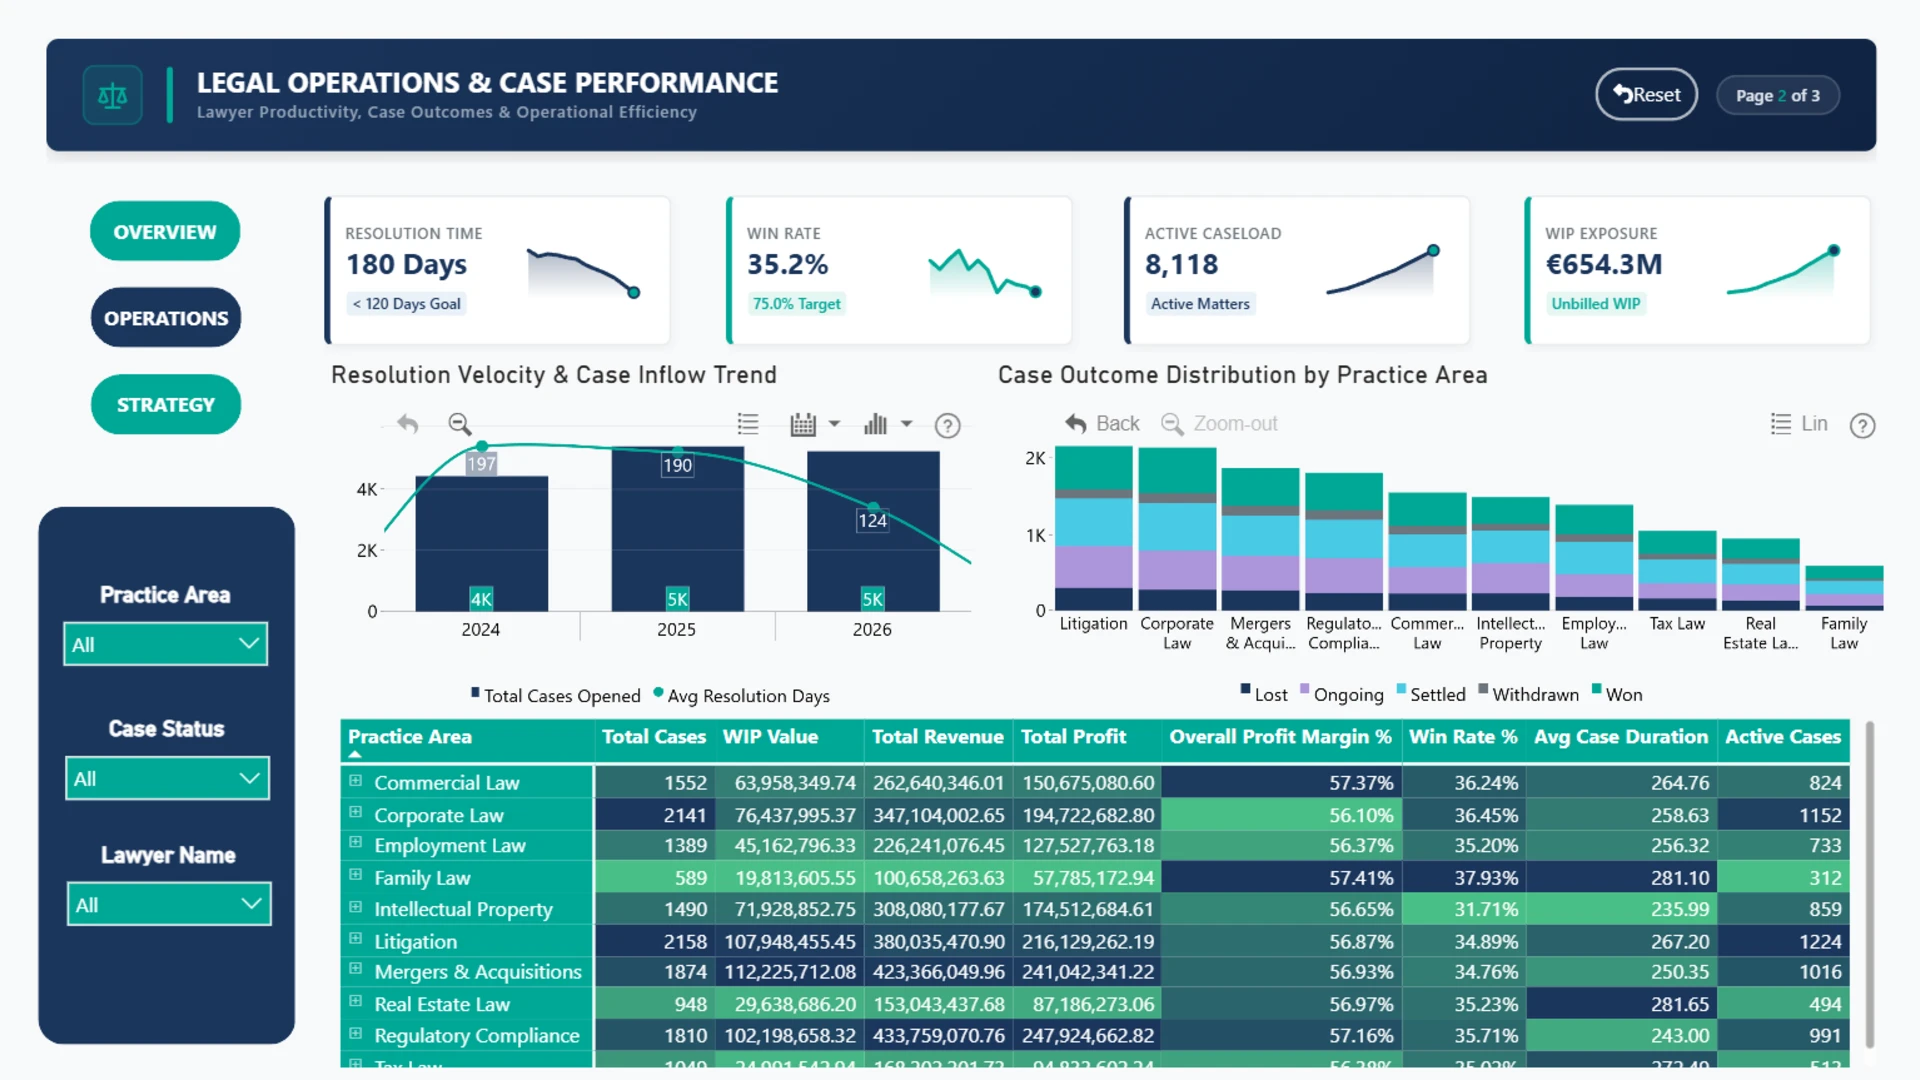
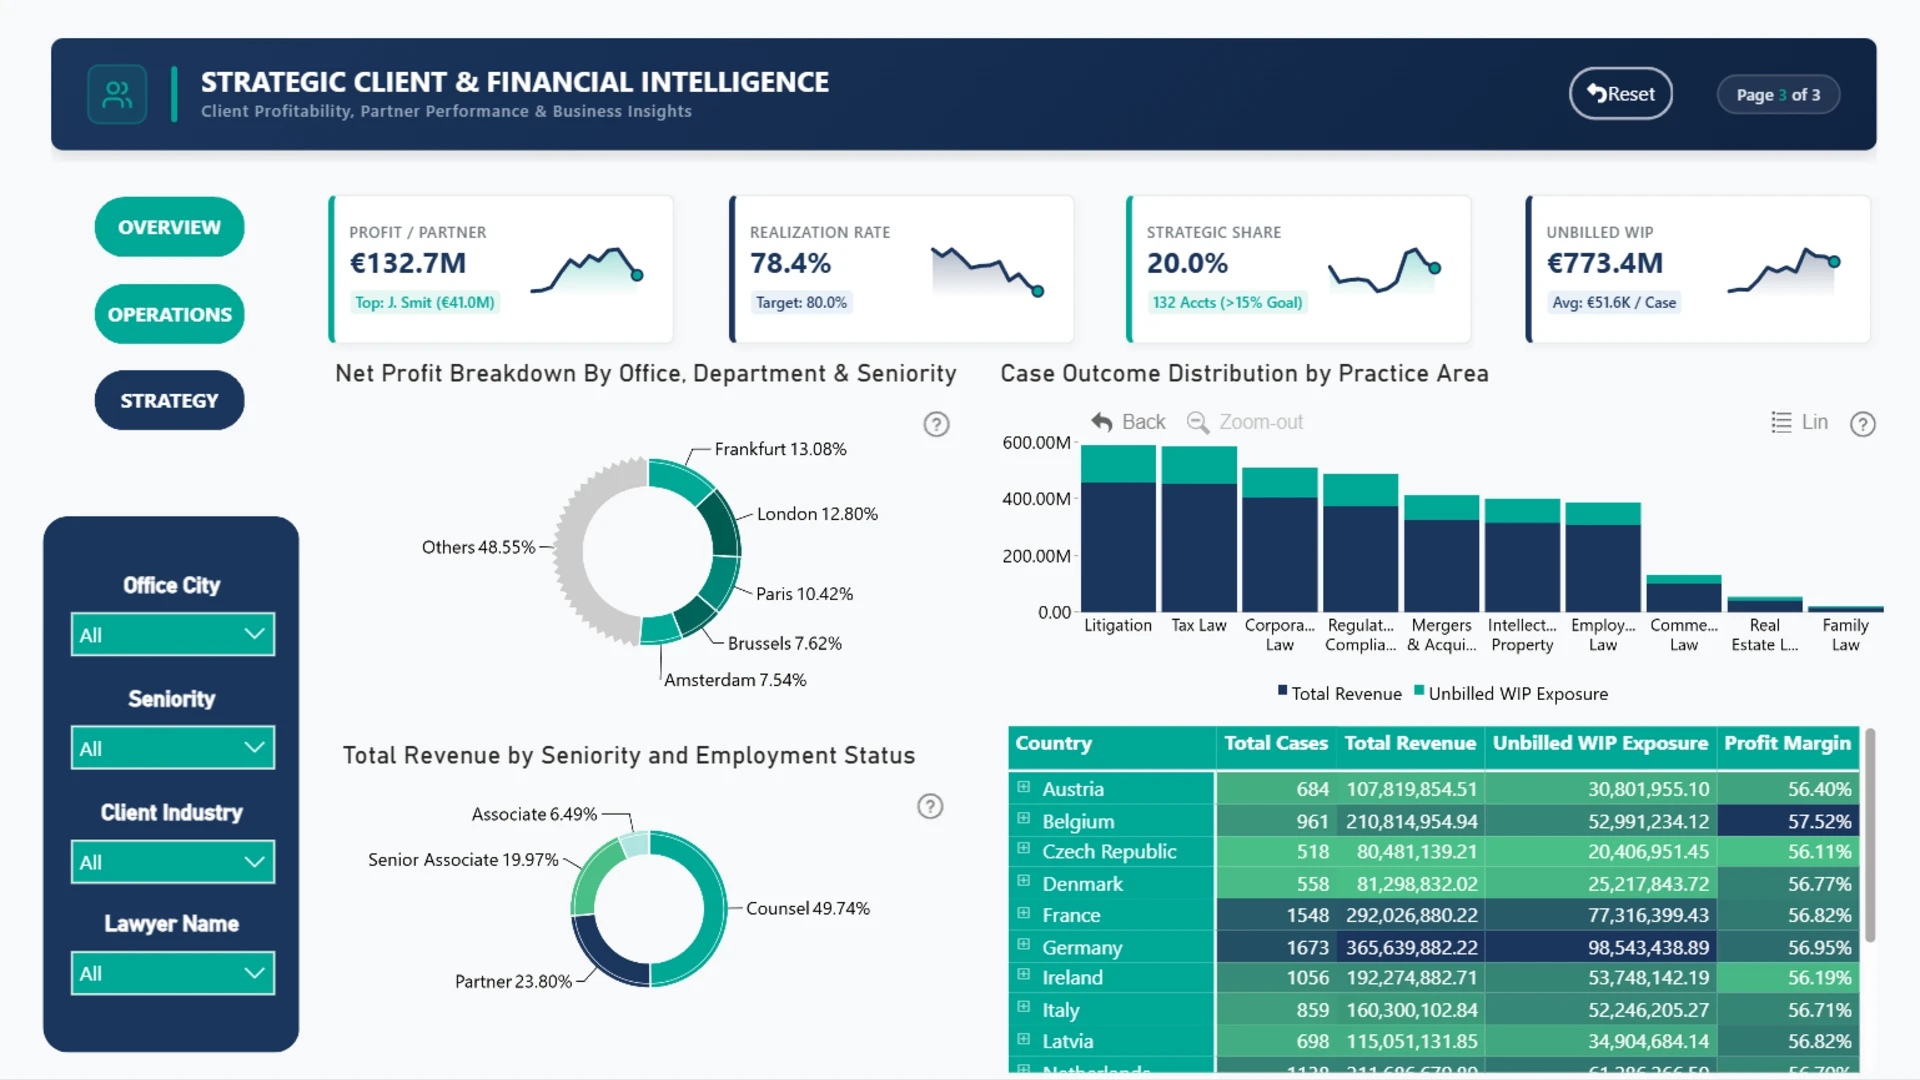
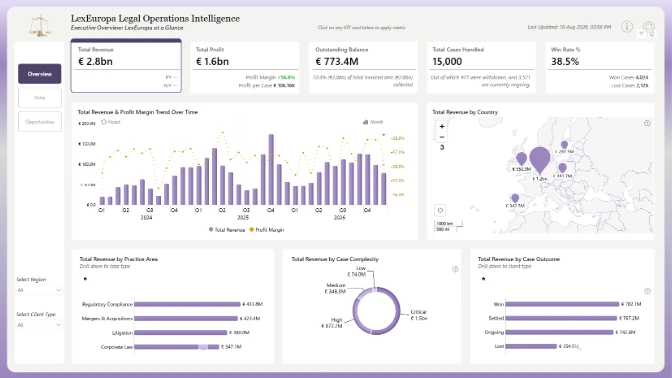
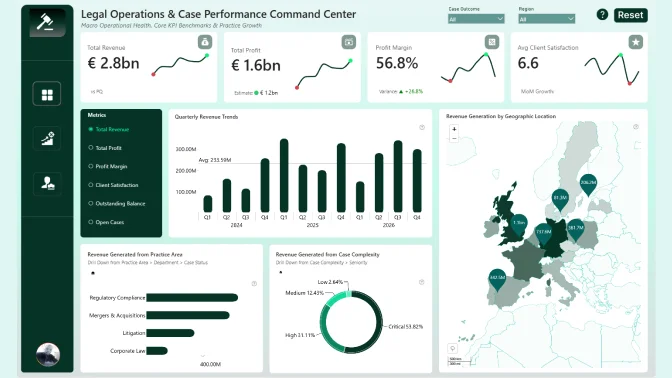
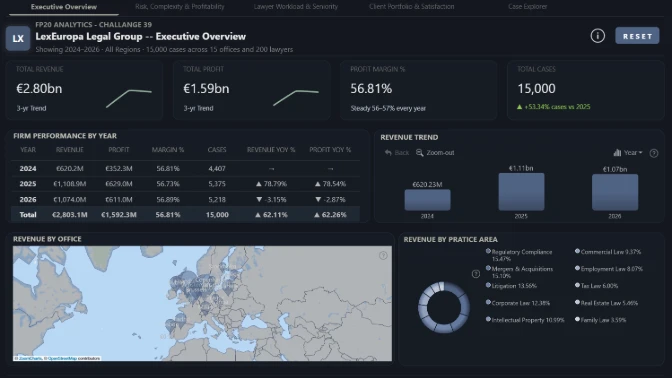
Analyze legal case duration in Power BI by complexity, risk, outcome, lawyer, client, practice area, office, revenue, and profitability.
Author’s Description:
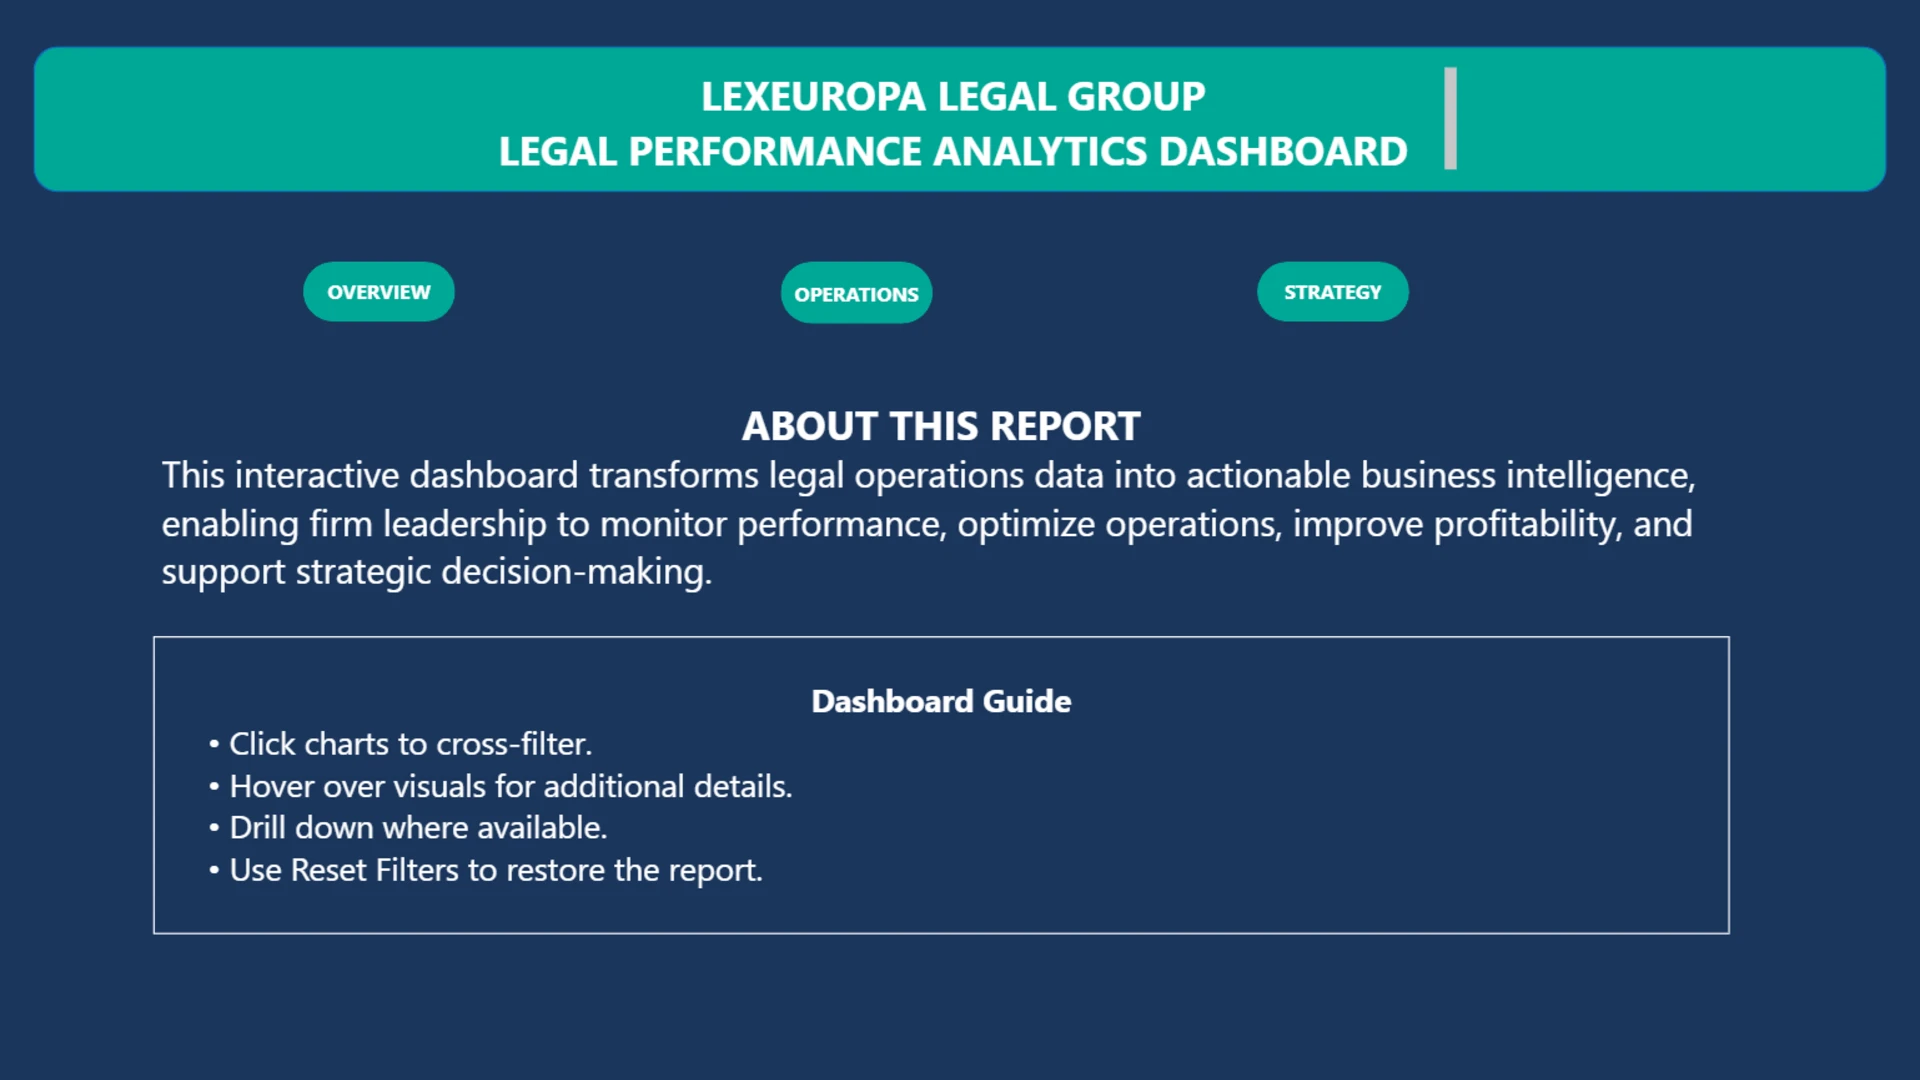
An interactive Power BI dashboard developed for the FP20 Analytics ZoomCharts Challenge 39 using the LexEuropa Legal Group dataset. The report provides executive-level insights into firm performance, legal operations, client profitability, lawyer productivity, case outcomes, workload distribution, financial performance, and strategic decision-making. It features ZoomCharts Drill Down visuals, interactive navigation, drill-down analysis, and KPI-driven storytelling to support data-informed business decisions.
ZoomCharts visuals used




4U Report Challenges
Participate in data challenges, build and submit reports to get free template downloads.
Join CommunityMobile view allows you to interact with the report. To Download the template please switch to desktop view.
How to use a PBIX template
Preview the interactive report, download the PBIX file, open it in Power BI Desktop, and replace the same data connection with your own dataset.
Preview and download
Explore the report online and download the PBIX template file.
Open in Power BI Desktop
Open the downloaded PBIX file in Power BI Desktop.
Connect your data
Replace the sample data source with your own dataset.
Refresh and adjust
Refresh the model and update fields or visual were needed.
Save and share
Save your report and publish it for your audience.


