About ZoomCharts Mini Challenge
ZoomCharts Mini Challenge is part of the global DataDNA – Dataset Challenge by Onyx Data, which unites 11K+ data enthusiasts worldwide, ranging from beginners to seasoned professionals, including Microsoft MVPs. Read more about the DataDNA challenge on the Onyx Data website. Join the community on LinkedIn
The ZoomCharts Mini Challenge provides a platform for a growing community to learn how to build PRO reports, aiding business users to explore data quickly and intuitively.
- Free License: All participants receive a free ZoomCharts Developer License that gives access to the full Drill Down PRO visuals library. License will remain active for 1 year after the challenge.
- Learn from Experienced Professionals: As part of the challenge, we host live workshops on report building and visualizing the challenge’s dataset in Power BI. Challenge participants can also book an individual consultation with an experienced Power BI mentor to ask questions and get personalized tips.
- Tailored Feedback: Every challenge submission will receive personalized feedback, giving participants the chance to hone their skills and improve their reports.
Prizes
The best report’s creator will receive a $300 Amazon gift card from ZoomCharts. The Top 5 submissions and the winner will be announced on January 30th.
Webinar recordings
How to participate?
1. Register for the challenge:
- Download the DataDNA Challenge dataset either on this Challenge page or from Onyx Data website.
- Register for DataDNA ZoomCharts Mini Challenge.
- Activate your free Drill Down Visuals Developer License for Power BI. Read license setup instructions.
2. Build your report in Power BI:
- Set up an account in Power BI using the assigned license details (if you have participated in ZoomCharts Challenges in the past, you can use the same account you set up before).
- Use the account to access the full library of custom ZoomCharts Drill Down visuals.
- Use the dataset to build a Power BI report including at least 2 ZoomCharts Drill Down Visuals in one report page.
3. Improve your report and learn new skills:
- To learn more about applying ZoomCharts visuals in your reports, participate in the challenge workshop.
- If you have any questions or need advice, you can book a free individual consultation.
- Check out the submissions from past challenges for inspiration.
4. Submit your challenge entry:
- Submit your report in .pbix format for validation.
- If your submission doesn’t match the challenge criteria, you will be notified by email indicating the reason. Don't worry if this happens! You can fix the issue and resubmit your report.
- Together with validation confirmation you will receive a publish to web link that you can use to add the report to your portfolio or publicly share online.
- All validated entries will receive personalized feedback from the evaluation team. You can use this feedback to revise your report and resubmit it before the deadline. Feel free to resubmit your entry as many times as necessary before the deadline.
5. Finalize your participation to compete for the prize:
- Post the final version of your submission as a single image on your LinkedIn profile, including the tags @ZoomCharts and @OnyxData, as well as the hashtags #dataDNA and #builtwithzoomcharts.
- After posting the report on LinkedIn, please complete this form.
- Follow ZoomCharts on LinkedIn
- Follow Onyx Data on LinkedIn
- All participants of ZoomCharts Mini Challenge who have filled in the form are also valid to compete in the main Onyx Data DataDNA challenge for a chance to win additional prizes. Read more here.
6. Attend challenge closing webinar to hear the results:
- The submissions are evaluated by ZoomCharts team (see "Judging criteria" for more info). The submissions of Top 5 ZoomCharts Mini Challenge finalists are analyzed live during the challenge closing webinar to share the best practices and learning opportunities with the community.
- The author of the best report is rewarded with a $300 Amazon gift card from ZoomCharts.
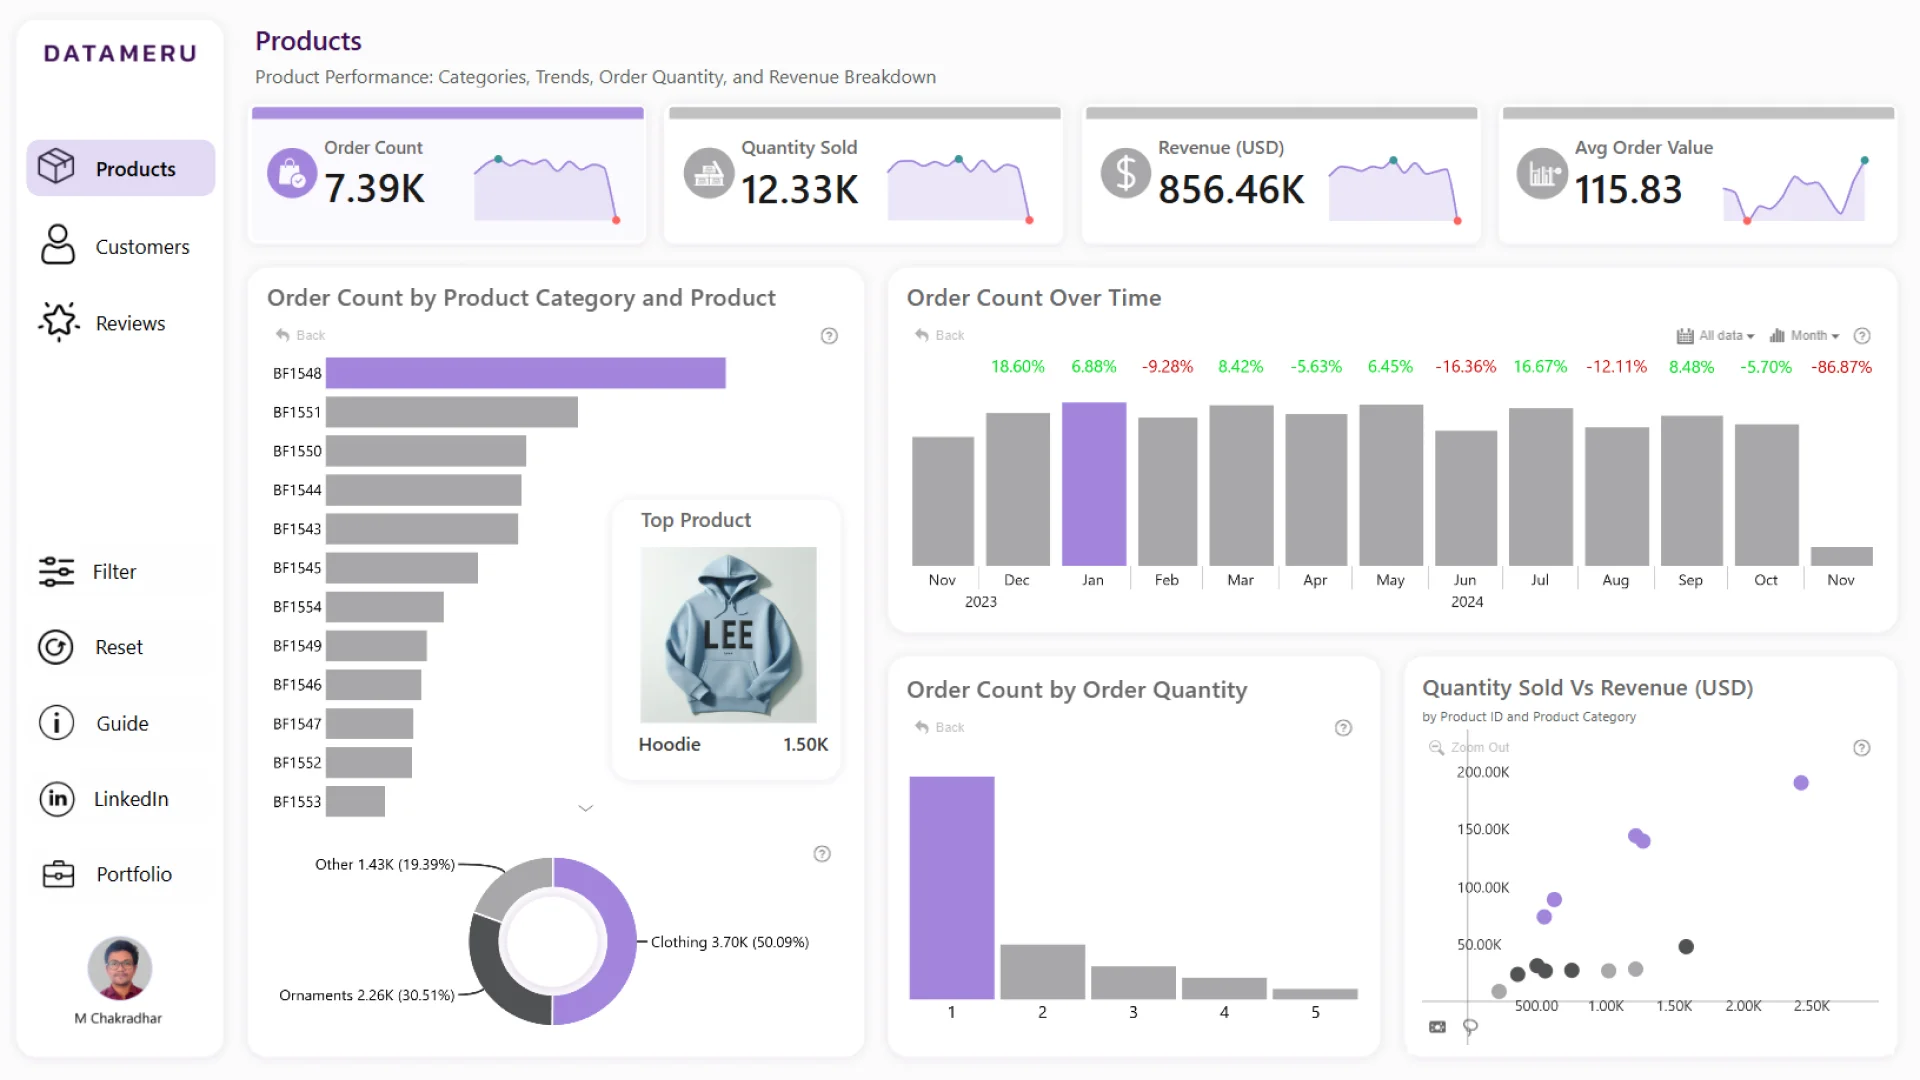
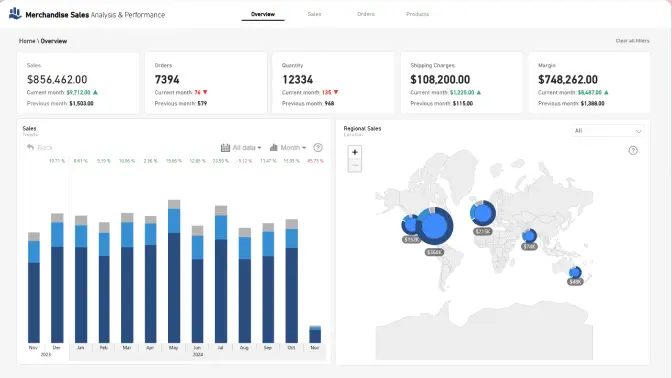
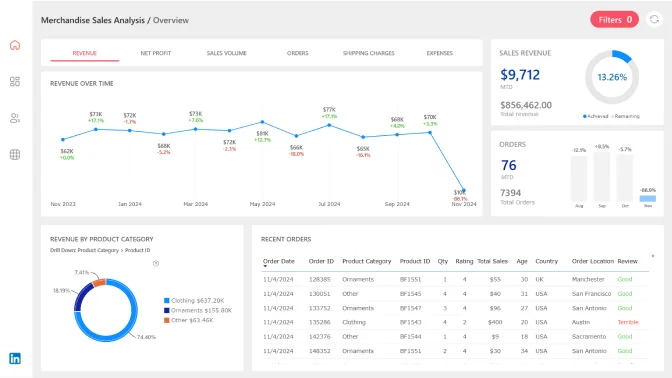
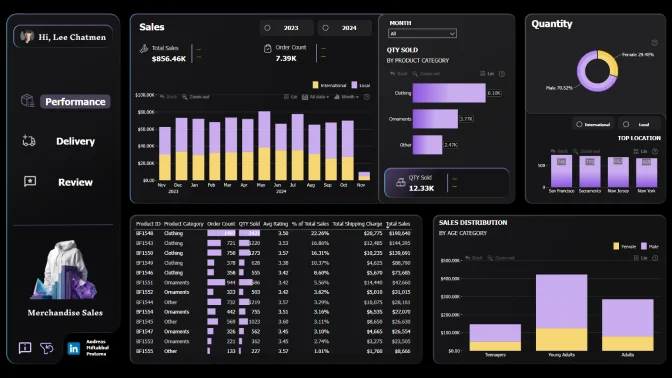
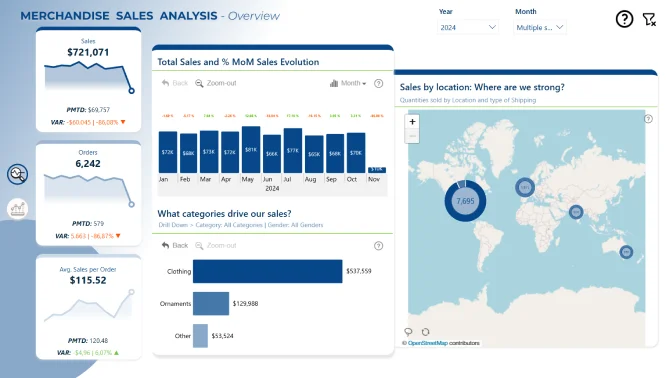
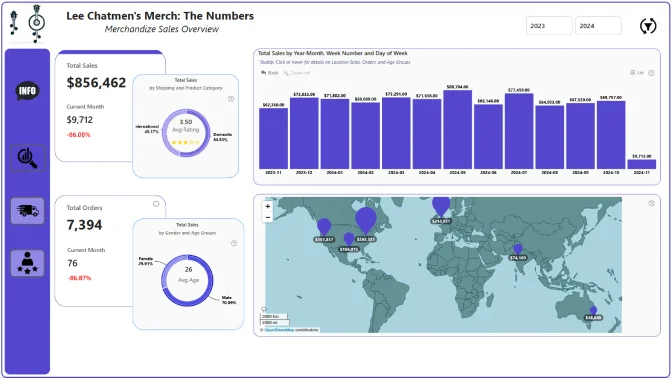
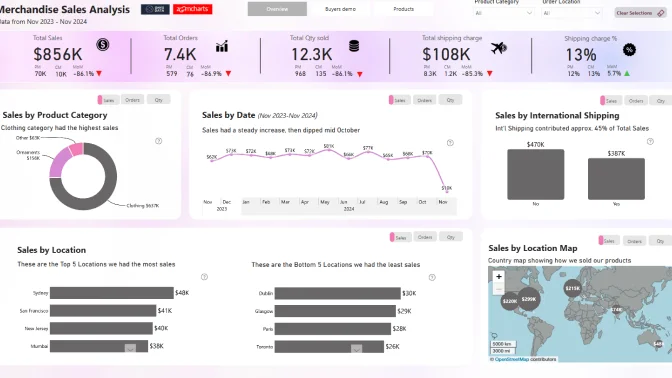
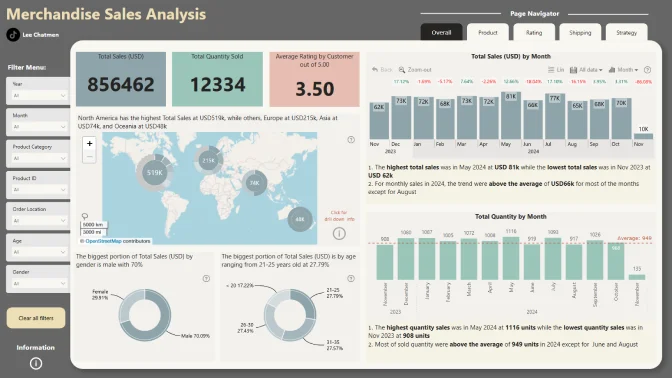
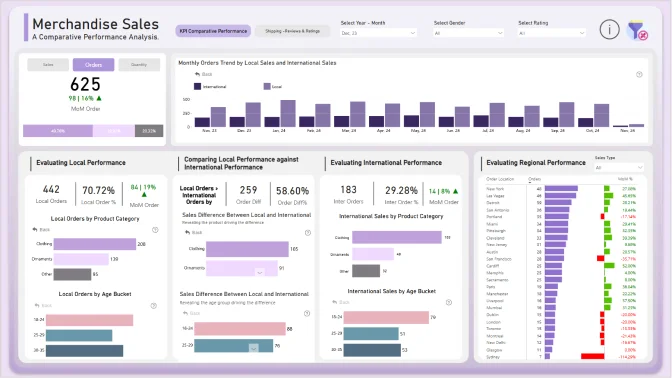
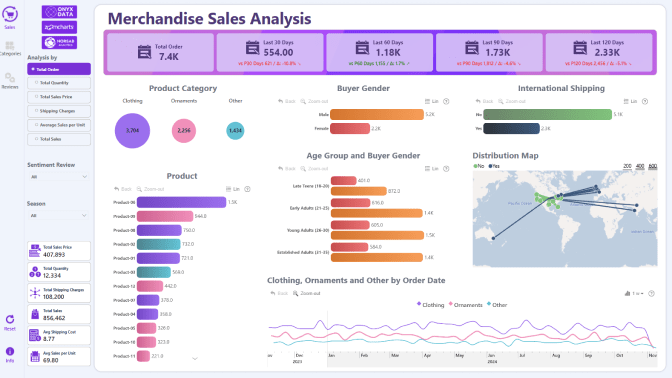
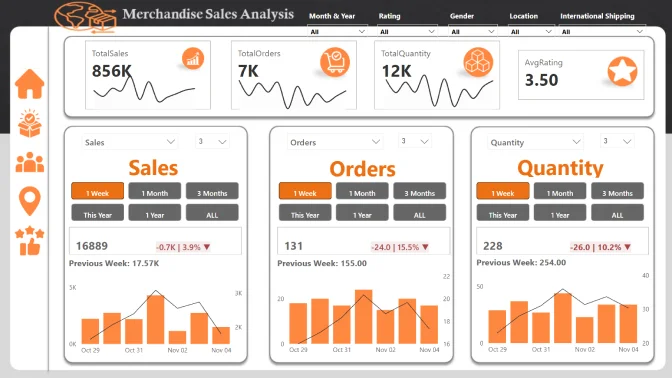
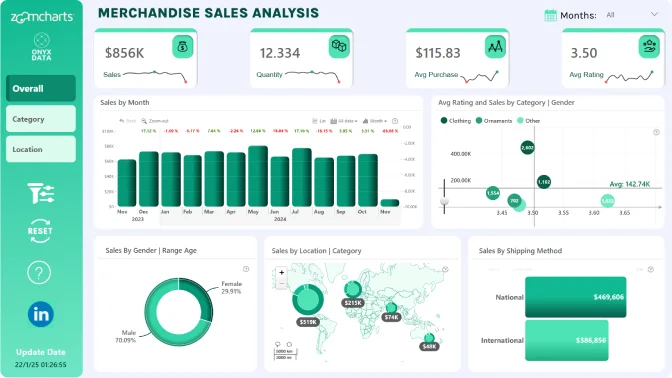
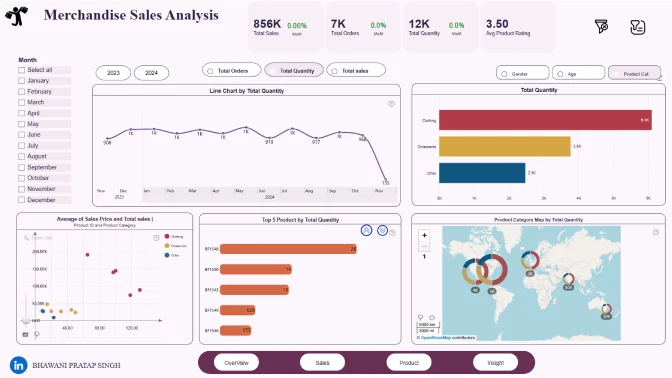
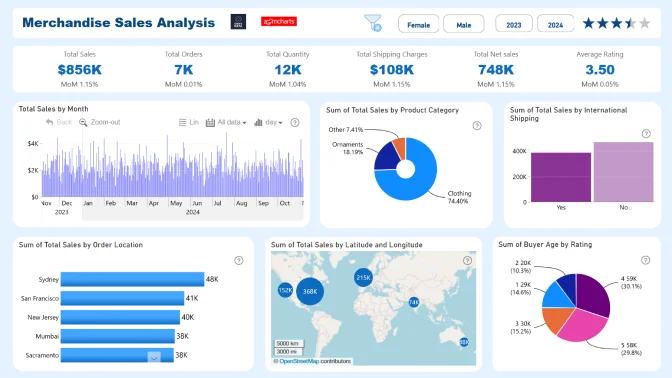
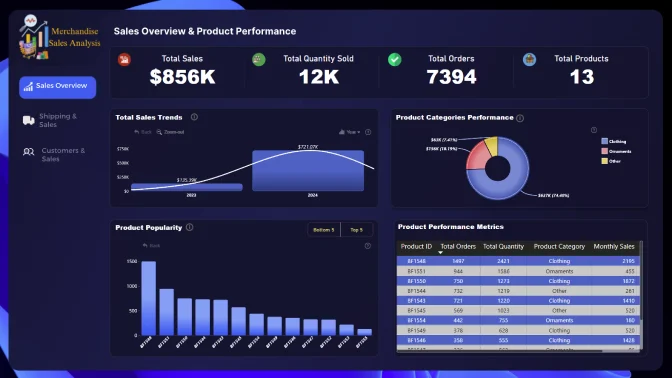
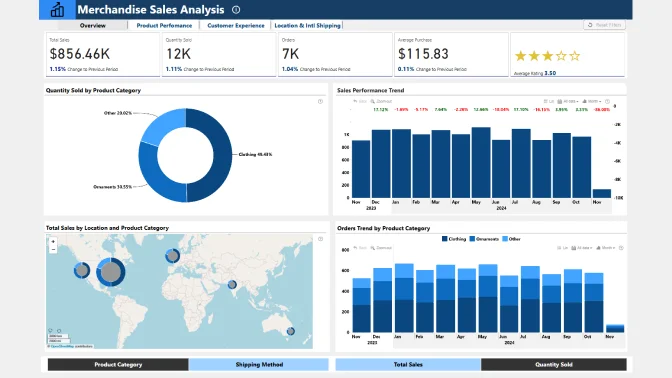
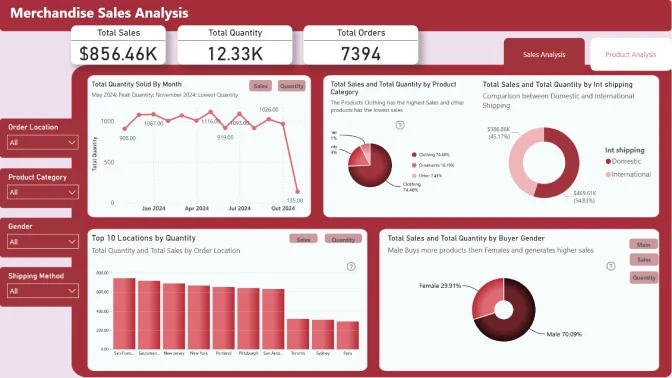
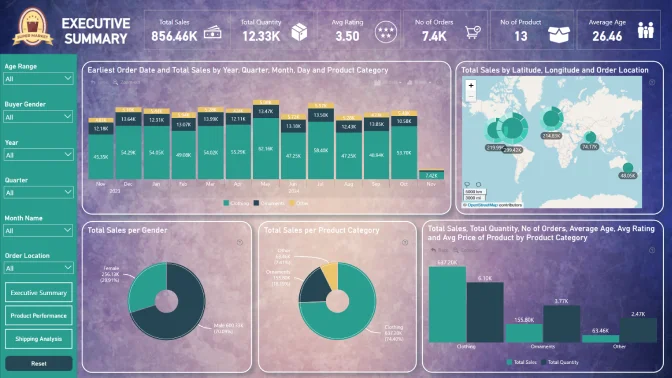
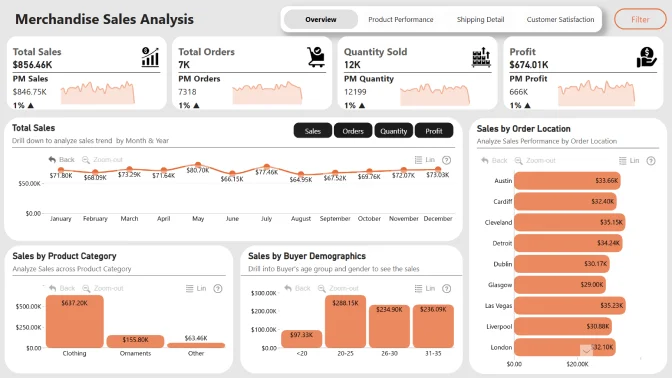
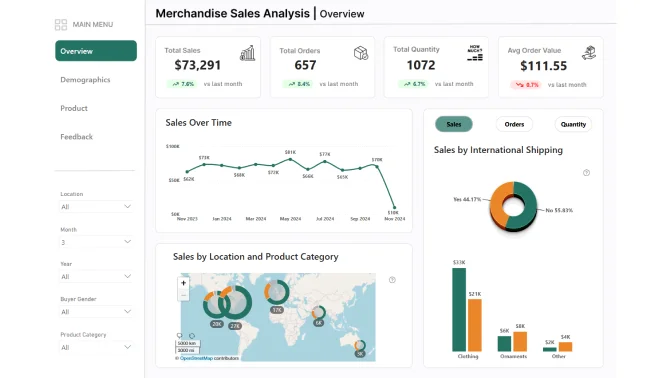
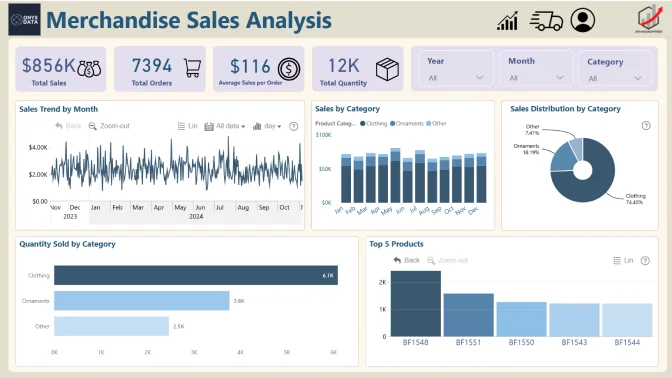
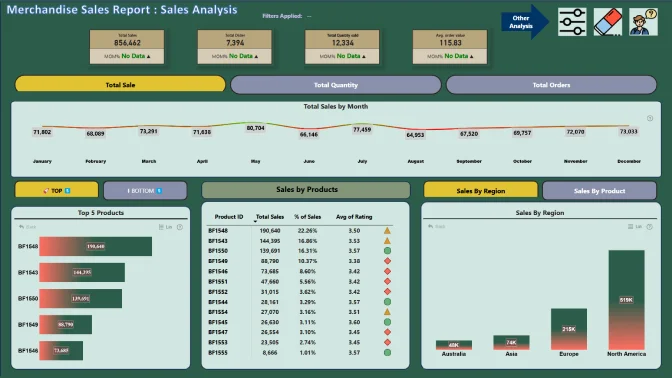
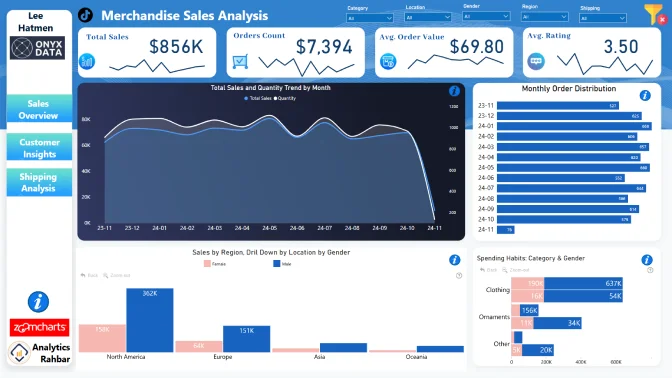
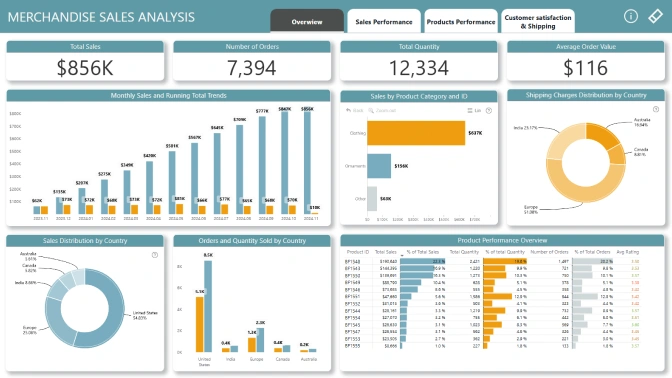
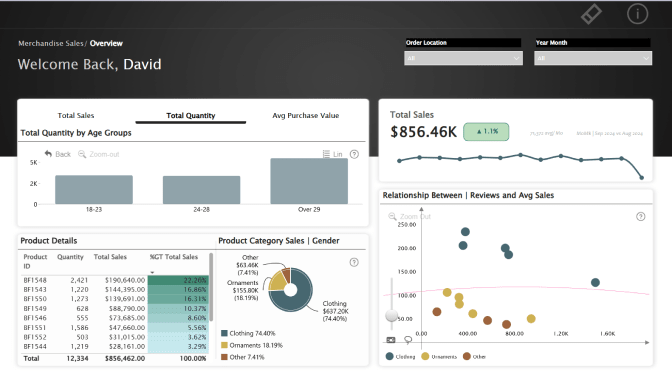
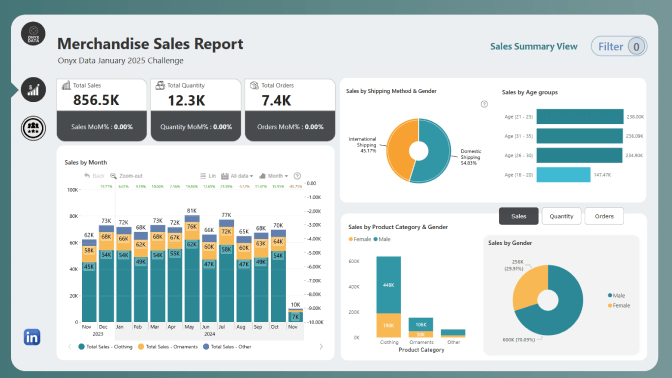
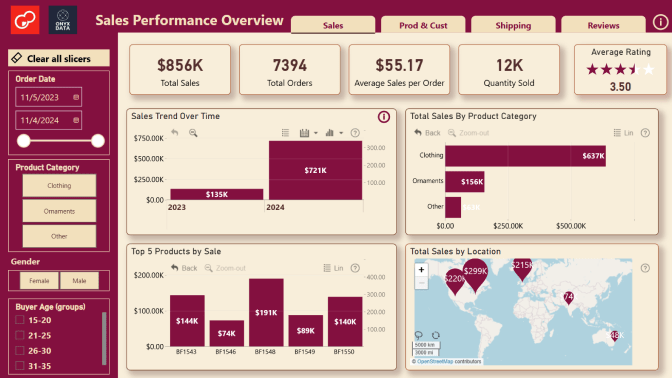
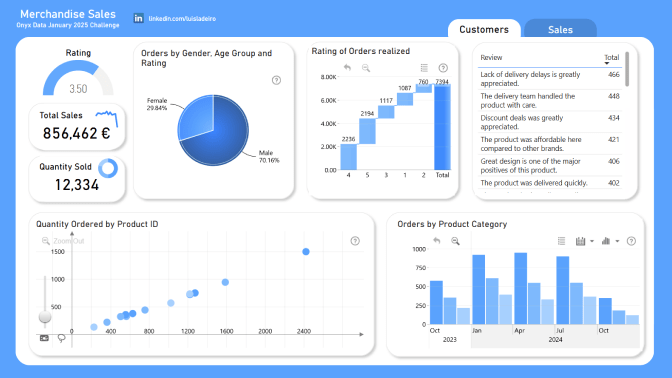
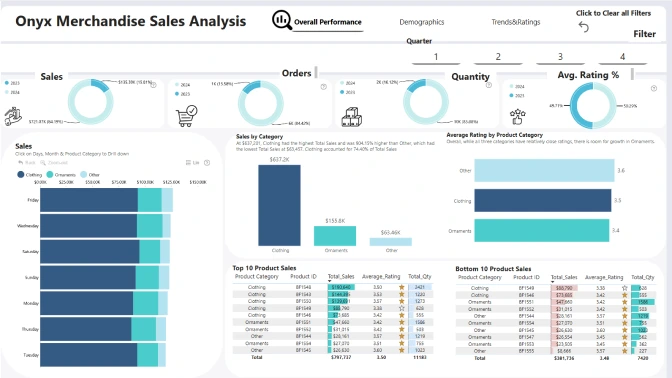
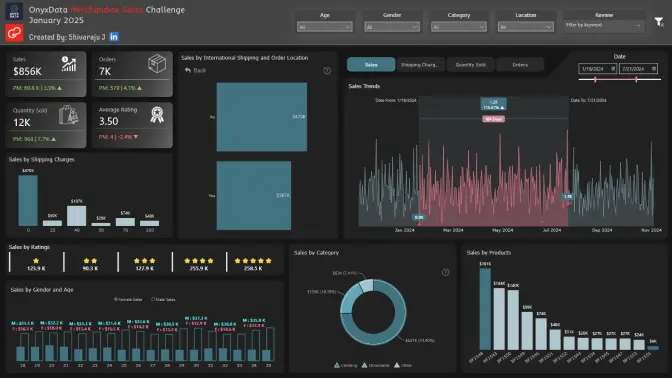
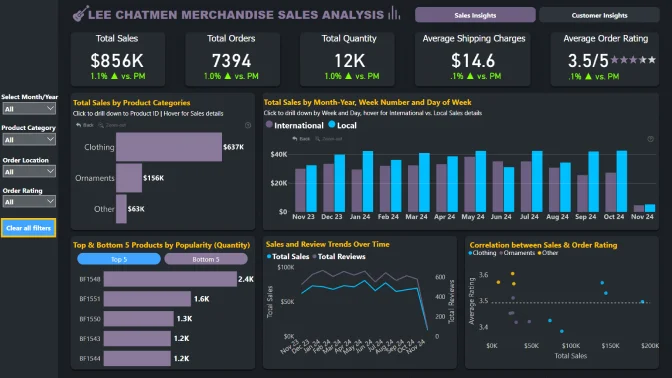
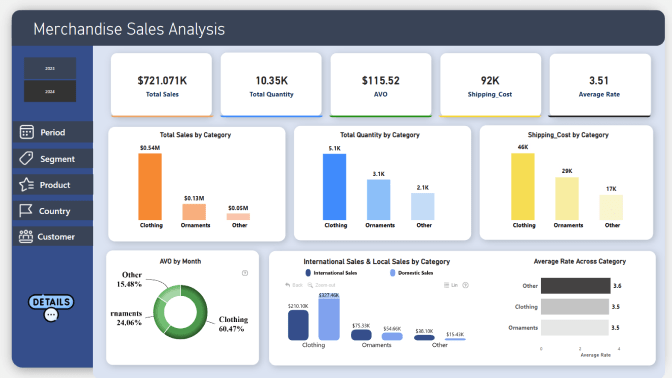
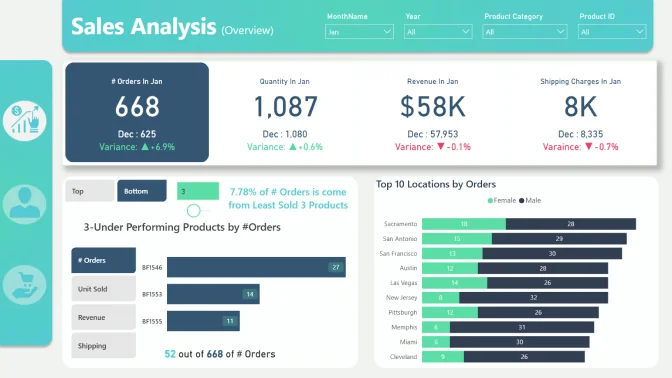
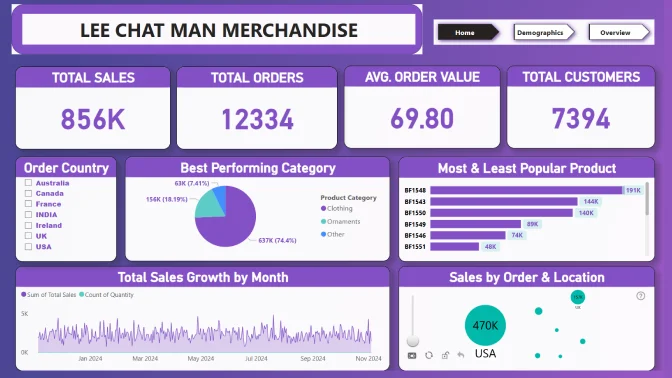
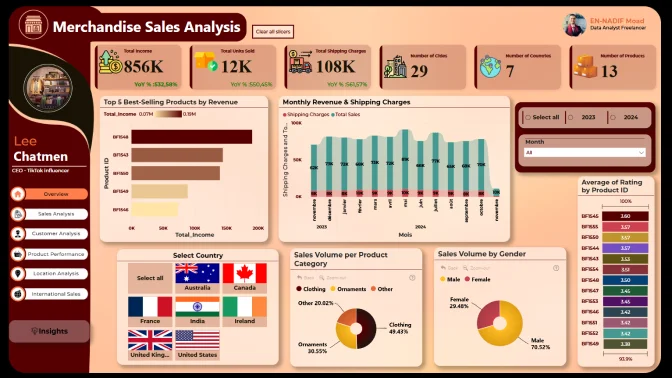
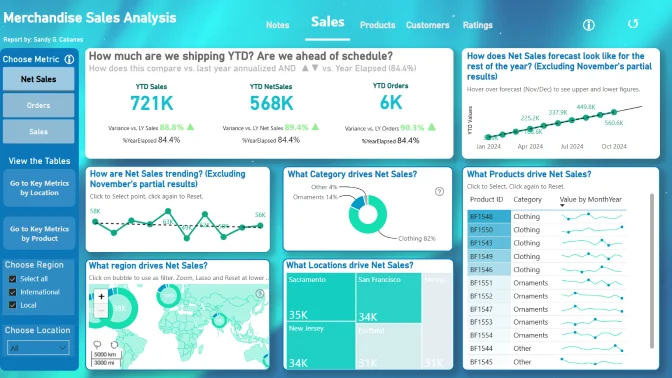
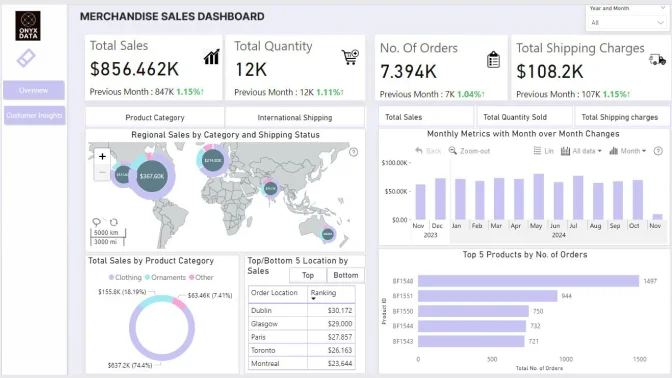
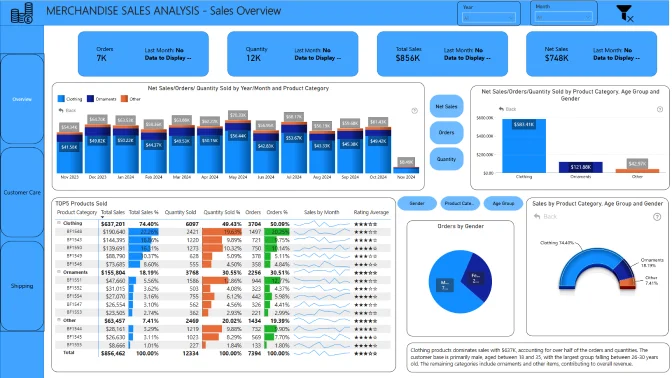
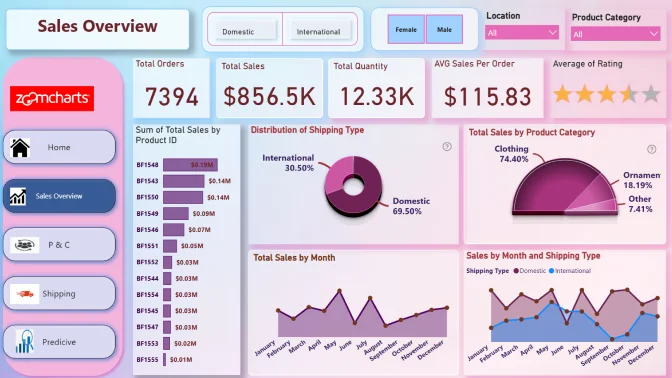
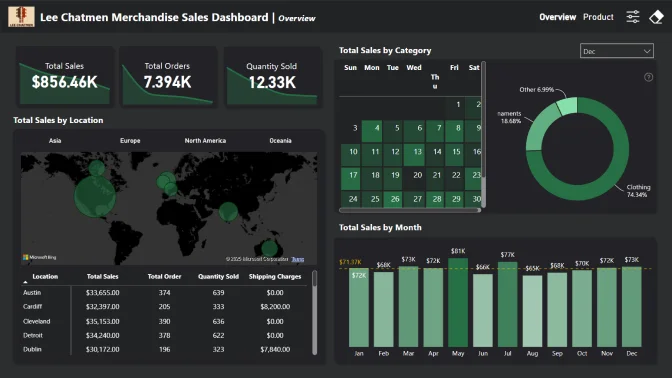
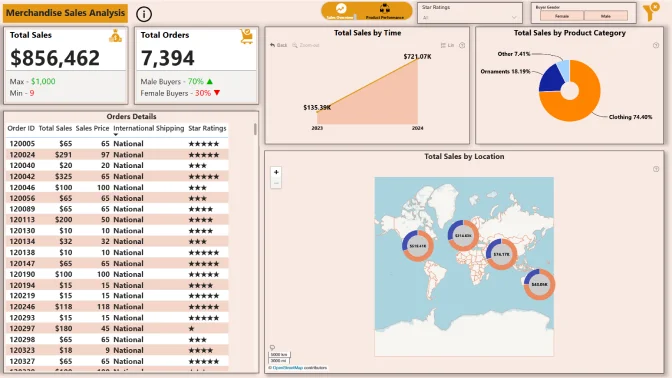
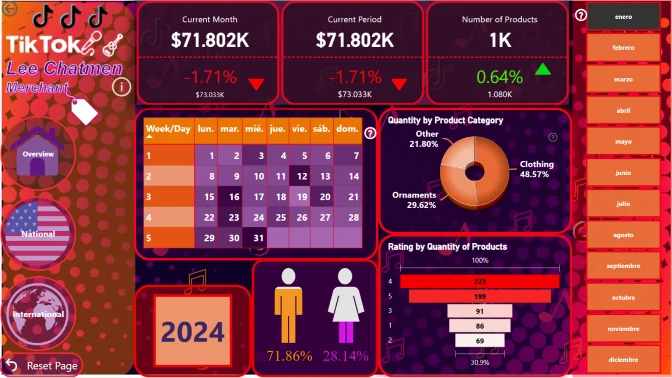
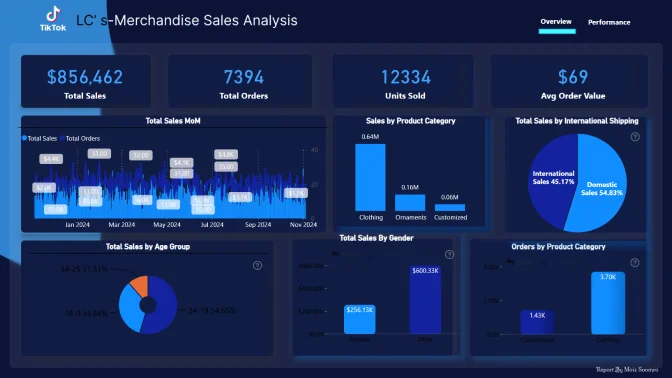
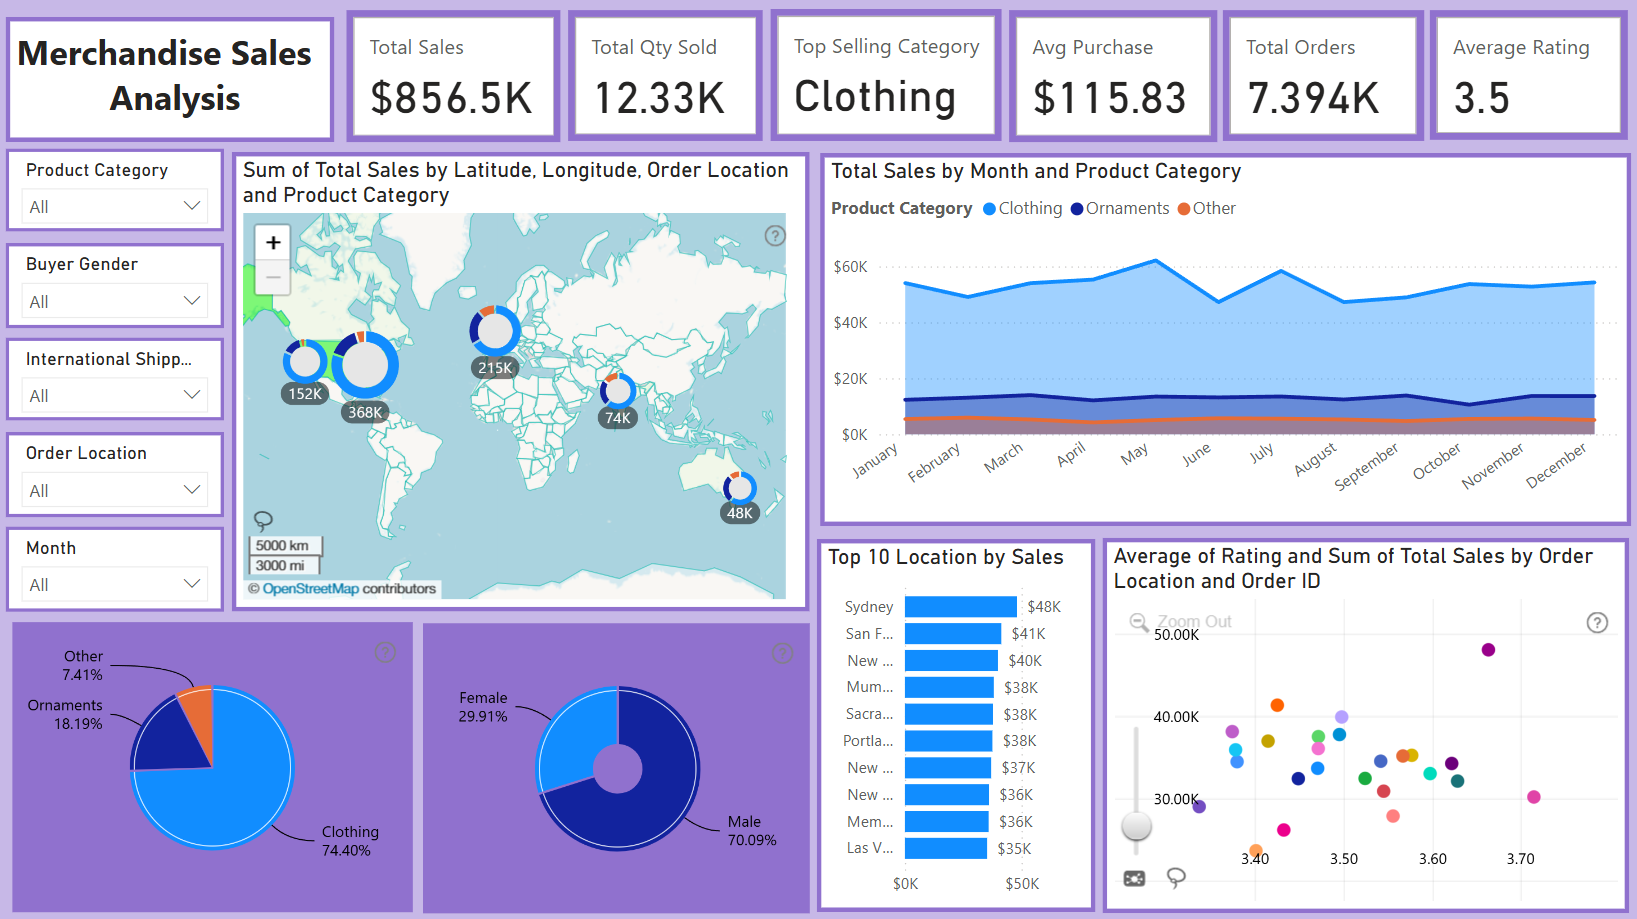
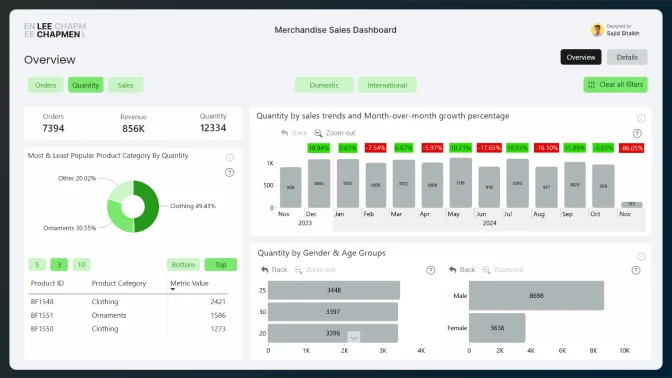
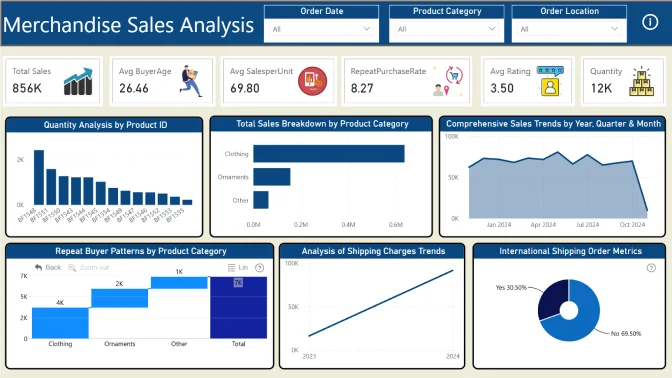
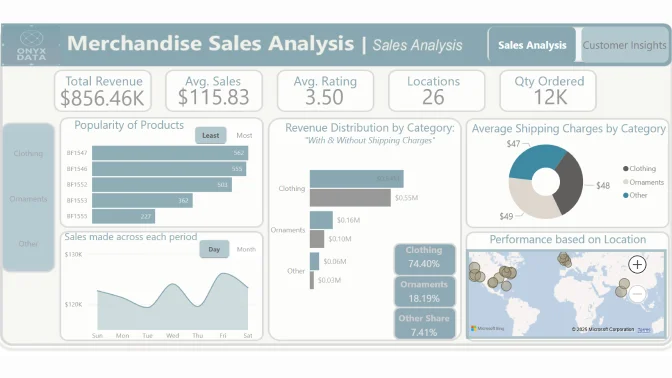
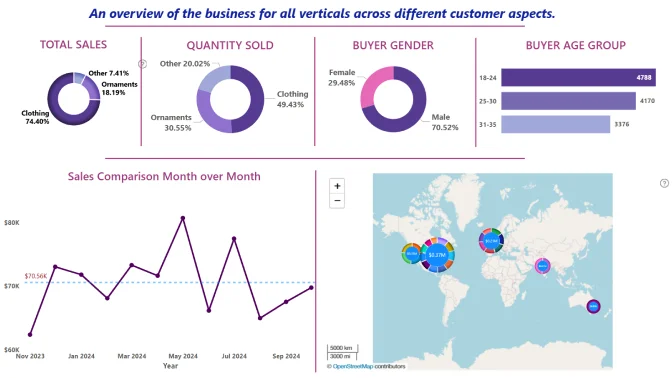
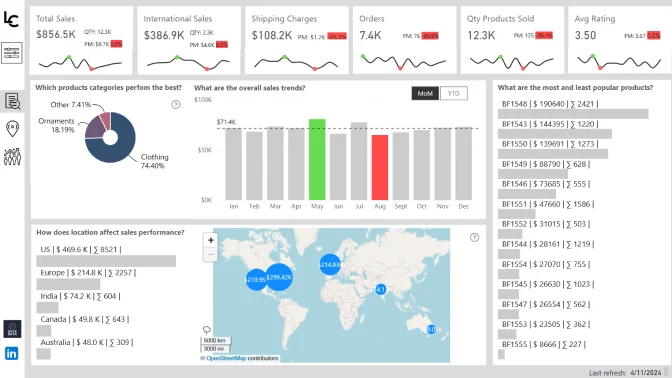
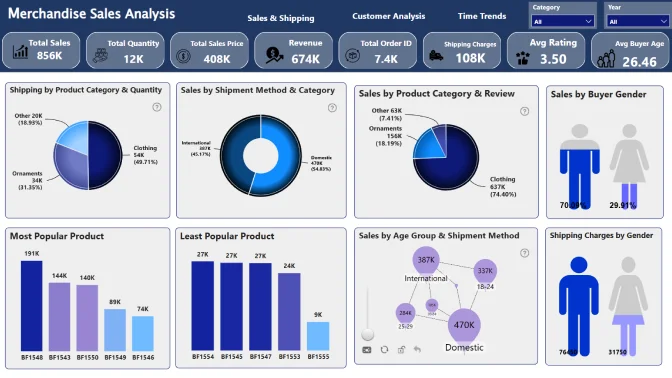
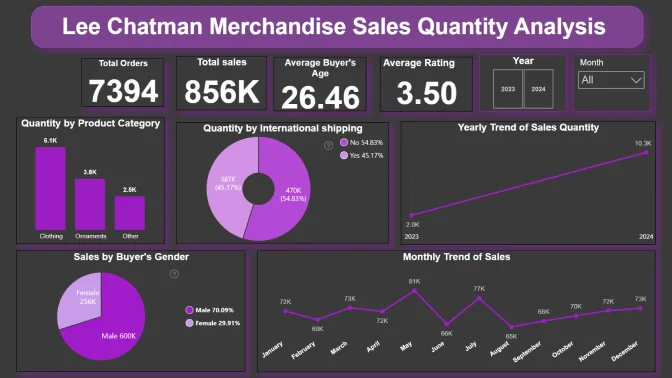
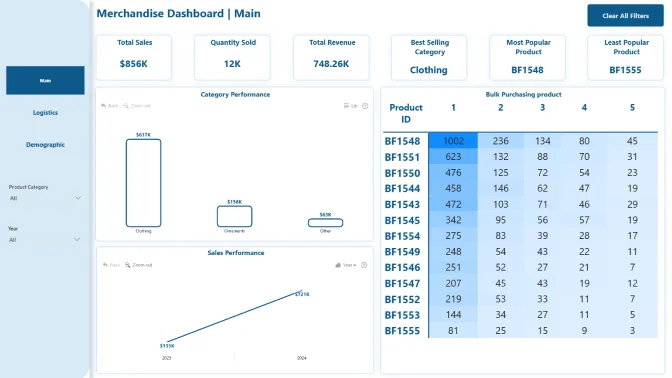
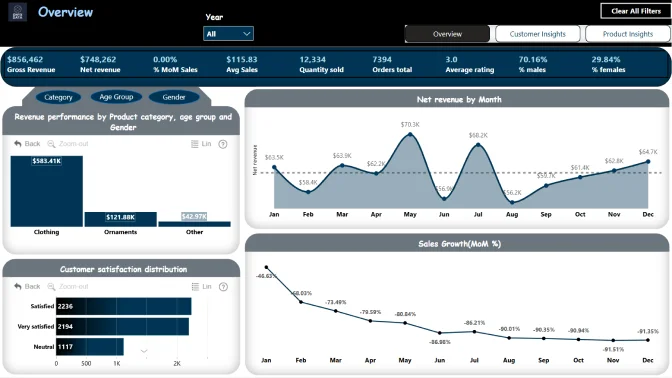
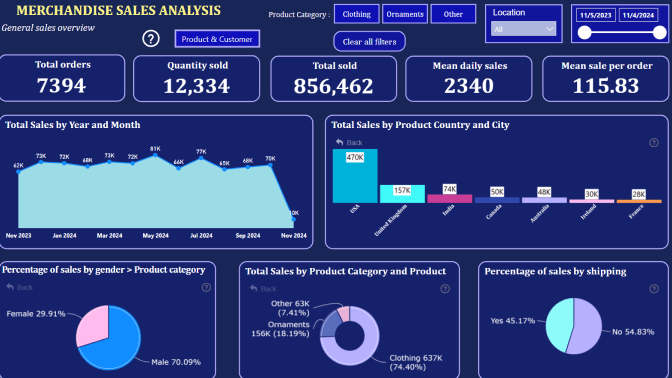
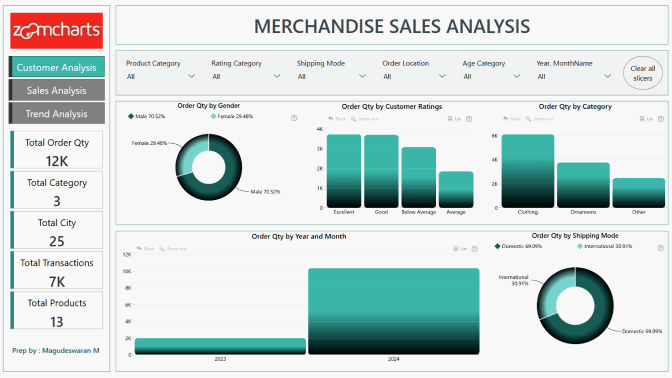
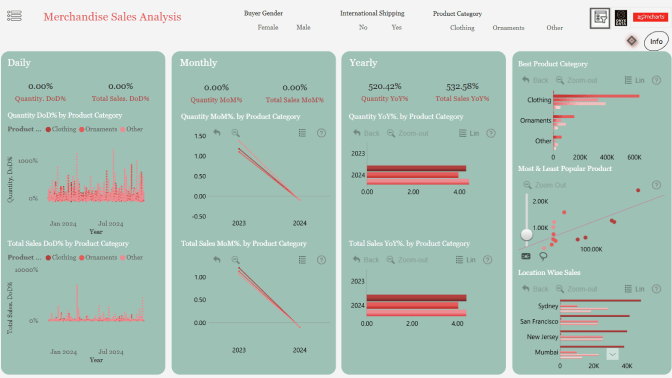
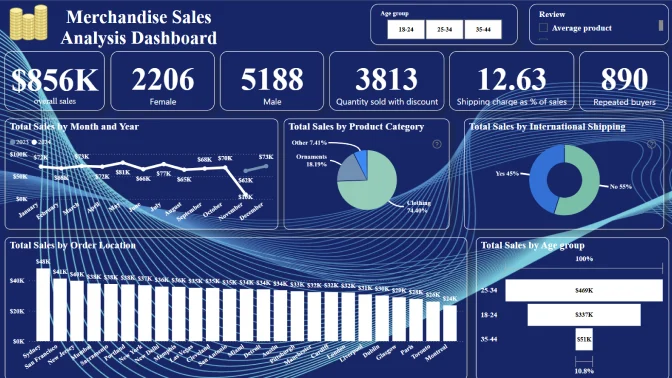
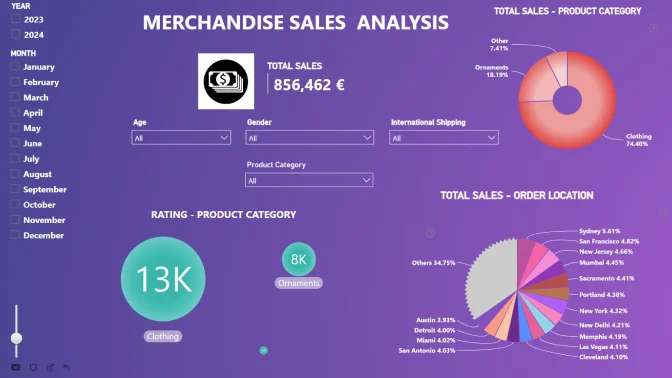
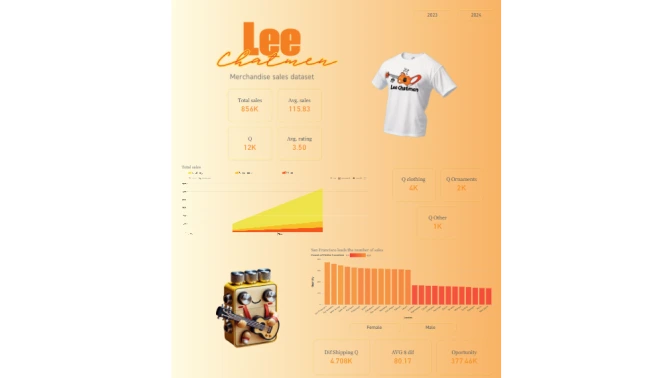
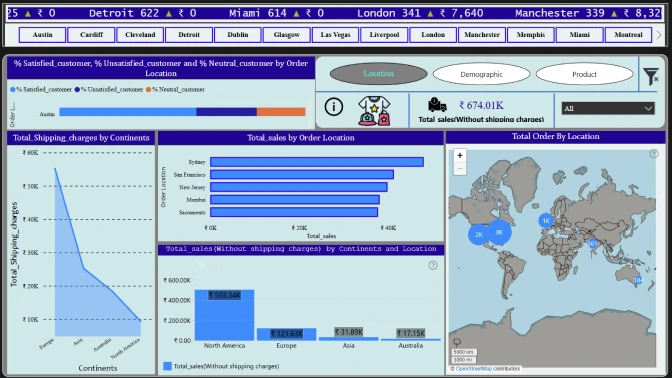
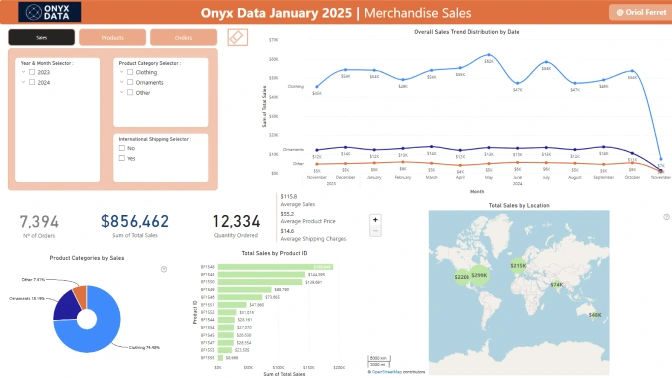
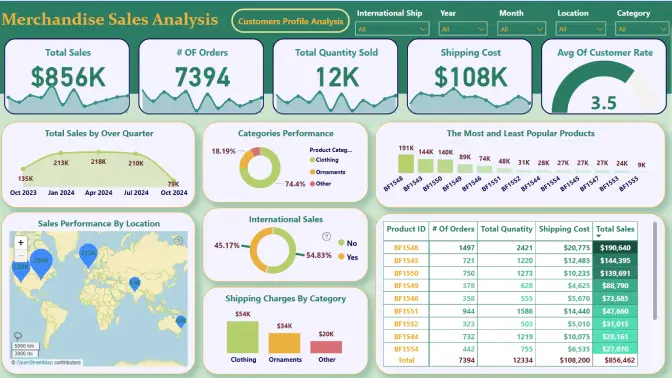
Merchandise Sales Analysis
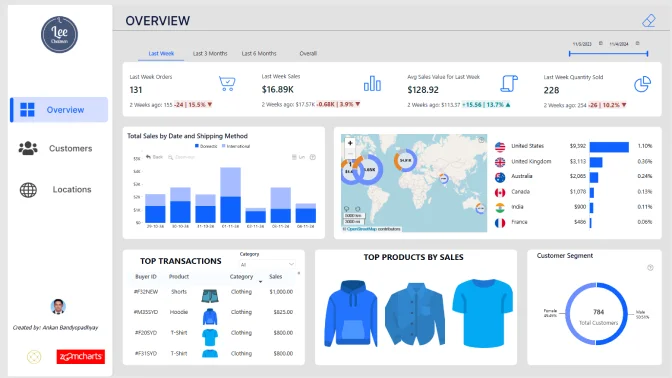
Lee Chatmen is a popular influencer from the United States with over 7 million TikTok followers. He became famous for his entertaining videos, where he plays popular songs on miniature guitars. In 2023, Lee launched his own line of merchandise. This analysis looks at how his merchandise sales are going and what we can learn from the data.
Here are some key questions to guide the analysis:
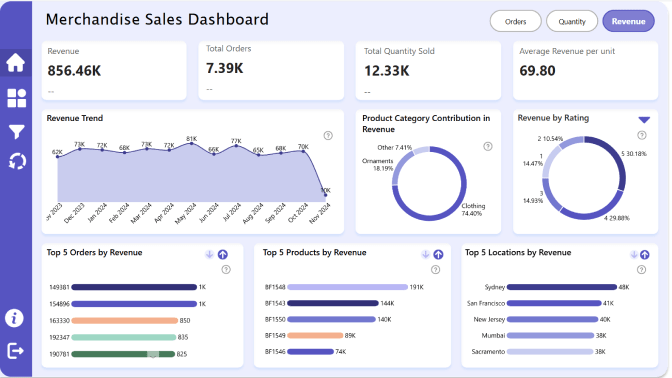
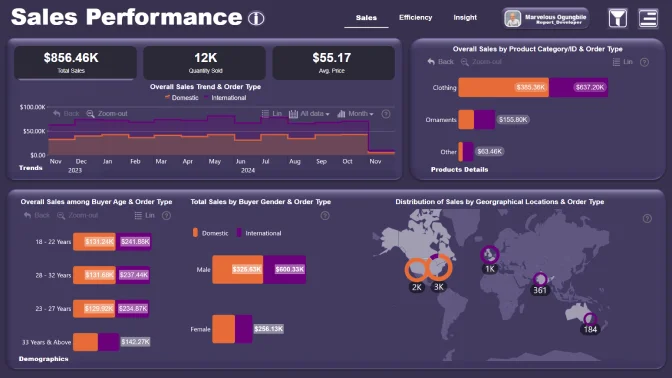
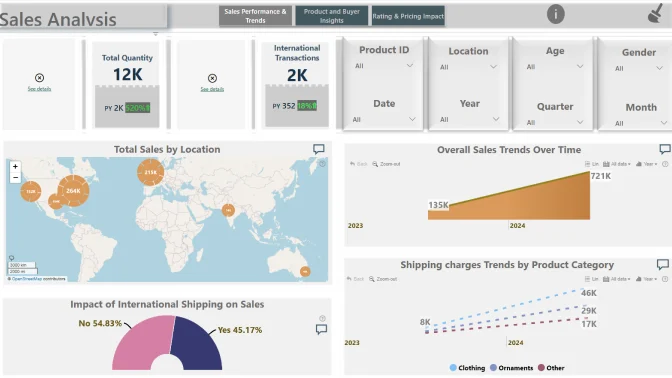
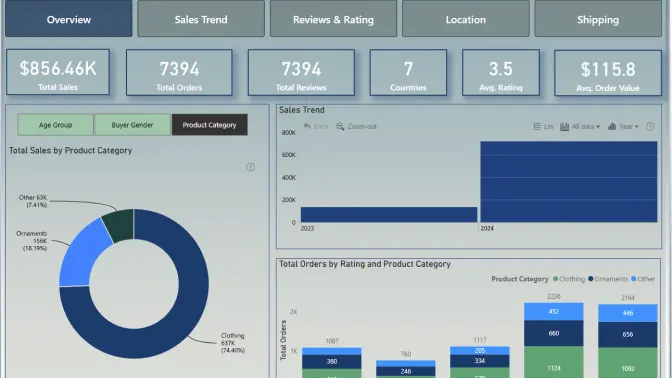
- What are the overall sales trends?
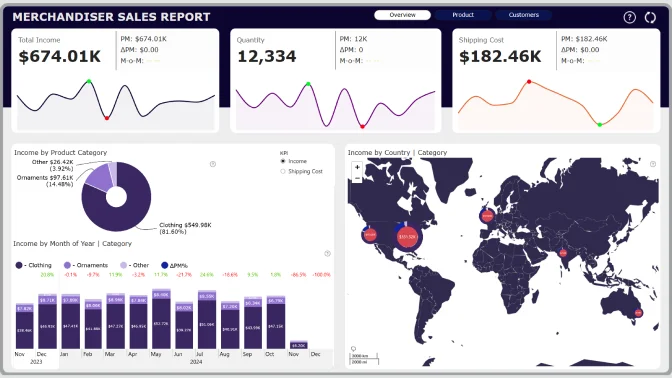
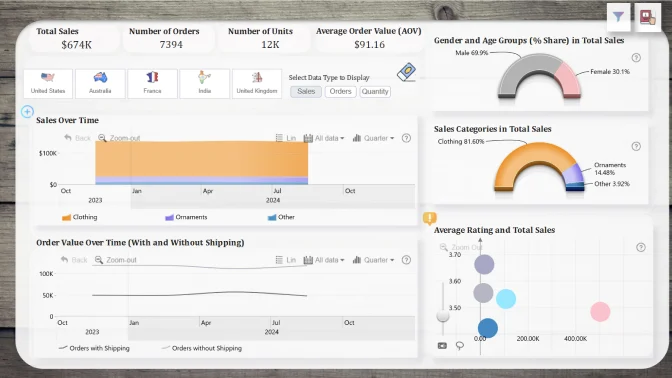
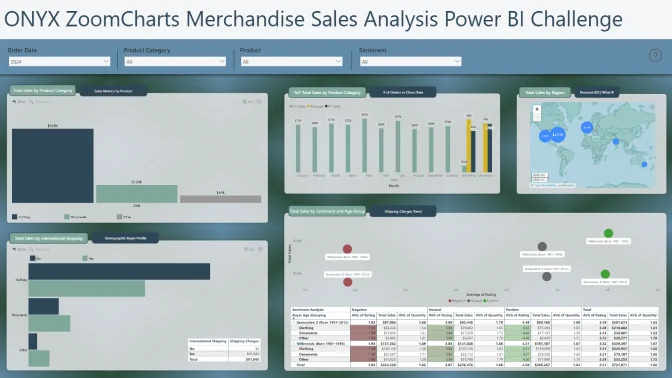
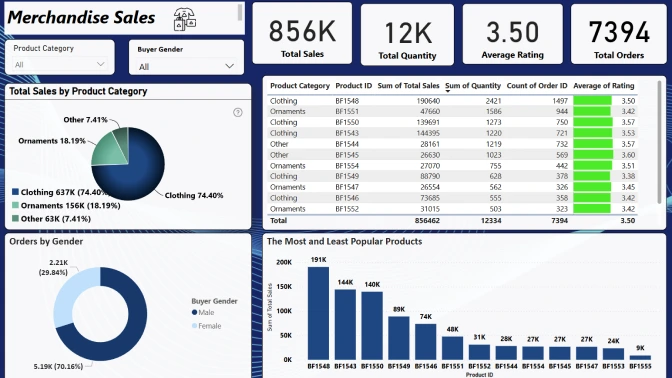
- Which product categories perform the best?
- What are the most and least popular products?
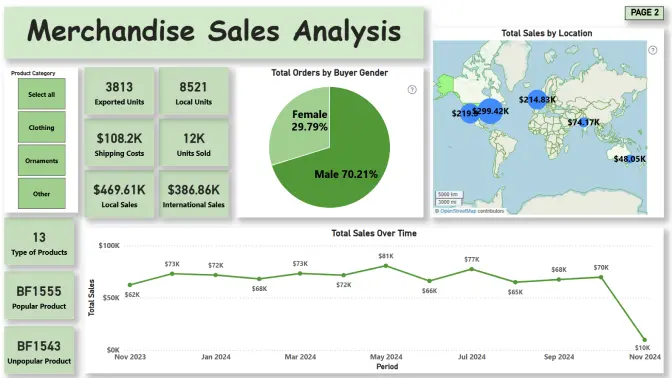
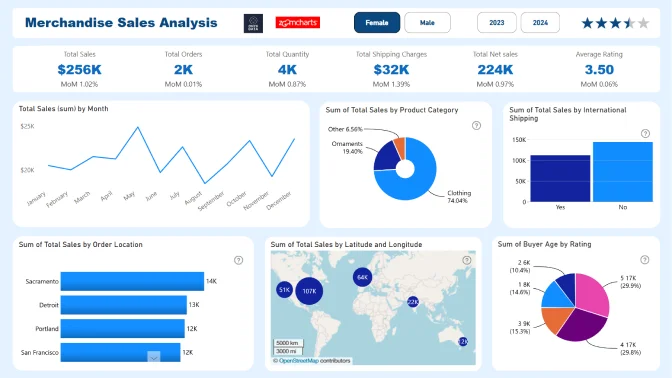
- How does location affect sales performance?
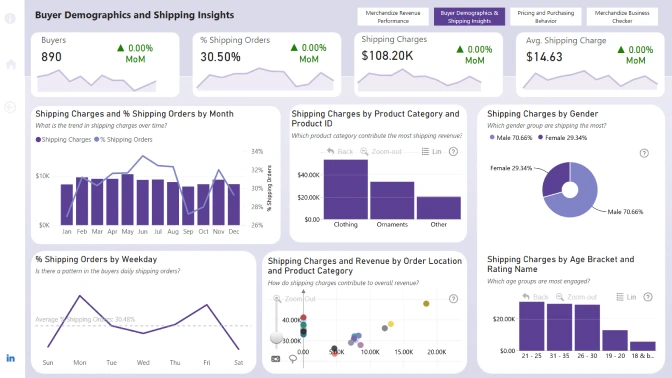
- What impact does international shipping have on sales?
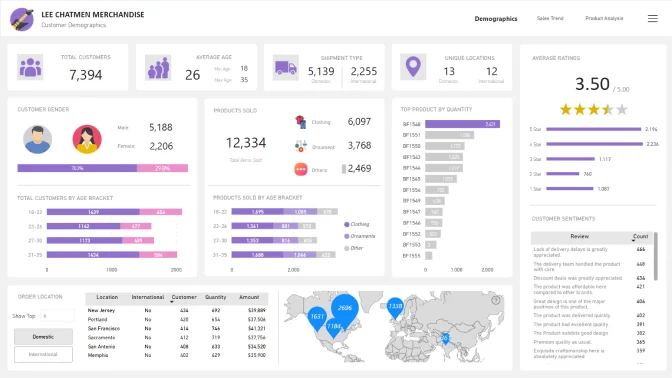
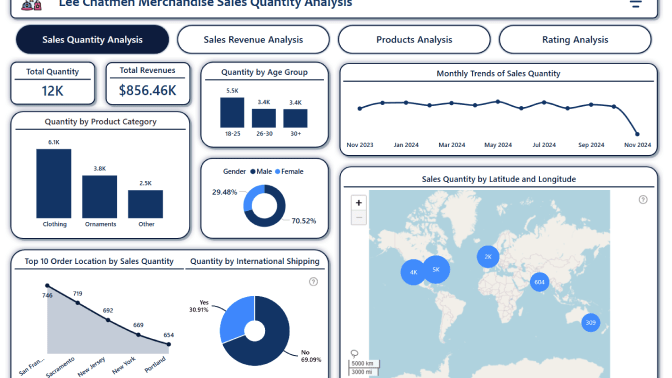
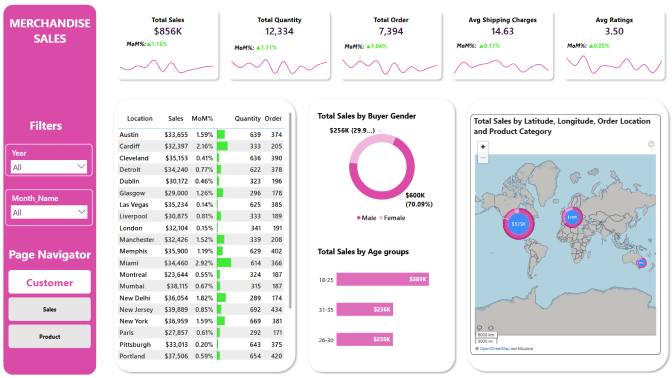
- What is the demographic profile of buyers?
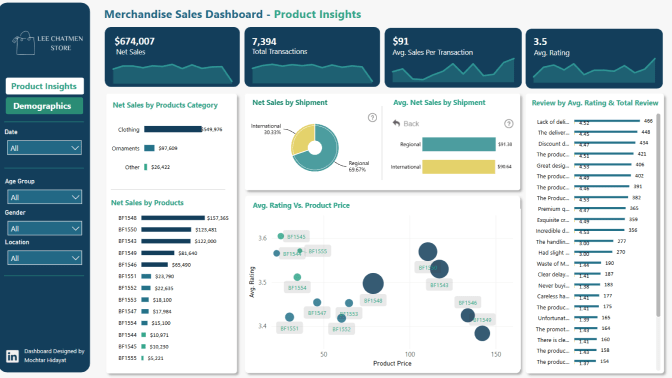
- How do ratings and reviews correlate with sales?
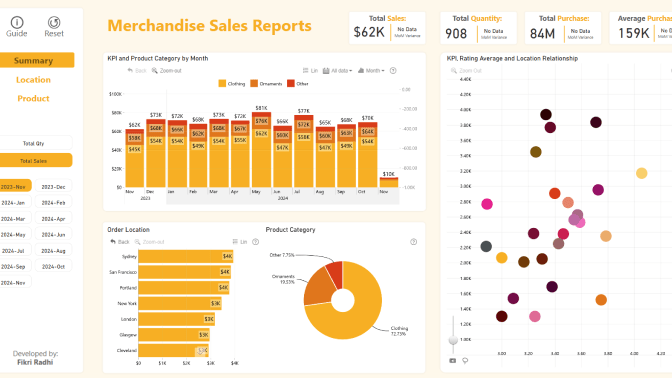
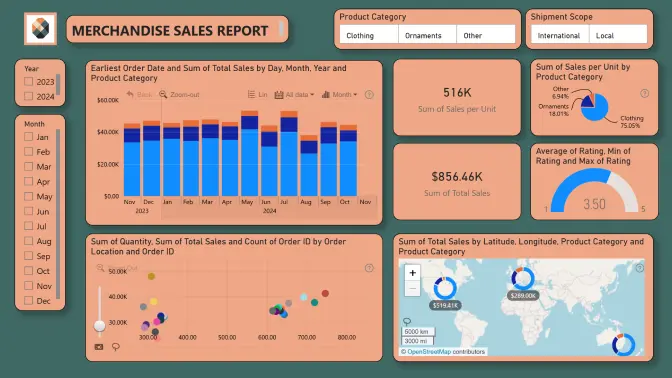
- What are the trends in shipping charges?
- How do discounts or promotional pricing influence purchasing behavior?
- Are there any patterns in repeat purchases?
Technical requirements
- Build your report using only Power BI
- The number of pages in the report is not limited
- At least one report page has to contain a minimum of 2 ZoomCharts Drill Down Visuals. See a practical guide on Drill Down Visuals here
Judging criteria
Each report is evaluated based on three main criteria: intuitiveness, insightfulness, and interactivity. These factors ensure that the reports are not only accurate and functional, but also meet the target audience's needs and are ready to be presented to the end-users.
- Intuitive: How clear and easy it is to understand the report at a glance? (max 15 points)
- Is the report visually appealing?
- Choice of charts and visual elements
- Does the report tell a story?
- Is it not overwhelming to the user?
- Choice of tooltips, titles, and legends
- Interactive: How engaging and seamless is the report exploration and interaction with data? (max 15 points)
- Clear navigation that allows user to explore the report
- Use of slicers and other interactive elements
- Smooth cross-chart integration
- Is report optimized for touch devices?
- Are tutorials and guiding elements helpful to the user?
- Insightful: How accurate, complete, and meaningful is the data in driving decisions? (max 15 points)
- Depth of analysis
- Data cleaning and preparation
- Does data show up accurately in the report?
- Is report optimized for quicker loading time?
- Does the report provide deeper exploration of data (drill-down)?