logo
For Power BI
  • Products
    • Custom Visuals for Power BI
    • Report Templates
  • Resources

      Resources

    • Documentation
    • Report Examples
    • Blog
    • Webinars
    • Video Tutorials
    • Visuals Gallery

    Support

    • ZoomCharts Assistance
    • Contact Sales
    • Contact Support
    • FAQ

    Challenges

    Challenges

    Improve your report creation skills by participating in free challenges for report creators.

    Learn more
    Get Developer License
  • Services
    • Power BI Report Development
    • Custom Visual Development
  • Challenges
  • Pricing
    • Custom Visuals for Power BI
    • Report Templates
Subscribe
Subscribe
Get it now
Go back

Contents

Contest logo
Contest logo
Contest logo
Contest logo
Try Free Now
Go back

Onyx Data January 2025 Challenge

Report Author: Dalia Hassan

115

Comprehensive Sales Performance Dashboard

Report
Report Interact

Donut Ecommerce Sales

Share template with others

Report submitted for Onyx Data DataDNA ZoomCharts Mini Challenge, January 2025. The report is based on the Merchandise Sales dataset and includes ZoomCharts custom Drill Down PRO visuals for Power BI.

Author's description:

The Comprehensive Sales Performance Dashboard file includes three interconnected dashboards, offering a detailed analysis of sales performance, customer behavior, and product trends. Each dashboard provides unique insights to guide decision-making.

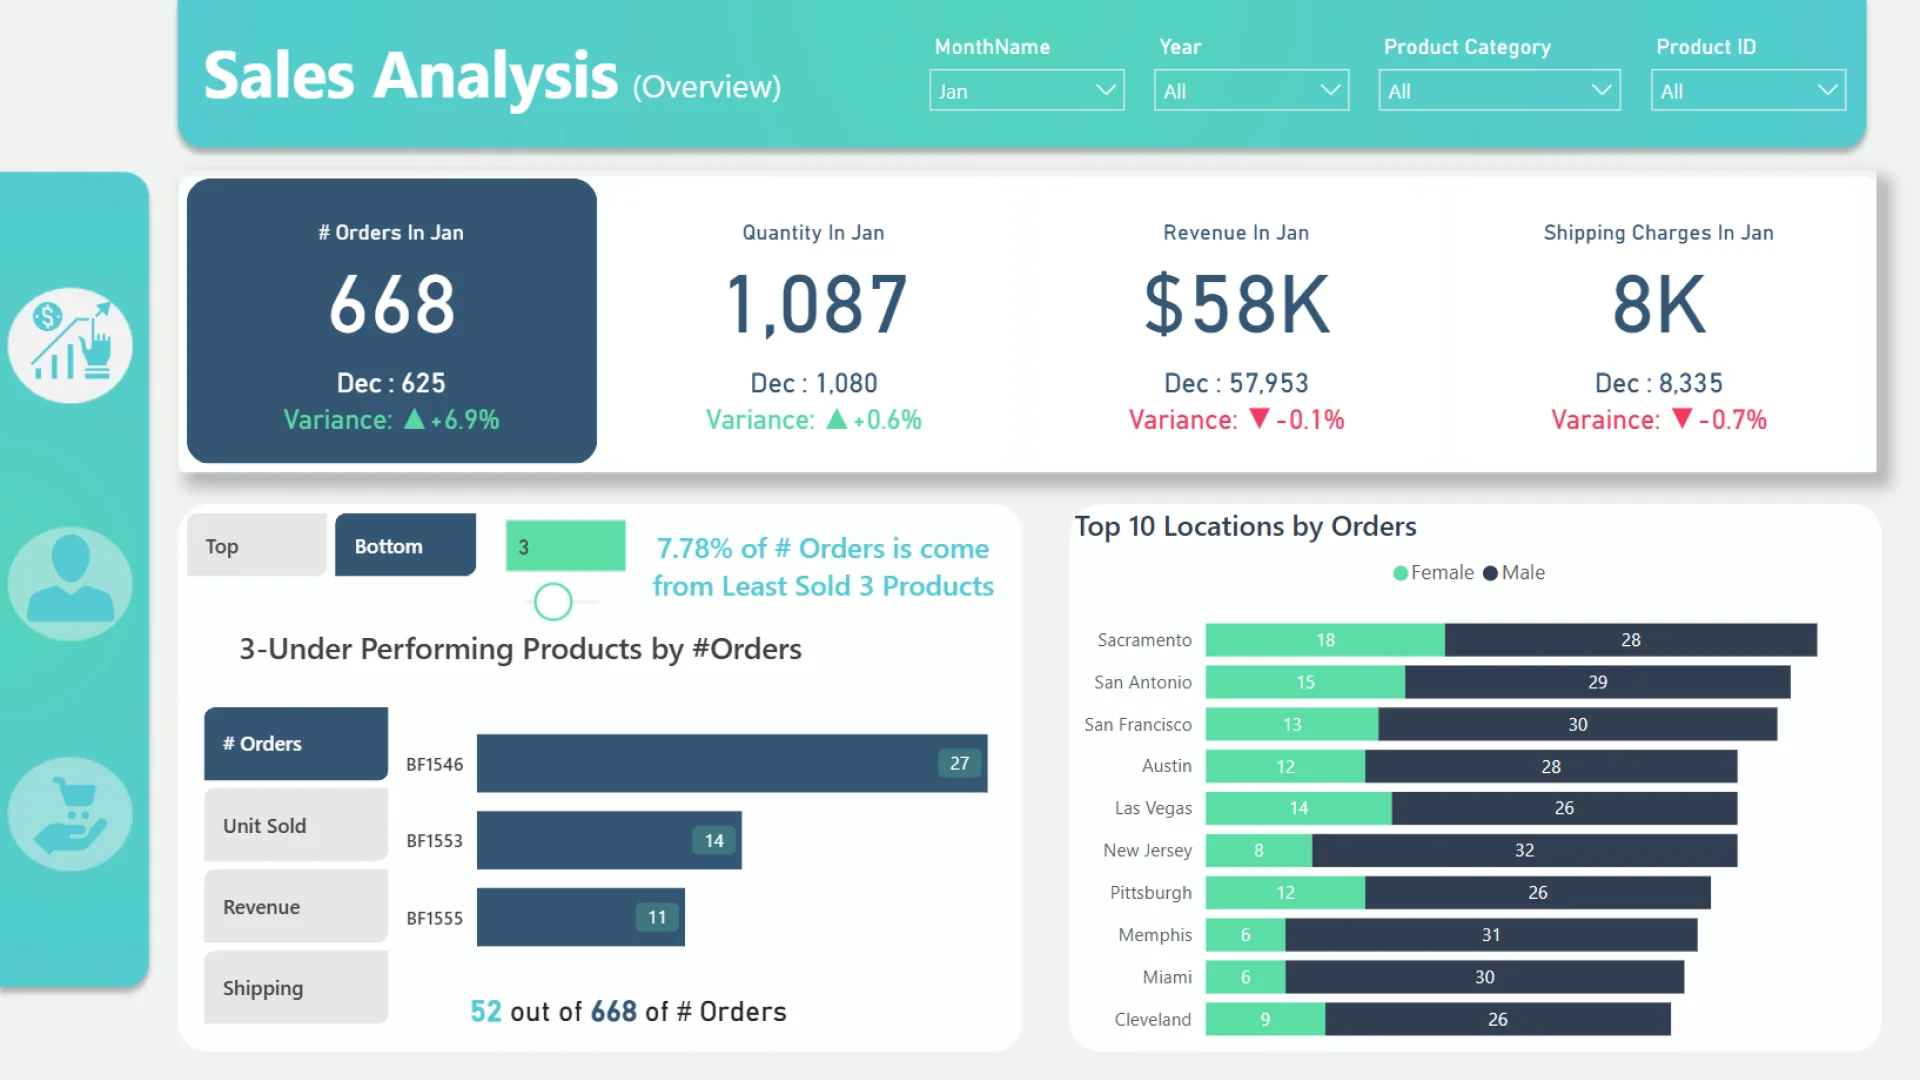
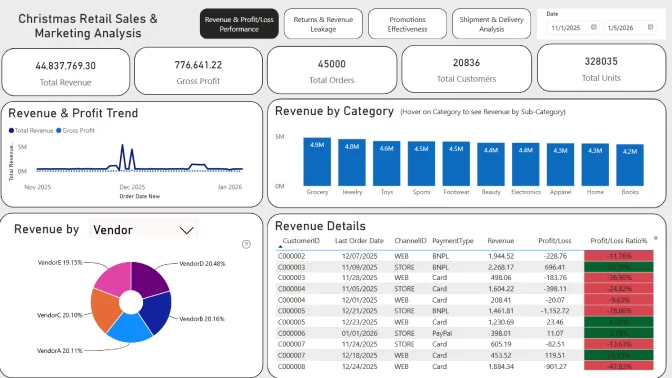
The Sales Overview Dashboard delivers a high-level analysis of monthly performance. January experienced slight declines in orders (-6.9%) and quantity sold (-0.6%) compared to December, with minimal revenue impact (-0.1%). Shipping charges also fell slightly (-0.7%). Notable underperforming products (e.g., BFH56, BFH53, BFH55) contributed to 7.78% of total orders. Additionally, customer ratings played a significant role in international shipping, with 33.38% of orders receiving 5-star ratings.

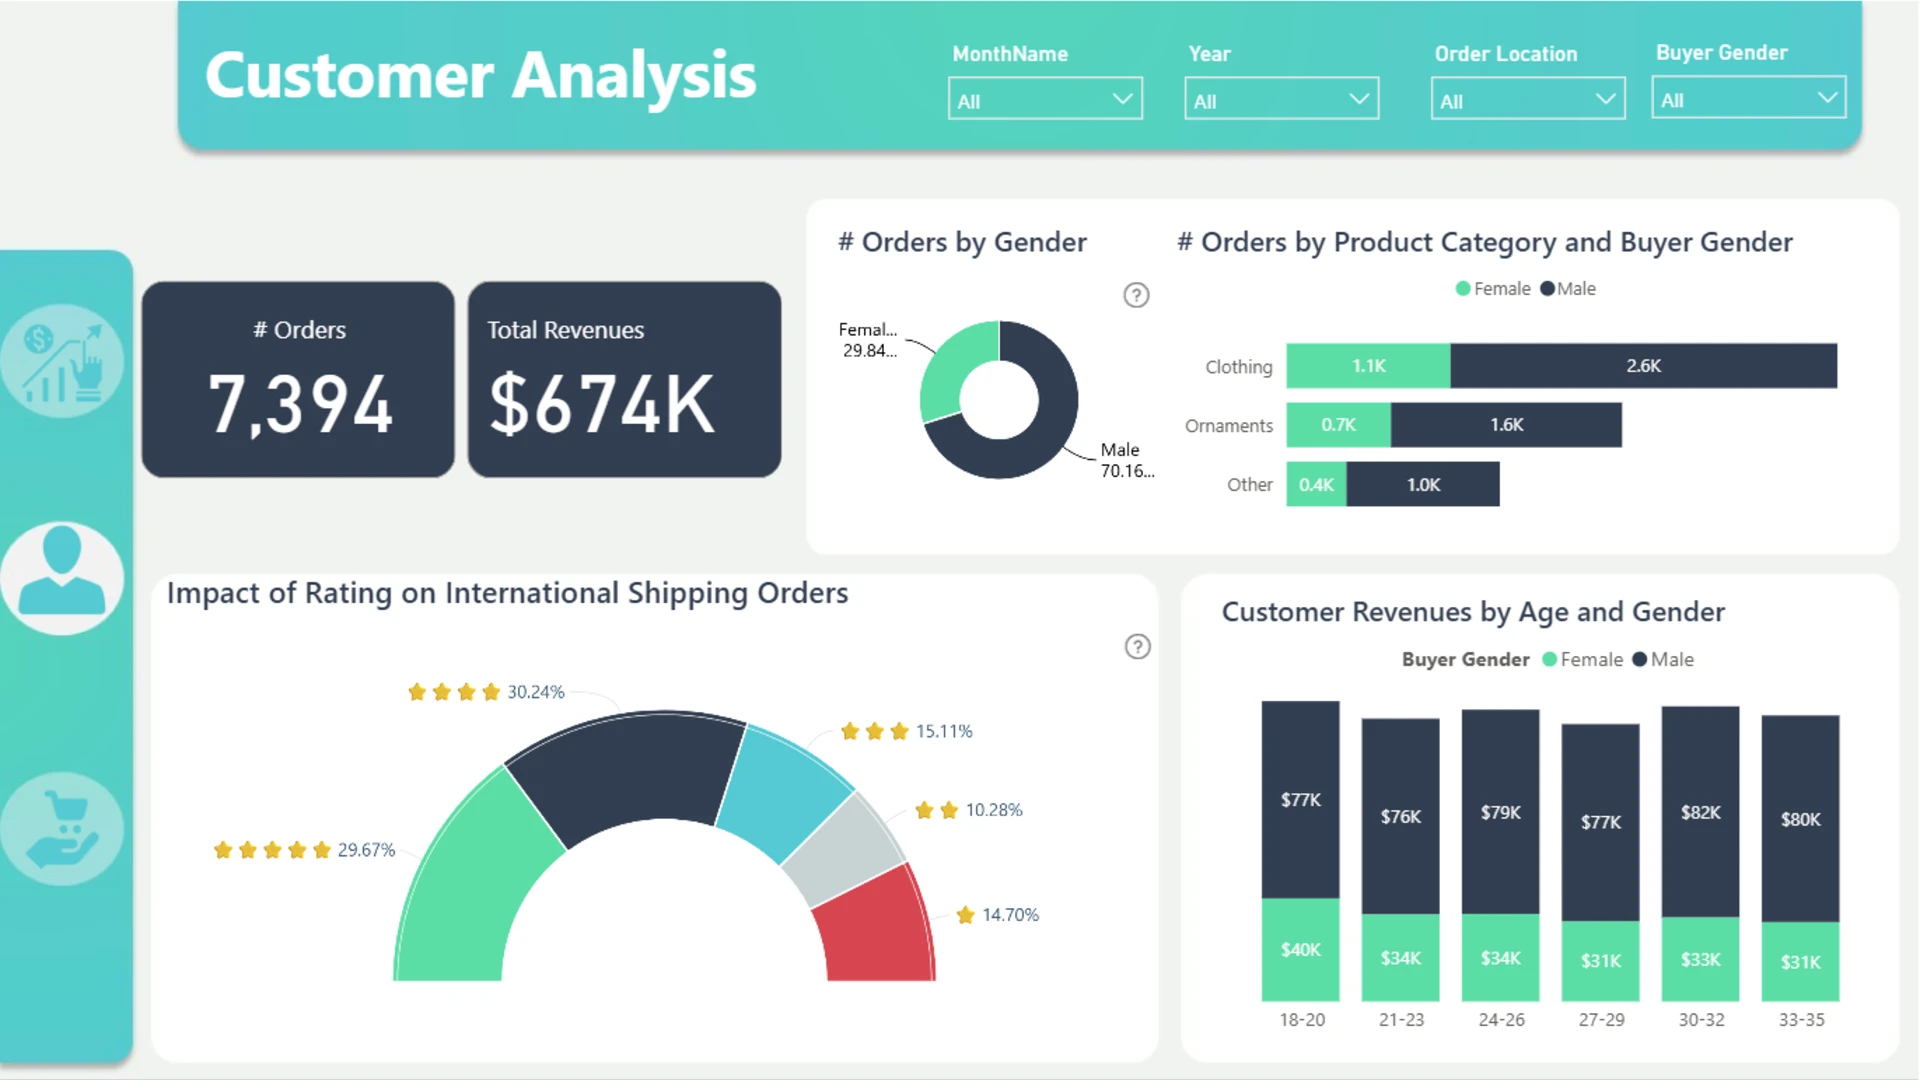
The Customer and Geographic Analysis Dashboard focuses on customer demographics and geographic distribution. It breaks down orders by gender and product category, offering insights into buyer preferences. Top locations by orders and revenues, segmented by age and gender, provide valuable context for identifying key customer segments and regions that drive sales.

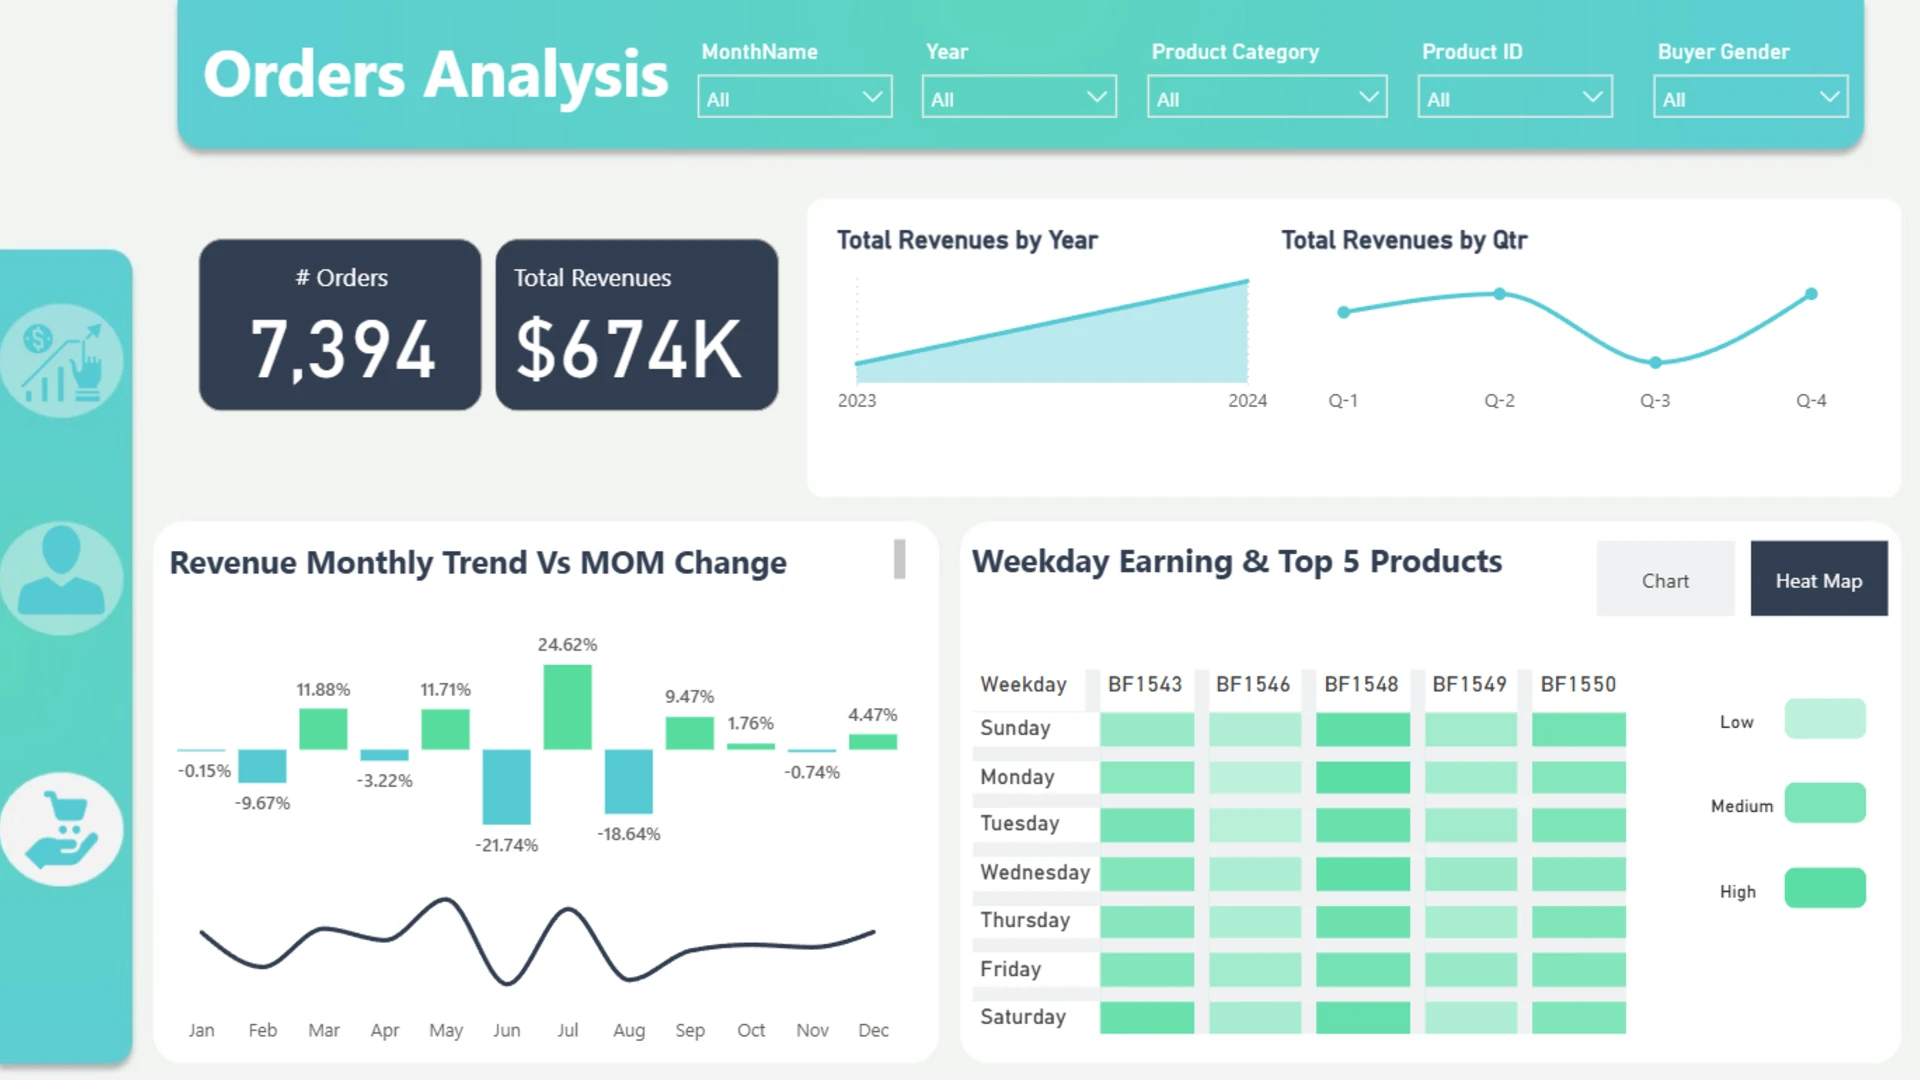
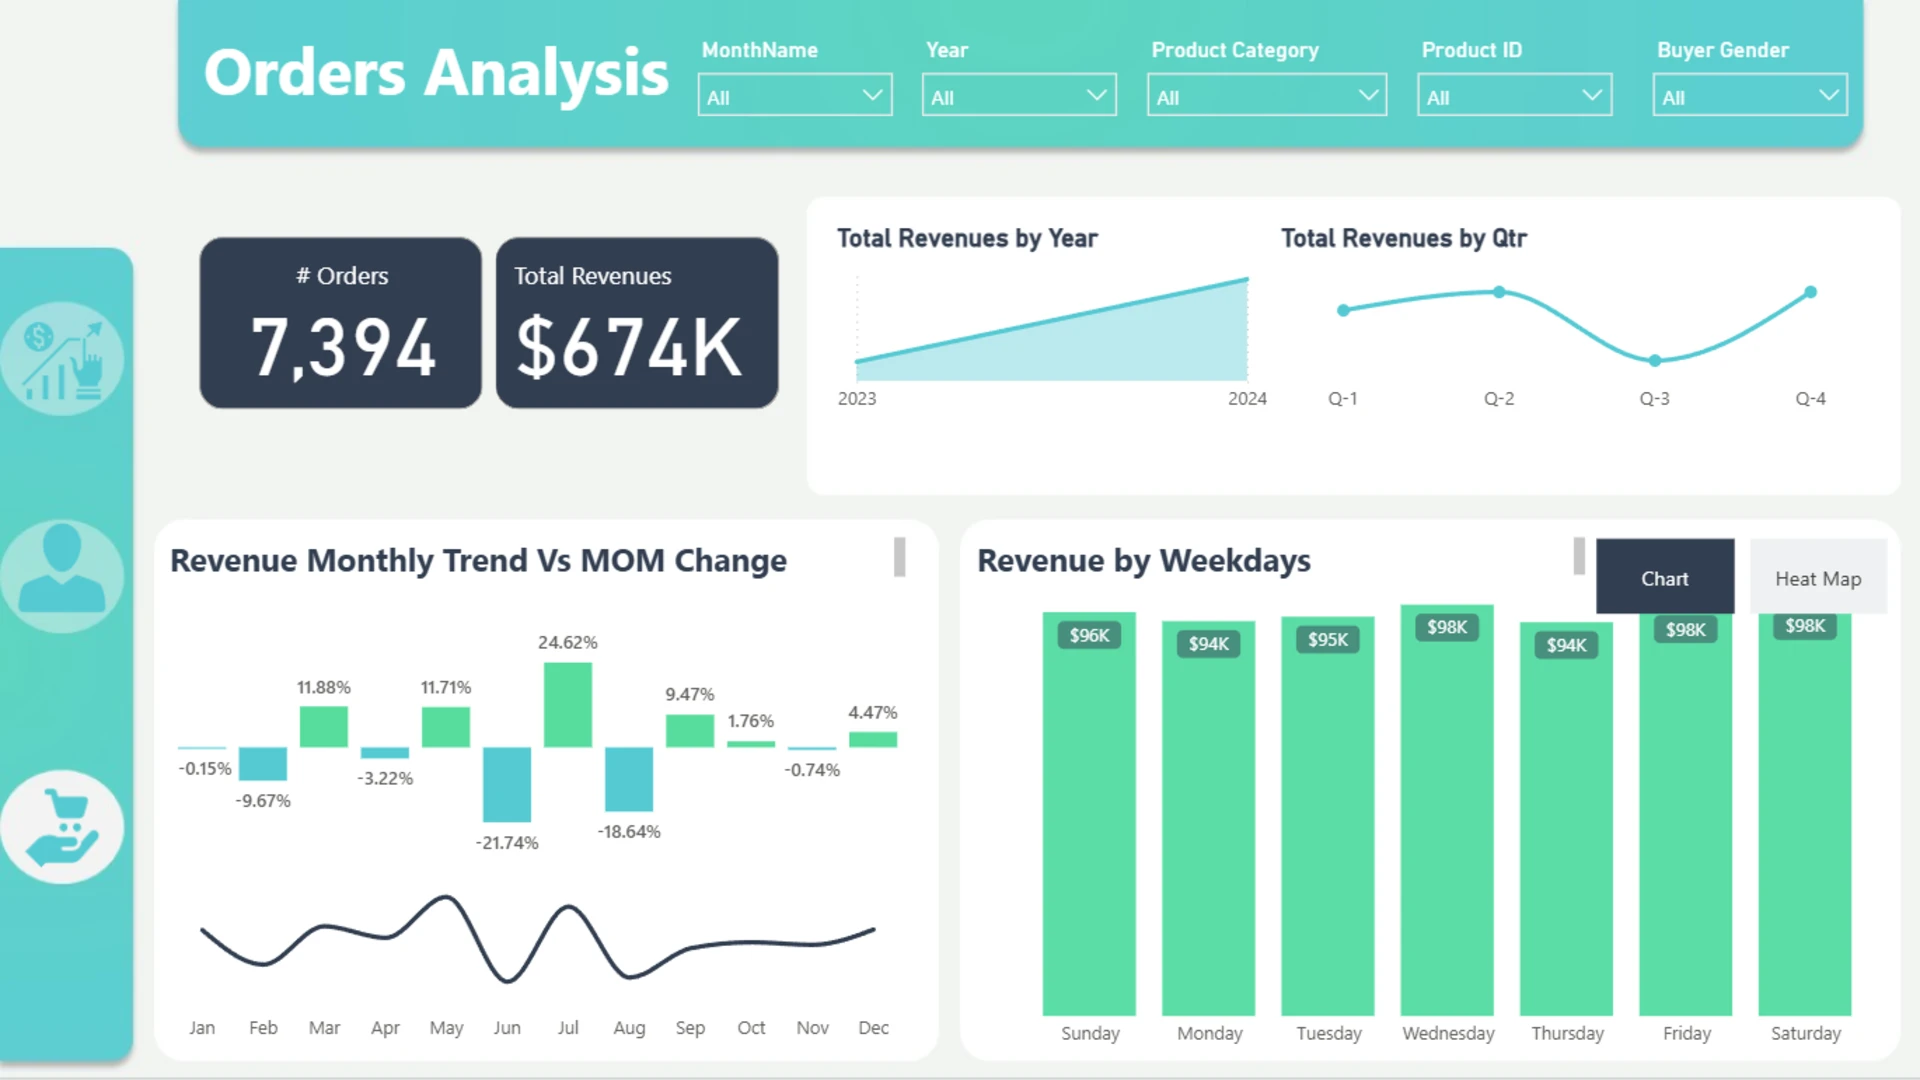
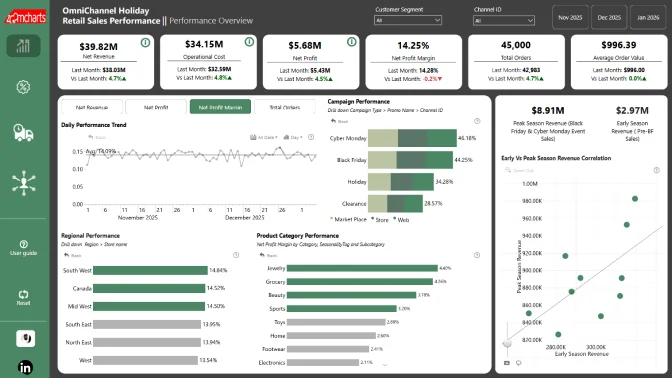
The Revenue Trends and Product Performance Dashboard tracks revenue patterns and product performance over time. Monthly revenue trends reveal notable fluctuations, including significant declines in June (-24.62%). Quarterly and yearly breakdowns highlight seasonal patterns, while weekday earning trends and top-performing products provide actionable insights for inventory management and marketing strategies.

Key takeaways across the dashboards include:

  • Sales Performance: Stable revenue despite a slight drop in January orders and quantity sold, suggesting room to improve order volume.
  • Product Insights: Identifying underperforming products and highly rated items impacting international shipping offers opportunities for strategic adjustments.
  • Customer Behavior: Demographic and geographic insights help refine marketing efforts to target key customer segments.
  • Revenue Trends: Seasonal fluctuations and product trends provide critical data for optimizing revenue strategies.

This file equips sales managers and strategists with the tools needed to make informed, data-driven decisions and improve overall sales performance.

ZoomCharts visuals used

Drill Down Donut PRO Drill Down Donut PRO

Need help?

Send your question to ZoomCharts assistant, and we will respond to you as soon as possible.

Contact Us

Mobile view allows you to interact with the report. To Download the template please switch to desktop view.

Report Overhaul

ZoomCharts Academy

Learn ZoomCharts with experts and become certified!

Go to Academy!
Report Overhaul

Was this helpful? Thank you for your feedback!

Sorry about that.

How can we improve it?

Comprehensive Sales Performance Dashboard

Share

ZoomCharts

Welcome to ZoomCharts

You’re almost there! Create an account to keep your saved reports.

or
Sign up with Microsoft

Verify your email address

We have sent a code to your email address. Please input the code below.

Didn't receive code? Request again (after 30 seconds)

Already have an account? Log in

ZoomCharts

Log in to your ZoomCharts account

Log in with Microsoft
or
Forgot password?

Reset your password

We'll email you instructions on how to reset your password

Don't have an account? Sign up

Please add credits

You have 0 available downloads.
Get more credits or upgrade your plan to continue.

View pricing
logo
[email protected]
+44 204 577 3993
logo

Products

Drill Down Network PRO Drill Down Waterfall PRO Drill Down Graph PRO Drill Down Combo PRO Drill Down Combo Bar PRO Drill Down Donut PRO Drill Down Pie PRO Drill Down TimeSeries PRO Drill Down Timeline PRO Drill Down Map PRO Drill Down Scatter PRO All Visuals

Resources

Report Examples Webinars Blog ZoomCharts Academy Visuals Gallery Documentation Custom Visual Development Subscribe to News

Solutions

Custom Visual Development

Company

Pricing About Us Partners Leave feedback Join PowerGroup EU Funding

Help

ZoomCharts Assistance Contact Sales Contact Support FAQ

Drill Down Network PRO Drill Down Waterfall PRO Drill Down Graph PRO Drill Down Combo PRO Drill Down Combo Bar PRO Drill Down Donut PRO Drill Down Pie PRO Drill Down TimeSeries PRO Drill Down Timeline PRO Drill Down Map PRO Drill Down Scatter PRO All Visuals

Report Examples Webinars Blog ZoomCharts Academy Visuals Gallery Documentation Custom Visual Development Subscribe to News

Custom Visual Development

Pricing About Us Partners Leave feedback Join PowerGroup EU Funding

ZoomCharts Assistance Contact Sales Contact Support FAQ
+44 204 577 3993
[email protected]

Ready to get in touch?

Contact our experts with any question about Power BI and ZoomCharts for Free!

Contact us

© 2025, Data Visualization Software Lab

U.S. Patents No. 11,645,343; 11,921,804; 12,346,389

Cookies
Privacy Policy
Global
Legal
Patent
warning

Error message

success

Success info: Done!

ZoomCharts AI Assistant

We noticed you're using an old OS version.

For the best experience, we recommend upgrading to ensure that all website features display correctly.

Cookie settings

We use necessary cookies for site functionality, as well as statistic, marketing, and preference cookies to enhance your experience. For more information and to manage your preferences, please visit our Cookie policy