logo
For Power BI
  • Products
    • Drill Down Donut Pro Drill Down Donut PRO
    • Drill Down Pie Pro Drill Down Pie PRO
    • Drill TimeSeries Pro Drill Down TimeSeries PRO
    • Drill Combo Pro Drill Down Combo PRO
    • Drill Map Pro Drill Down Map PRO
    • Drill Scatter Pro Drill Down Scatter PRO
    • Drill Down Network Pro Drill Down Network PRO
    • Drill Down Waterfall Pro Drill Down Waterfall PRO
    • Drill Down Graph Pro Drill Down Graph PRO
    • Drill Down Timeline Pro Drill Down Timeline PRO
    • Drill Down Combo Bar PRO Drill Down Combo Bar PRO

    Video tutorials

    Watch Now

    More than 90 videos on how to enhance Power BI with ZoomCharts

    Learn more
    All visuals
  • Resources

      Resources

    • Documentation
    • Report Examples
    • Blog
    • Webinars
    • Video Tutorials
    • Visuals Gallery

    Support

    • ZoomCharts Assistance
    • Contact Sales
    • Contact Support
    • FAQ

    Challenges

    Challenges

    Improve your report creation skills by participating in free challenges for report creators.

    Learn more
    Start trial
  • Services
    • Power BI Report Development
    • Custom Visual Development
  • Challenges
  • Pricing
Request a quote Start Free Book a Demo Sign in
Get it now
Go back

Contents

Go back

Share

Logo

Welcome to the Onyx Data August 2024 Challenge!

Jul 31 - Aug 28, 2024 | EDT

Strengthen your financial analysis expertise with August challenge on financial performance of a sporting goods manufacturer. 💪

Timeline

Registration Open

Registration Open

31 July | 21:00

-

Submissions Open

Submissions Open

31 July | 21:00

-

Workshop | How to Use the Waterfall Chart in Financial Analysis

Workshop | How to Use the Waterfall Chart in Financial Analysis

13 August | 10:00

-

1:1 Mentoring Sessions

1:1 Mentoring Sessions

13 August | 10:00

31 July - 23 August

Entry Submission Deadline

Entry Submission Deadline

23 August | 21:00

31 July - 23 August

Webinar | Financial Analysis in Power BI: Reviewing the Top 5

Webinar | Financial Analysis in Power BI: Reviewing the Top 5

29 August | 10:00

31 July - 23 August

Winner Announced

Winner Announced

29 August | 11:00

31 July - 23 August

Dataset

Get the dataset

See past Onyx Data challenges

See past challenges

Share the challenge

Submitted Reports
About challenge
How to participate
The Brief
Judging criteria
Timeline
Dataset
Past challenges

Winner of the challenge

Report Card

Fitness Company Finance Analysis

Author: Iris Mejuto Crego

17

View Report

All Submissions

Report Card

Fitness Company Finance Analysis

Author: Dileep Venkata Prasad Bocha

4

View Report
Report Card

Fitness Company Finance Analysis

Author: Agbata Dickson Ukolojo

6

View Report
Report Card

Fitness Company Finance Analysis

Author: Divya Pardeshi

4

View Report
Report Card

SportTech Financial Analysis

Author: Ananya B Mishra

3

View Report
Report Card

Fitness Company Finance Analysis

Author: Toyin Taiwo

0

View Report
Report Card

Velocity Edge -Financial Analysis

Author: Balu Chelluri

3

View Report
Report Card

Executive Summary

Author: Dean Kuhn

2

View Report
Report Card

Fitness Company Finance Tactical Analysis

Author: Eszter Kovacs

1

View Report
Report Card

SGM Financial Analysis

Author: Rigoberto Garcia

3

View Report
Report Card

Athletic Financial Insights

Author: Tasnim Ahmad Mumu

1

View Report
Report Card

Fitness Company Finance Analysis

Author: Ankan Bandyopadhyay

0

View Report
Report Card

Fitness Company Finance Analysis

Author: Fernando Calero

0

View Report
Report Card

Fitness Company Finance Analysis

Author: Chiemezuo Ngerem

3

View Report
Report Card

Fitness Company Finance Analysis

Author: Sandesh Arsud

2

View Report
Report Card

Sports Financial Analysis Dashboard

Author: Md. Ashek Rahman Anik

0

View Report
Report Card

Fitness Company Finance Analysis

Author: Eniola Adekoya

3

View Report
Report Card

Fitness Company Dashboard

Author: Manish Kumar

1

View Report
Report Card

Fitness Company Finance Analysis

Author: Rami Kassiar

0

View Report
Report Card

Fitness Company Finance Analysis

Author: Borja Mora

0

View Report
Report Card

Fitness Company 2023 Business Overview

Author: Aury Suarez

0

View Report
Report Card

Financial Performance Analysis of a Sporting Goods Manufacturer

Author: Khadija Raj

0

View Report
Report Card

Fitness Company Finance Analysis

Author: Brenda Ahumada

0

View Report
Report Card

Fitness Company Finance Analysis

Author: Omkar Pol

0

View Report
Report Card

Fitness Company Finance Analysis

Author: Manoj Ramesh

0

View Report
Report Card

Fitness Company Finance Analysis

Author: Yogalakshmi Gunasekaran

0

View Report
Report Card

Fitness Company Finance Analysis

Author: Jesse Ekanem

0

View Report
Report Card

Fitness Company Finance Analysis

Author: Tanisha Singh

0

View Report
Report Card

Financial Analysis of Sports Manufacturing for 2023

Author: Atefeh Mohib

0

View Report
Report Card

Fitness Company Financial Analysis

Author: Mary Omotosho

0

View Report
Report Card

Fitness Company Finance Analysis

Author: Vinay Hegde

4

View Report
Report Card

Fitness Company Finance Analysis

Author: Kudjo Kedji

0

View Report
Report Card

Fitness Company Finance Analysis

Author: Alamutu Kehinde

0

View Report
Report Card

Fitness Company Finance Analysis

Author: Tsegbemi Ayonronmi

0

View Report
Report Card

Fitness Company Finance Analysis

Author: Kanchan Kulkarni

0

View Report
Report Card

Financial Analysis of Fitness Company

Author: Abhinandan Pawar

0

View Report
Report Card

Fitness Company Finance Analysis

Author: NOOR UL AIN

0

View Report
Report Card

Fitness Company Finance Analysis

Author: Vidya G

0

View Report
Report Card

Fitness Company Finance Analysis

Author: Swati Gupta

0

View Report
Report Card

2023 Financial Performance Report: Fitness Company

Author: Kolawole Ibrahim Oguntade

0

View Report
Report Card

Business Finance Dashboard

Author: Mounika Macharla

0

View Report
Report Card

Fitness Company Finance Analysis

Author: Chandrakant Jadhav

0

View Report
Report Card

Fitness Company Finance Analysis

Author: Ogungbile Marvelous

2

View Report
Report Card

2023 Financial Performance Analysis: Sporting Goods Manufacturer

Author: Santhiya Balachandar

0

View Report
Report Card

Fitness Company Finance Analysis

Author: Subhasis Das

0

View Report
Report Card

Fitness Company Finance Analysis

Author: Gori Omotola

0

View Report
Report Card

Financial Performance Analysis of a Sporting Goods Manufacturer

Author: Phan Thanh Doan

0

View Report
Report Card

Fitness Company Finance Analysis

Author: Araromi Enoch

0

View Report
Report Card

Fitness Company Finance Analysis

Author: Khadijah Shahzad

0

View Report
Report Card

Fitness Company Finance Analysis

Author: Aravind Kontham

1

View Report
Report Card

Fitness Company Finance Analysis

Author: Lalit Mohan Pant

0

View Report
Report Card

Fitness Company Finance Analysis

Author: Sobia Siddiqui

0

View Report
Report Card

Financial Performance | Sporting Goods Manufacturer

Author: Muhammad Naveed Ziai

0

View Report
Report Card

Business Financial Analysis: Onyx Dataset Challenge, August 2024

Author: Ngoc Duong

1

View Report
Report Card

Financial Report

Author: Muhammad Khurram

0

View Report

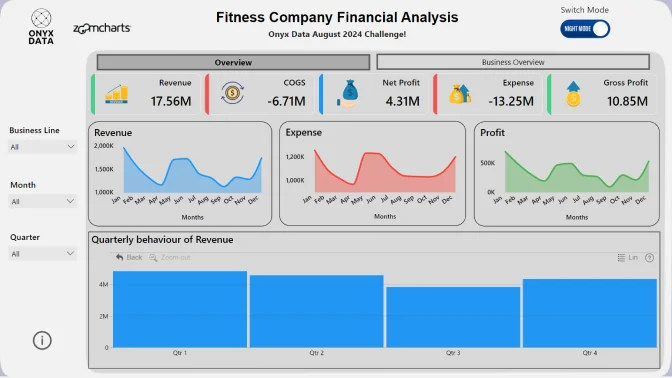
About ZoomCharts Mini Challenge

ZoomCharts Mini Challenge is part of the global DataDNA – Dataset Challenge by Onyx Data, which unites 11K+ data enthusiasts worldwide, ranging from beginners to seasoned professionals, including Microsoft MVPs. Read more about the DataDNA challenge on the Onyx Data website. Join the community on LinkedIn

The ZoomCharts Mini Challenge provides a platform for a growing community to learn how to build PRO reports, aiding business users to explore data quickly and intuitively.

  1. Free License: All participants receive a free ZoomCharts Developer License that gives access to the full Drill Down PRO visuals library. License will remain active for 1 year after the challenge.
  2. Learn from Experienced Professionals: As part of the challenge, we host live workshops on report building and visualizing the challenge’s dataset in Power BI. Challenge participants can also book an individual consultation with an experienced Power BI mentor to ask questions and get personalized tips.
  3. Tailored Feedback: Every challenge submission will receive personalized feedback, giving participants the chance to hone their skills and improve their reports.

Prizes

The best report’s creator will receive a $300 Amazon gift card from ZoomCharts. The Top 5 submissions and the winner will be announced live on August 29th. 

Webinar recordings

Recording thumbnail

How to Use the Waterfall Chart in Financial Analysis

Workshop for the August DataDNA challenge 

Watch the recording
Recording thumbnail

Financial Analysis in Power BI: Reviewing the Top 5

Best DataDNA ZoomCharts Mini Challenge submissions + the winner announcement

Watch the recording

How to participate? 

1. Register for the challenge: 

  • Download the DataDNA Challenge dataset either on this Challenge page or from Onyx Data website. 
  • Register for DataDNA ZoomCharts Mini Challenge.
  • Activate your free Drill Down Visuals Developer License for Power BI. Read license setup instructions.

2. Build your report in Power BI: 

  • Set up an account in Power BI using the assigned license details (if you have participated in ZoomCharts Challenges in the past, you can use the same account you set up before).
  • Use the account to access the full library of custom ZoomCharts Drill Down visuals. 
  • Use the dataset to build a Power BI report including at least 2 ZoomCharts Drill Down Visuals in one report page. 

3. Improve your report and learn new skills: 

  • To learn more about applying ZoomCharts visuals in your reports, participate in the challenge workshop. 
  • If you have any questions or need advice, you can book a free individual consultation. 
  • Check out the submissions from past challenges for inspiration. 

4. Submit your challenge entry: 

  • Submit your report in .pbix format for validation. 
  • If your submission doesn’t match the challenge criteria, you will be notified by email indicating the reason. Don't worry if this happens! You can fix the issue and resubmit your report. 
  • Together with validation confirmation you will receive a publish to web link that you can use to add the report to your portfolio or publicly share online. 
  • All validated entries will receive personalized feedback from the evaluation team. You can use this feedback to revise your report and resubmit it before the deadline. Feel free to resubmit your entry as many times as necessary before the deadline. 

5. Finalize your participation to compete for the prize: 

  • Post the final version of your submission as a single image on your LinkedIn profile, including the tags @ZoomCharts and @OnyxData, as well as the hashtags #dataDNA and #builtwithzoomcharts.
  • After posting the report on LinkedIn, please complete this form. 
  • Follow ZoomCharts on LinkedIn 
  • Follow Onyx Data on LinkedIn 
  • All participants of ZoomCharts Mini Challenge who have filled in the form are also valid to compete in the main Onyx Data DataDNA challenge for a chance to win additional prizes. Read more here. 

6. Attend challenge closing webinar to hear the results: 

  • The submissions are evaluated by ZoomCharts team (see "Judging criteria" for more info). The submissions of Top 5 ZoomCharts Mini Challenge finalists are analyzed live during the challenge closing webinar to share the best practices and learning opportunities with the community.
  • The author of the best report is rewarded with a $300 Amazon gift card from ZoomCharts. 

Challenge Description:

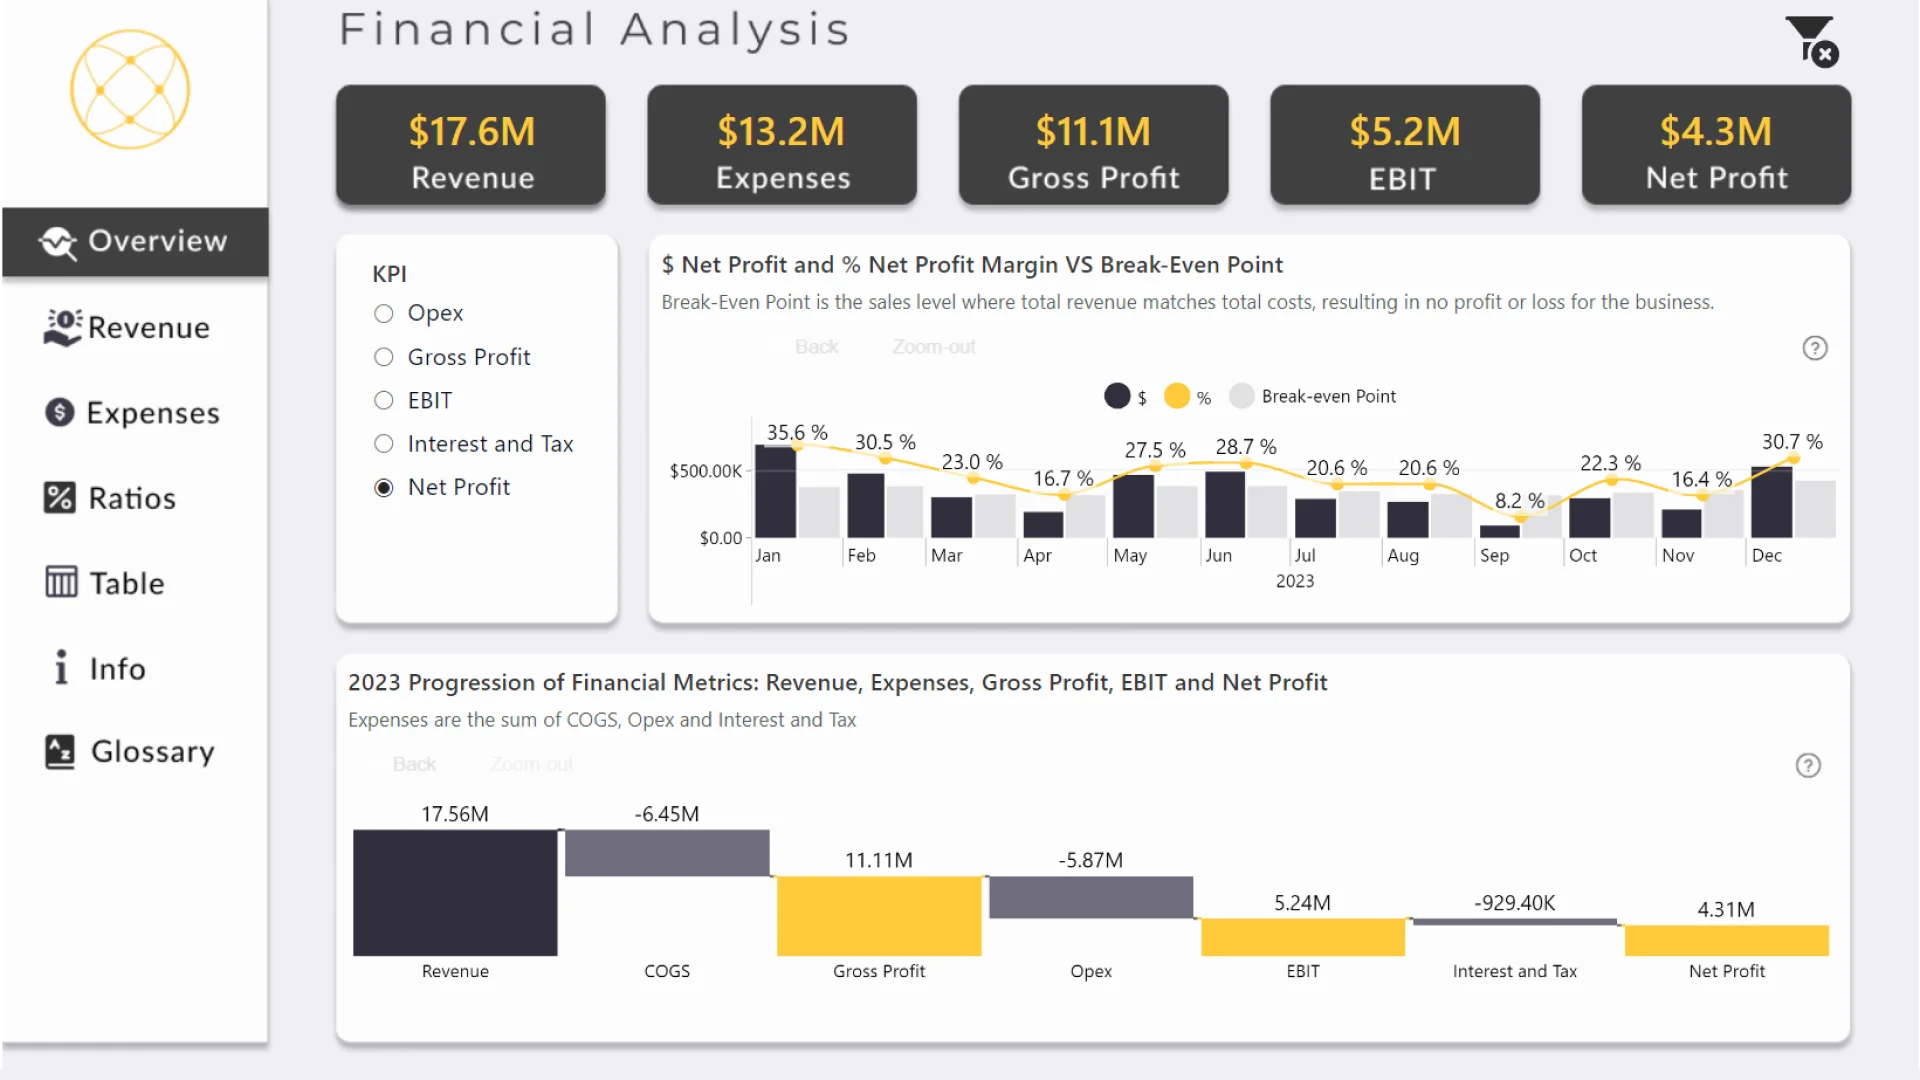
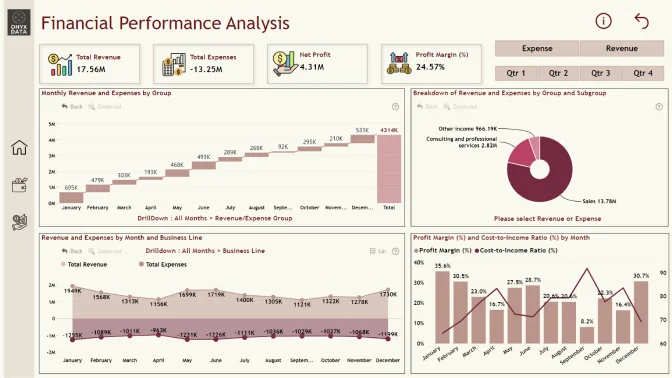
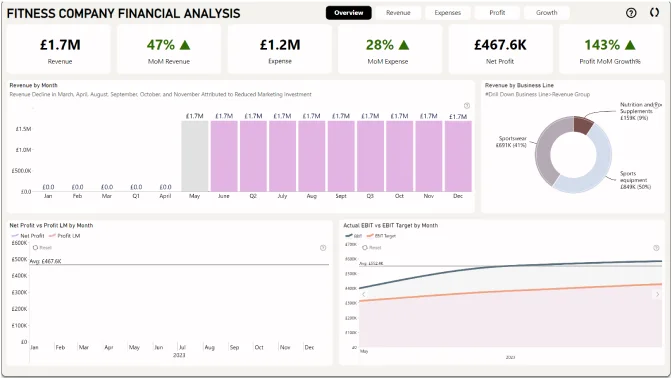
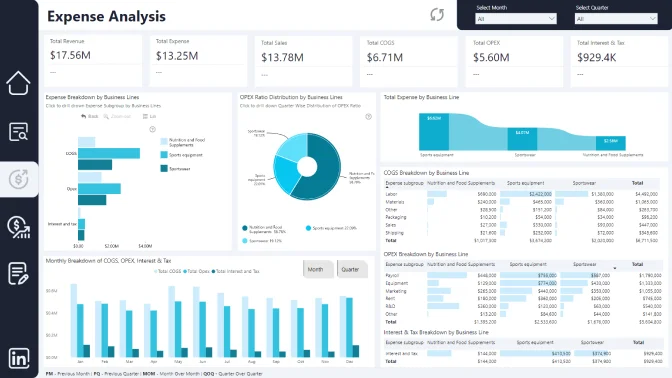
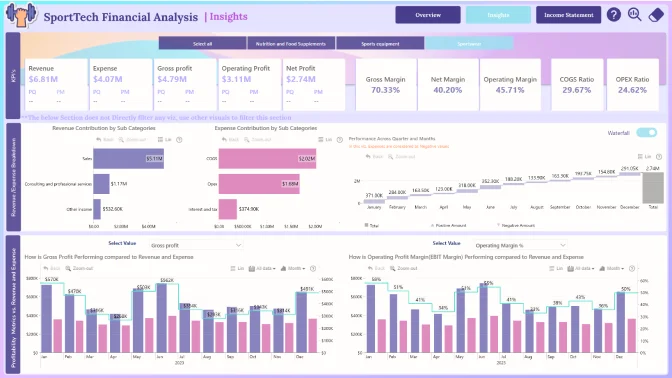
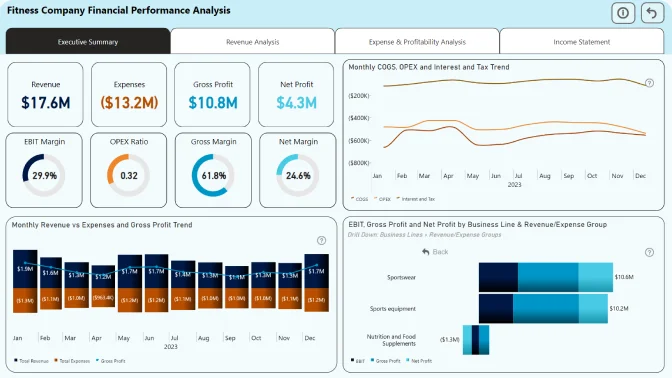
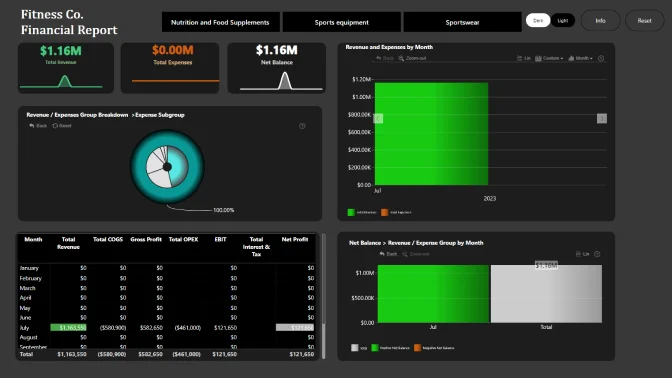
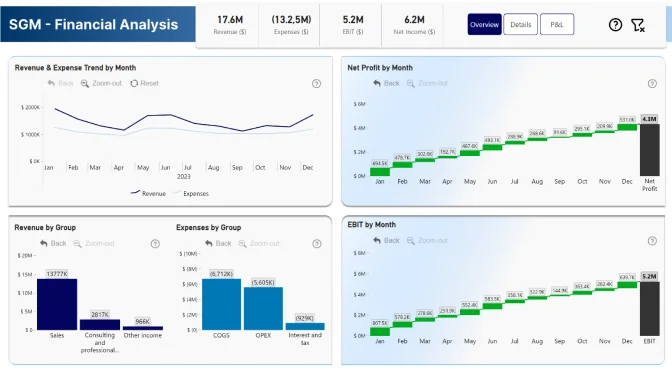
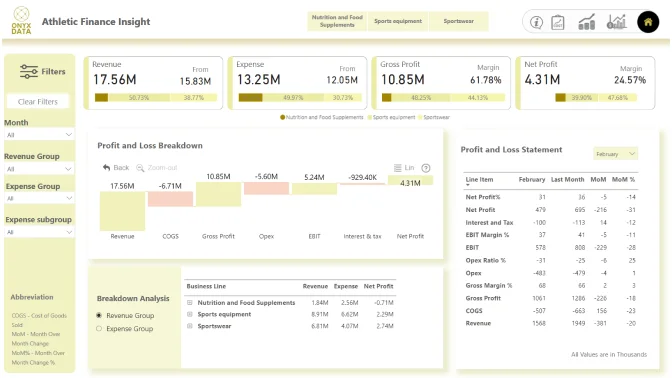
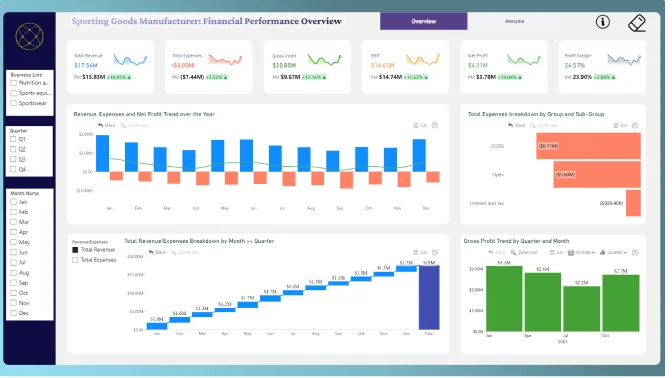
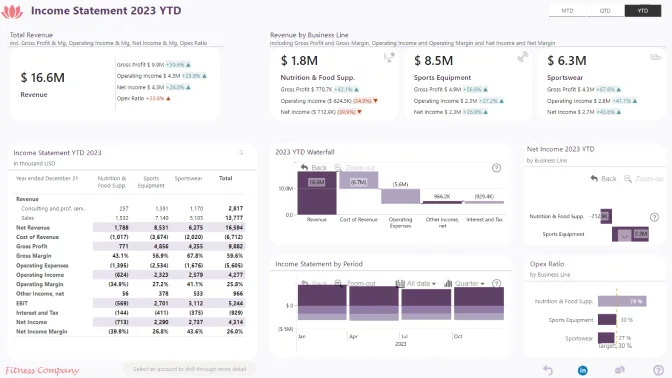
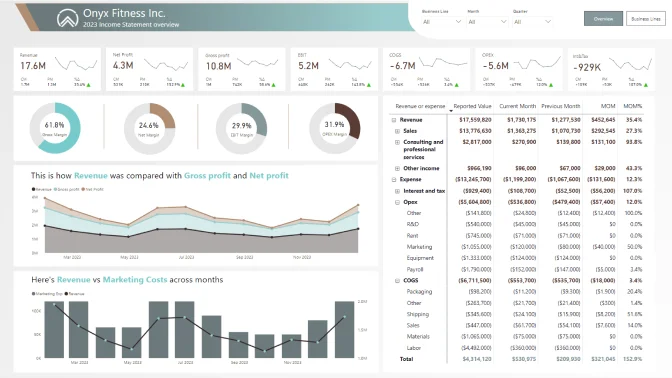
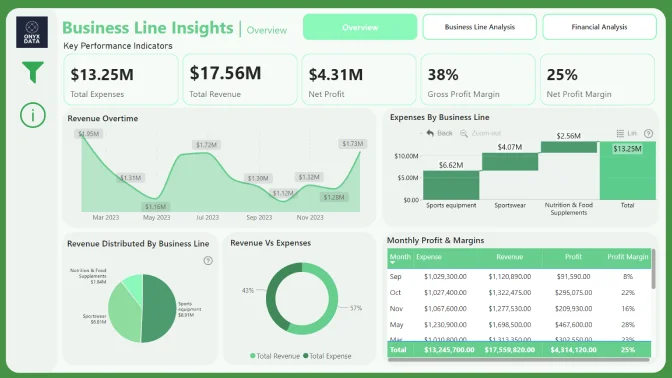
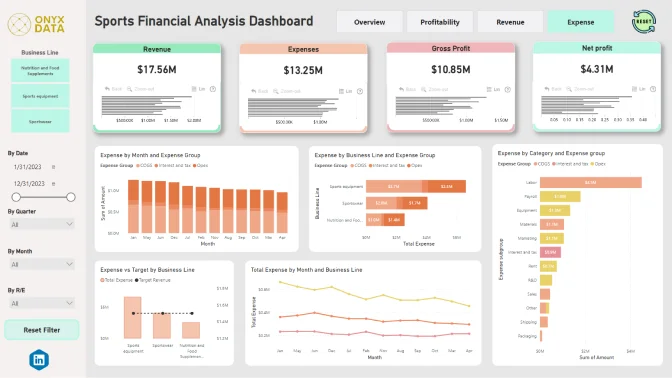
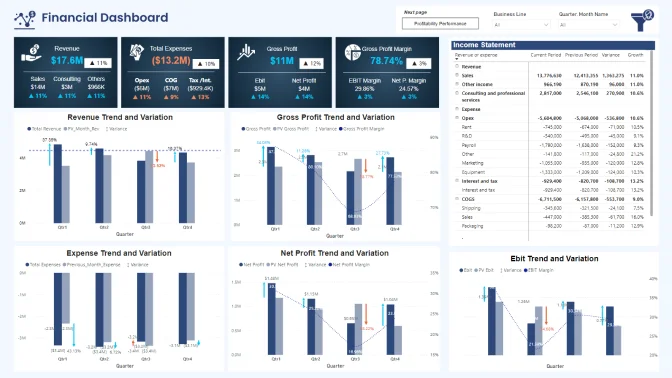
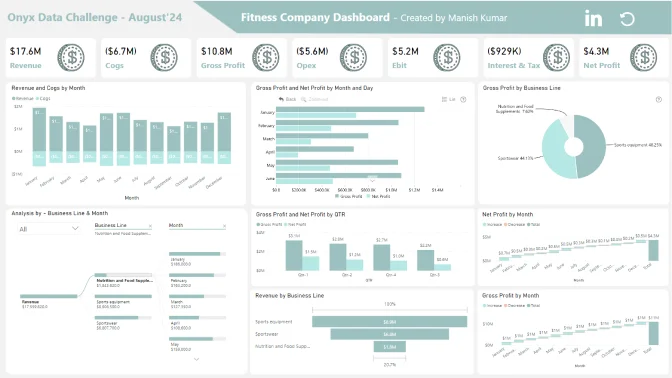
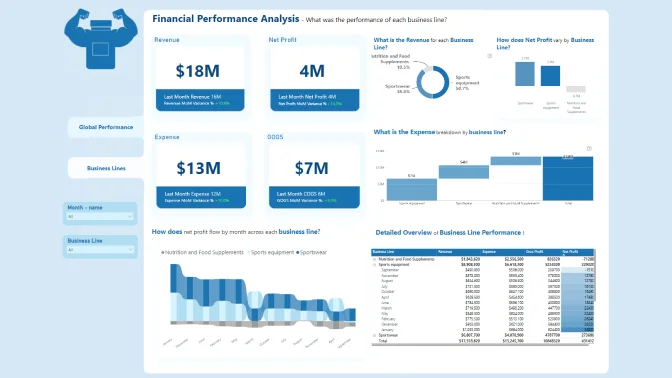
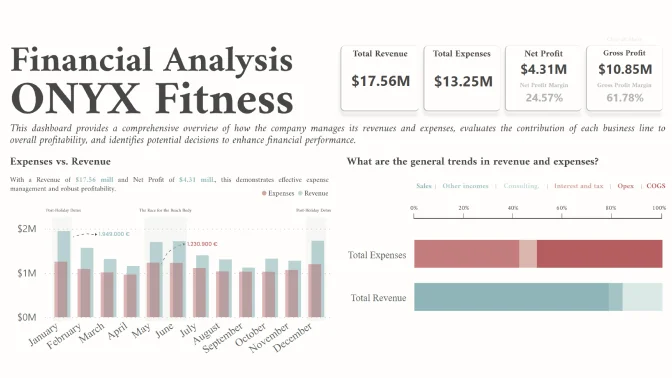
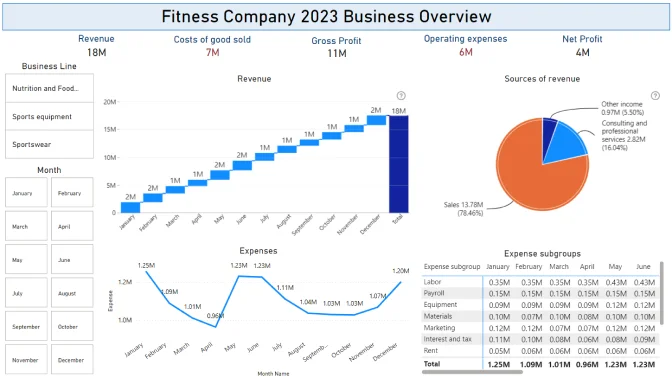
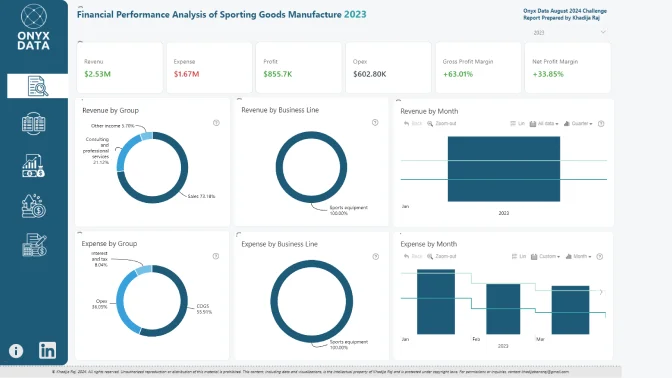
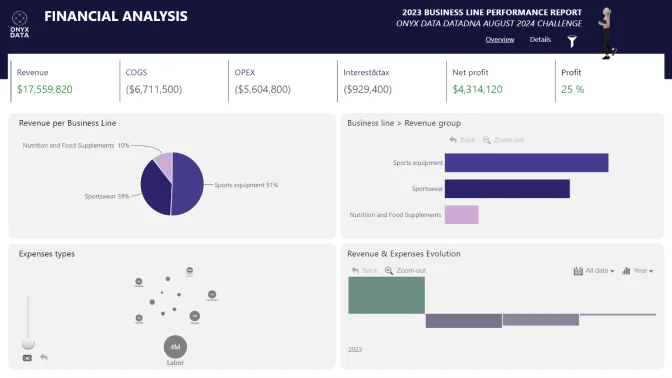
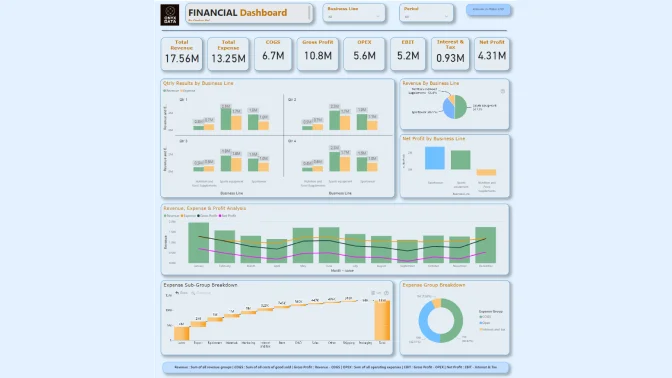
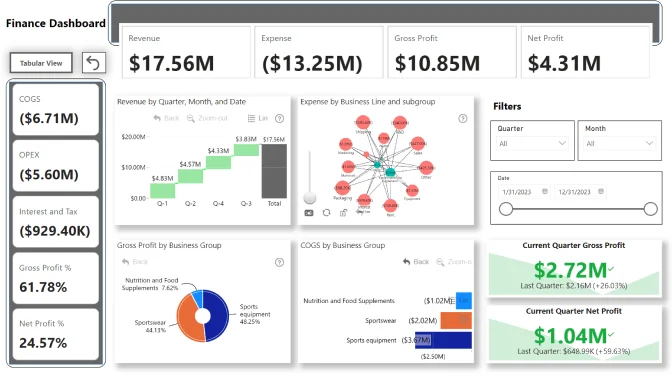
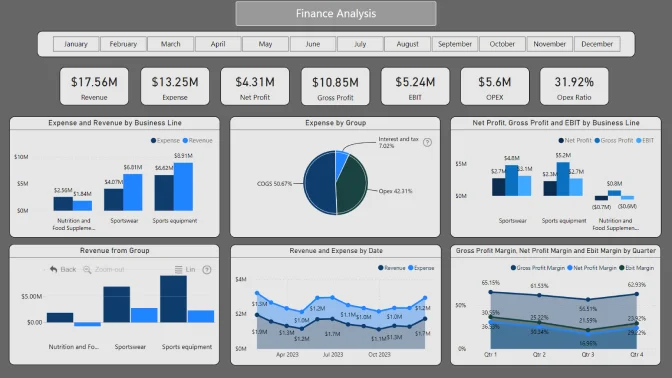
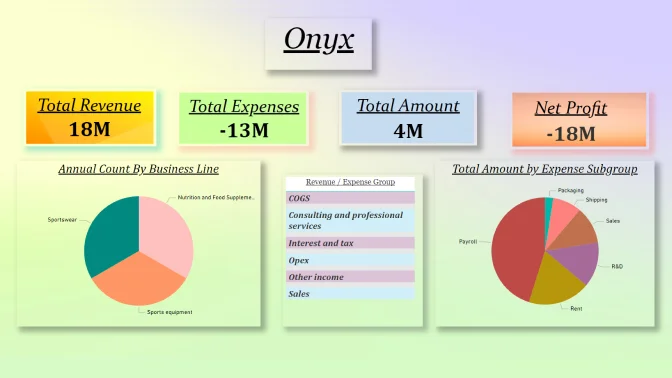
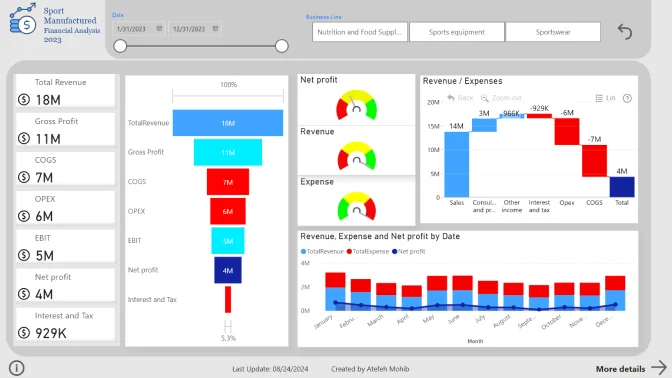
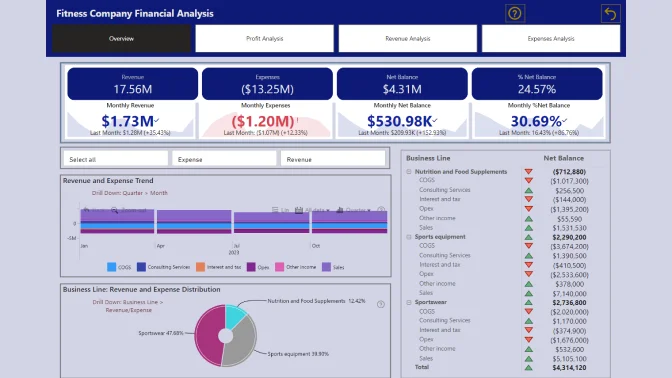
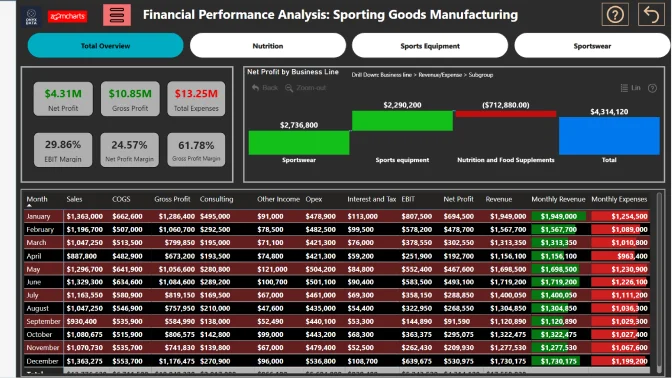
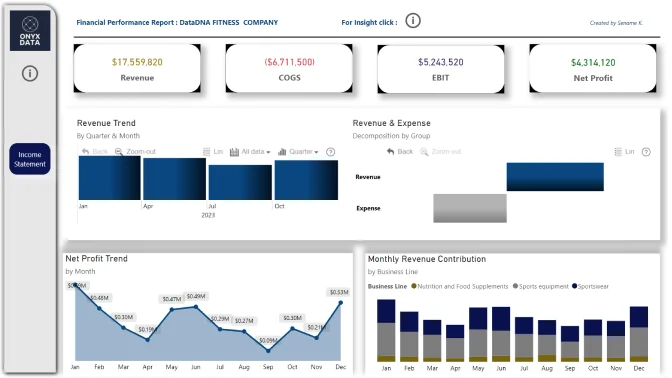
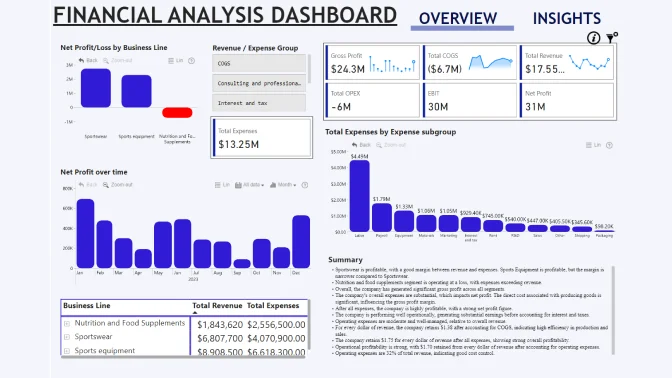
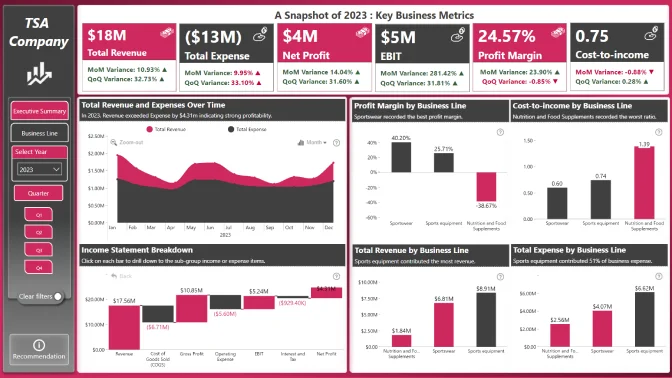
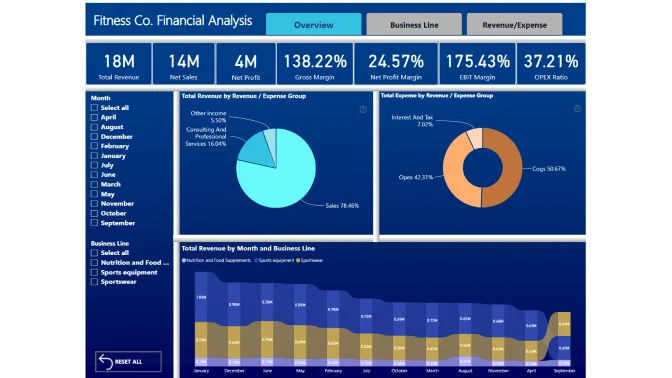
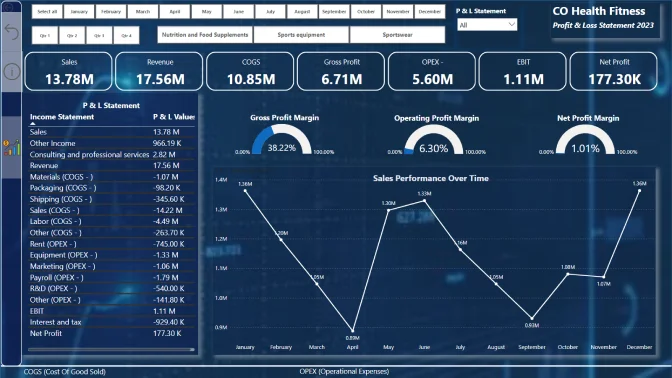
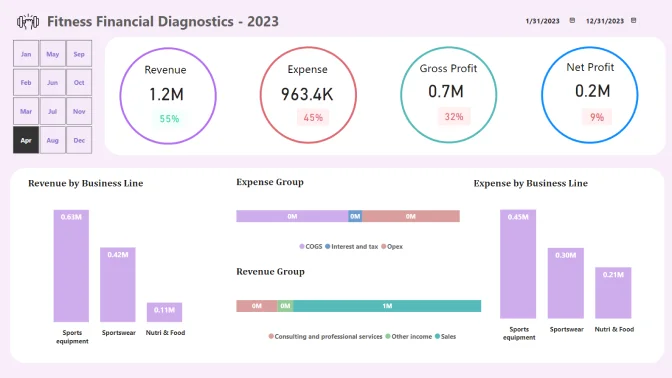
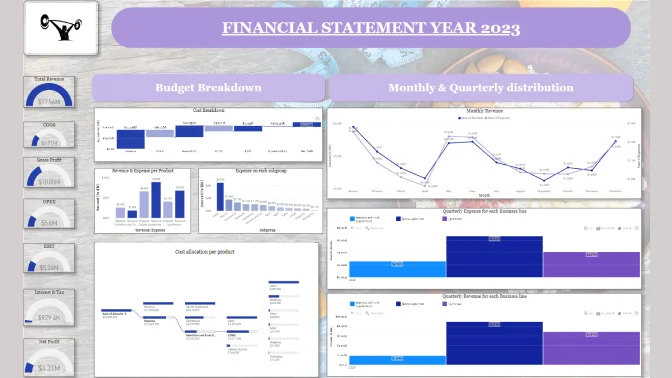
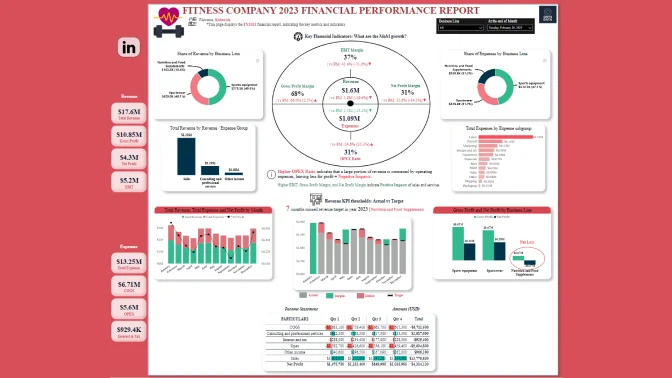
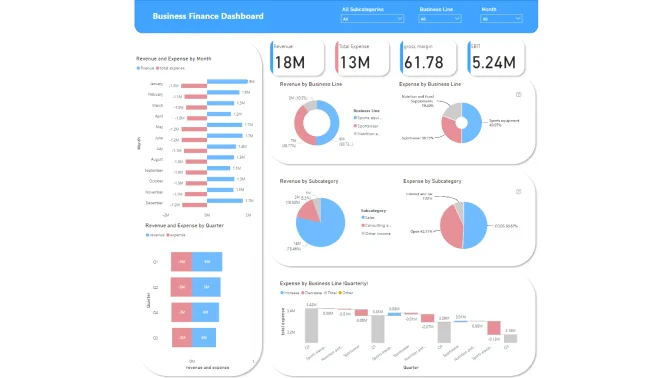
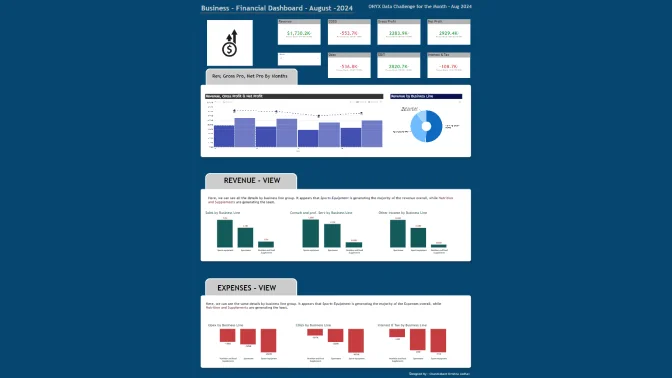
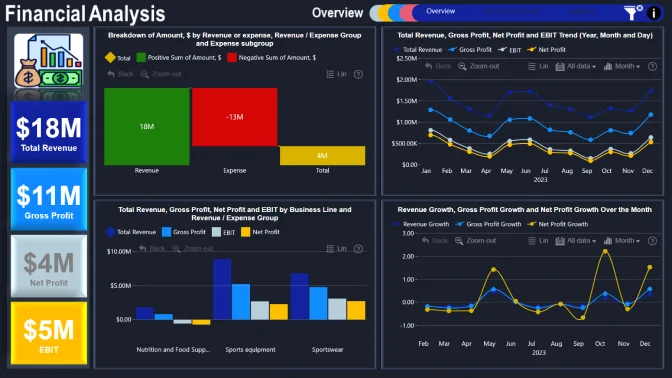
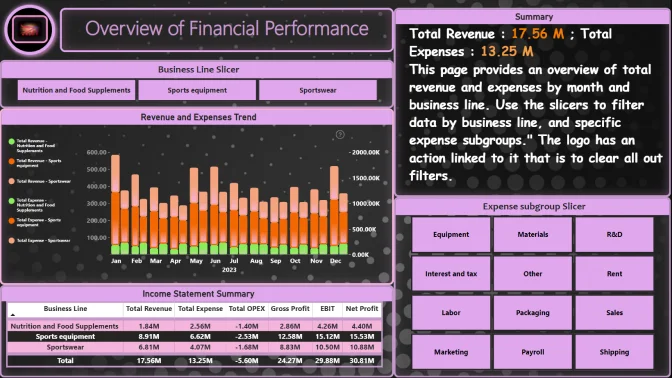
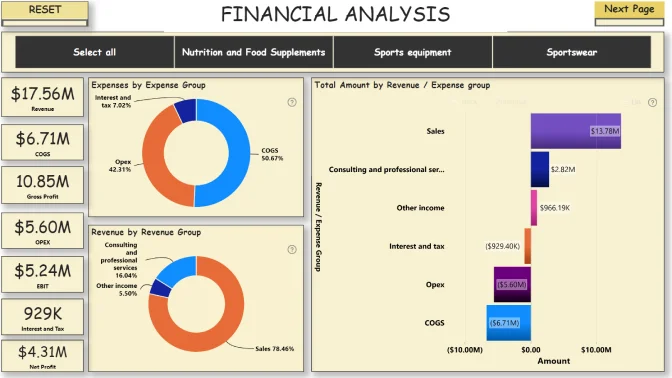
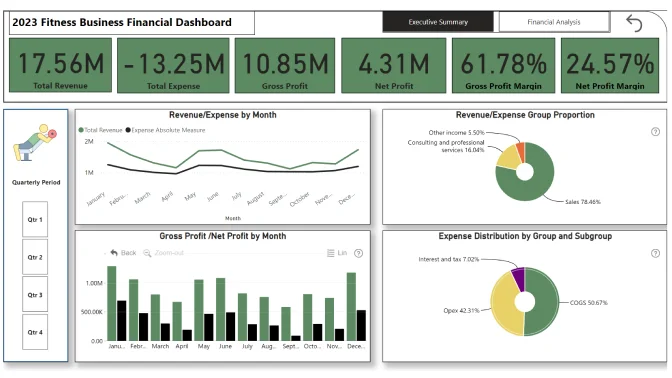
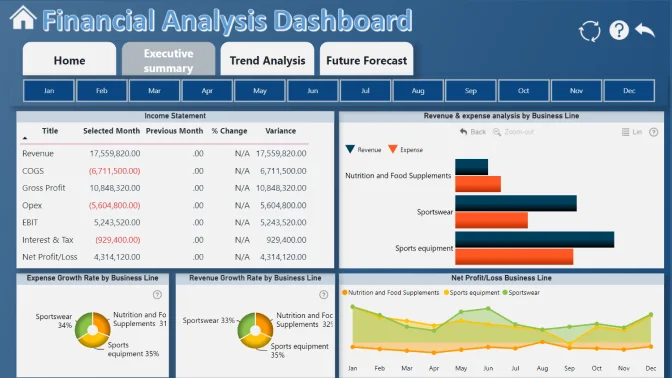
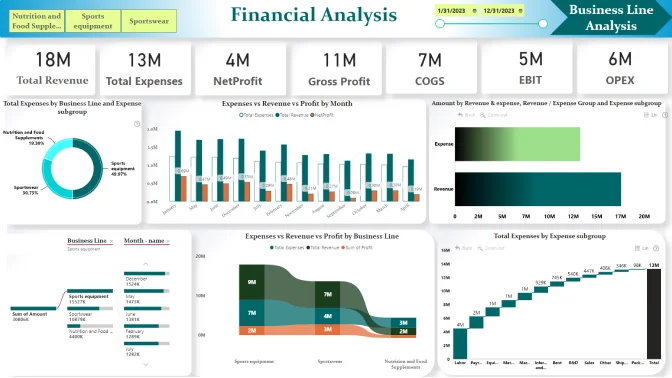
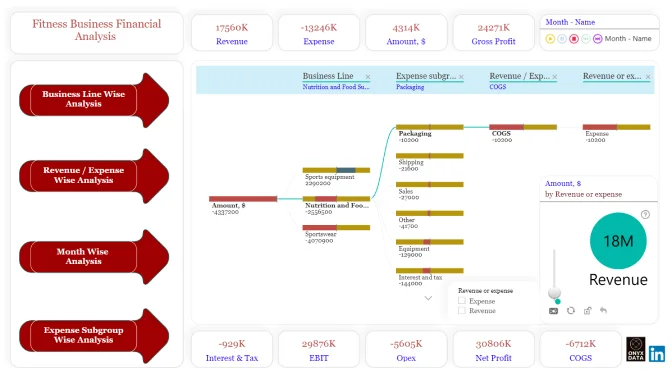
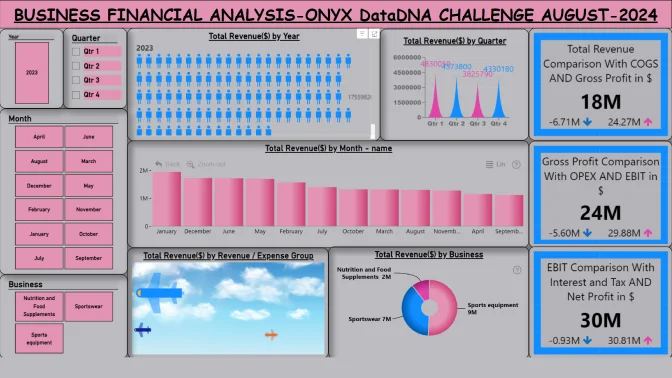
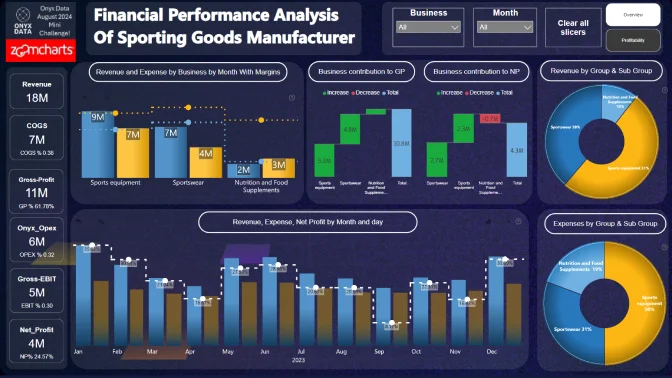
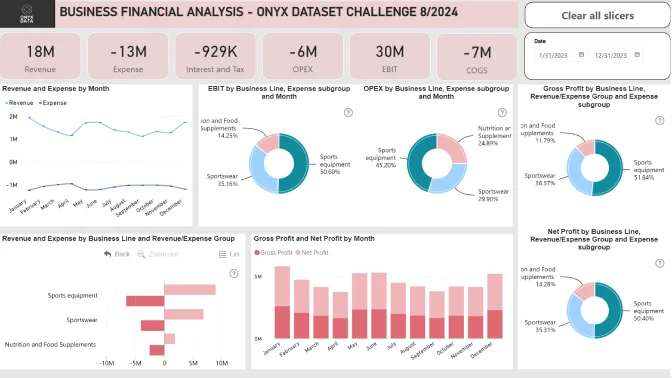
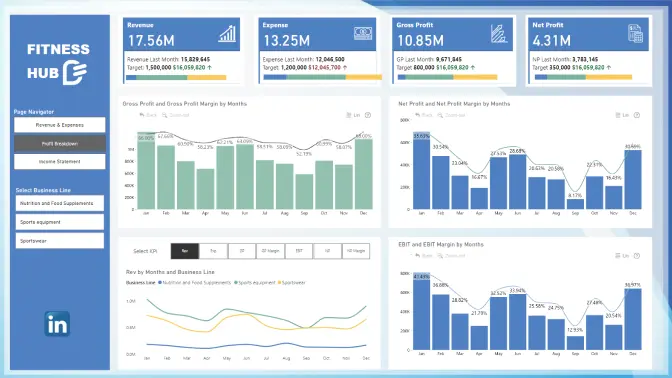
The aim of this month’s data challenge is to analyze the financial performance of a sporting goods manufacturer with three business lines: Sports Inventory, Sportswear, and Nutrition & Food Supplements. The dataset includes revenue and expense data, split by month and business line.

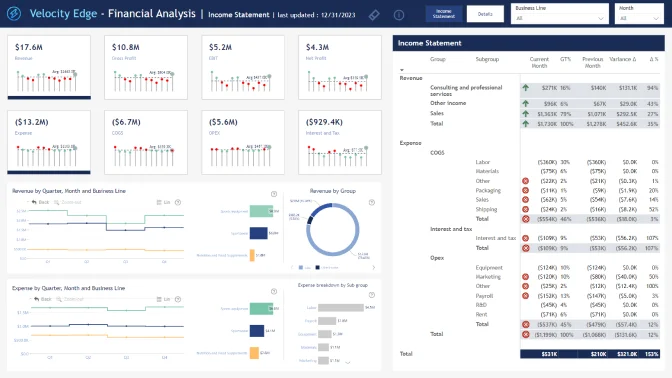
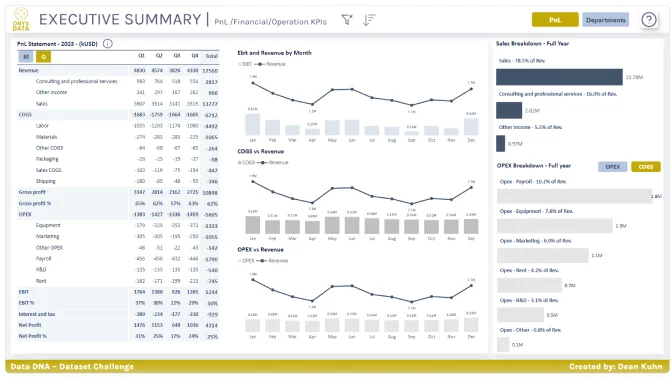
Challenge participants can calculate the income statement, gross and net profit margins, EBIT margin, and OPEX ratio, as well as compare financial indicators across business lines and perform other financial analysis.

Participants are encouraged to incorporate their own data, such as thresholds or targets, to provide additional context for the analysis.

Technical requirements

  • Build your report using only Power BI
  • The number of pages in the report is not limited
  • At least one report page has to contain a minimum of 2 ZoomCharts Drill Down Visuals. See a practical guide on Drill Down Visuals here

Judging criteria

We empower participants to build PRO reports in order to create exceptional user experiences. Drill down and filter data with ease, giving your end-users the insights they need, quickly and intuitively.

  1. How easy is it to understand the data? (max 10 points)
    • Is too much text used for explanation?
    • Are the indicative colors in charts instinctually understandable?
    • Does it tell a story?
  2. How easy-to-use is the report? (max 14 points)
    • Cross-chart filtering implementation across the report. Can other visuals provide relevant data as the user explores the report?
    • Response time
    • Drill Down: multi-layer data exploration. Can the user drill down and gain additional insights within the report?
    • Use of tutorial overlays and other elements to assist new users. Can a new user start using this report straight away with just the guidance provided within the report itself?
  3. How good is the report design and is it suitable for its purpose? (max 10 points)
    • Visual design: is the overall look consistent, no empty spaces, no overcrowding?
    • Interface design: are there unnecessary visualizations/buttons/complexity in use?
    • UX design: is the produced report usable?
    • Report design: is the main challenge answered?
    • Technical: are all the fonts used the same, are the sizes readable?

You are encouraged to use various techniques at your disposal, such as tooltips, drill-throughs, drill-downs, cross-chart filtering and page navigation features, to enhance your analysis.

Timeline

Registration Open

Registration Open

31 July | 21:00

-

Submissions Open

Submissions Open

31 July | 21:00

-

Workshop | How to Use the Waterfall Chart in Financial Analysis

Workshop | How to Use the Waterfall Chart in Financial Analysis

13 August | 10:00

-

1:1 Mentoring Sessions

1:1 Mentoring Sessions

13 August | 10:00

31 July - 23 August

Entry Submission Deadline

Entry Submission Deadline

23 August | 21:00

31 July - 23 August

Webinar | Financial Analysis in Power BI: Reviewing the Top 5

Webinar | Financial Analysis in Power BI: Reviewing the Top 5

29 August | 10:00

31 July - 23 August

Winner Announced

Winner Announced

29 August | 11:00

31 July - 23 August

Dataset

Get the dataset

See past Onyx Data August 2024 challenges

See past challenges

Your Drill Down Visuals Developers License

Use the email and password provided below to log in Power BI Desktop and access an account with a license to use all ZoomCharts Drill Down Visuals.

Upon logging in, you will need to change your password and enable two-factor authentication. If you encounter any problems, feel free to reach out to us via chat.

*This Developer License can be used to create a report for this ZoomCharts Mini Challenge or for your personal training purposes. Commercial use of this license is prohibited.

Upload failed
Attach file
File requirements: 16MB

Any questions? Feel free to use chat!

Are you sure you want to delete the report?

Activate your Drill Down visuals Developer License!

You can use these credential to access ZoomCharts visuals and create your report for this ZoomCharts Mini Challenge, or for your personal training purposes.


logo
[email protected]
+44 204 577 3993
logo

Products

Drill Down Network PRO Drill Down Waterfall PRO Drill Down Graph PRO Drill Down Combo PRO Drill Down Combo Bar PRO Drill Down Donut PRO Drill Down Pie PRO Drill Down TimeSeries PRO Drill Down Timeline PRO Drill Down Map PRO Drill Down Scatter PRO All Visuals

Resources

Report Examples Webinars Blog ZoomCharts Academy Visuals Gallery Documentation Custom Visual Development Subscribe to News

Solutions

Custom Visual Development

Company

Pricing About Us Partners Leave feedback Join PowerGroup EU Funding

Help

ZoomCharts Assistance Contact Sales Contact Support FAQ

Drill Down Network PRO Drill Down Waterfall PRO Drill Down Graph PRO Drill Down Combo PRO Drill Down Combo Bar PRO Drill Down Donut PRO Drill Down Pie PRO Drill Down TimeSeries PRO Drill Down Timeline PRO Drill Down Map PRO Drill Down Scatter PRO All Visuals

Report Examples Webinars Blog ZoomCharts Academy Visuals Gallery Documentation Custom Visual Development Subscribe to News

Custom Visual Development

Pricing About Us Partners Leave feedback Join PowerGroup EU Funding

ZoomCharts Assistance Contact Sales Contact Support FAQ
+44 204 577 3993
[email protected]

Ready to get in touch?

Contact our experts with any question about Power BI and ZoomCharts for Free!

Contact us

© 2025, Data Visualization Software Lab

U.S. Patents No. 11,645,343; 11,921,804

Cookies Policy
Manage cookies
Privacy Policy
Global
EULA
Patent
warning

Error message

success

Success info: Done!

ZoomCharts AI Assistant

We noticed you're using an old OS version.

For the best experience, we recommend upgrading to ensure that all website features display correctly.

Cookie settings

We use necessary cookies for site functionality, as well as statistic, marketing, and preference cookies to enhance your experience. For more information and to manage your preferences, please visit our Cookie policy