3127
Power BI Finance Dashboard Template
Power BI Finance Dashboard Template
More Report pages
Report Author: Chiemezuo Ngerem
3127
Share template with others
Summary
This Power BI financial analysis dashboard provides a comprehensive overview of the financial performance of a fitness and sporting goods company. It enables users to monitor key financial metrics, analyze profitability, and evaluate business performance across multiple product lines.
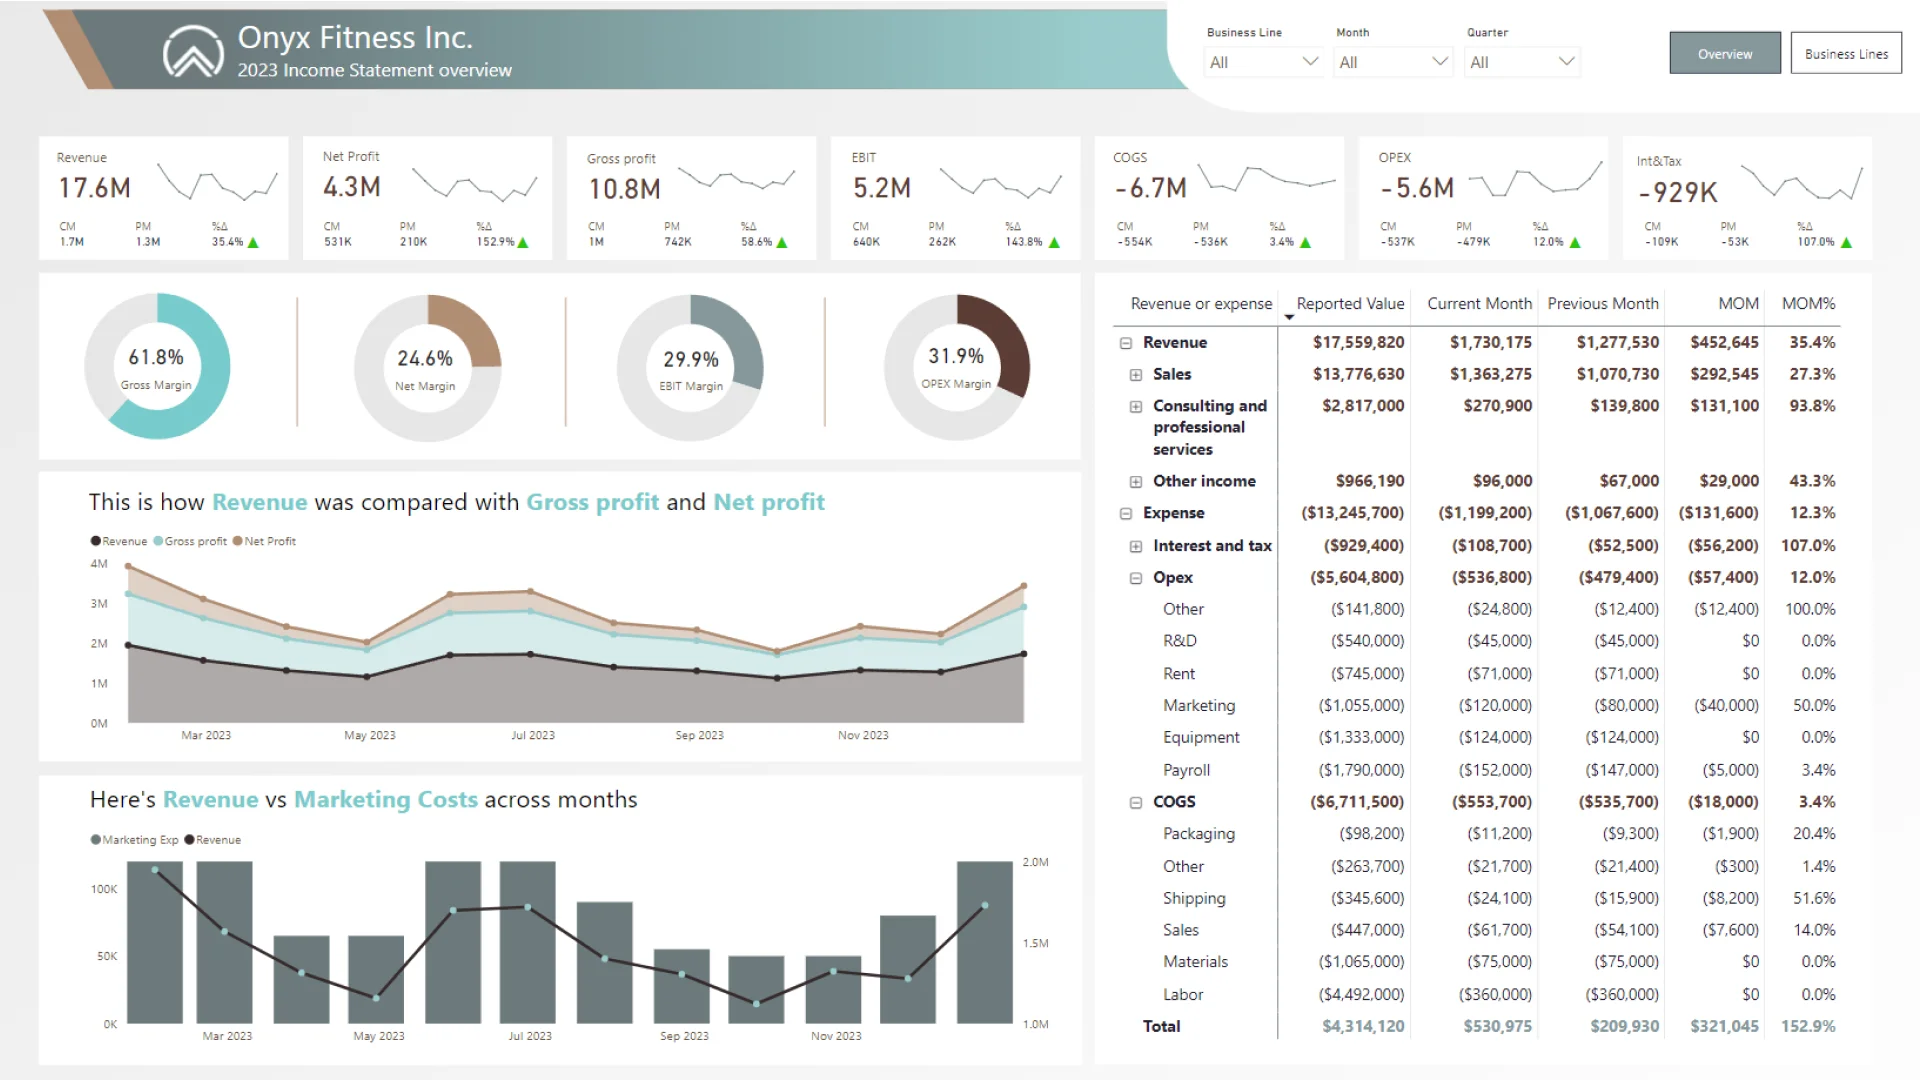
The dashboard presents core financial KPIs including revenue, gross profit, net profit, EBIT, COGS, OPEX, interest and tax, along with margin indicators, giving users a clear picture of the company's financial health.
Key Insights of Power BI Financial Analysis Dashboard
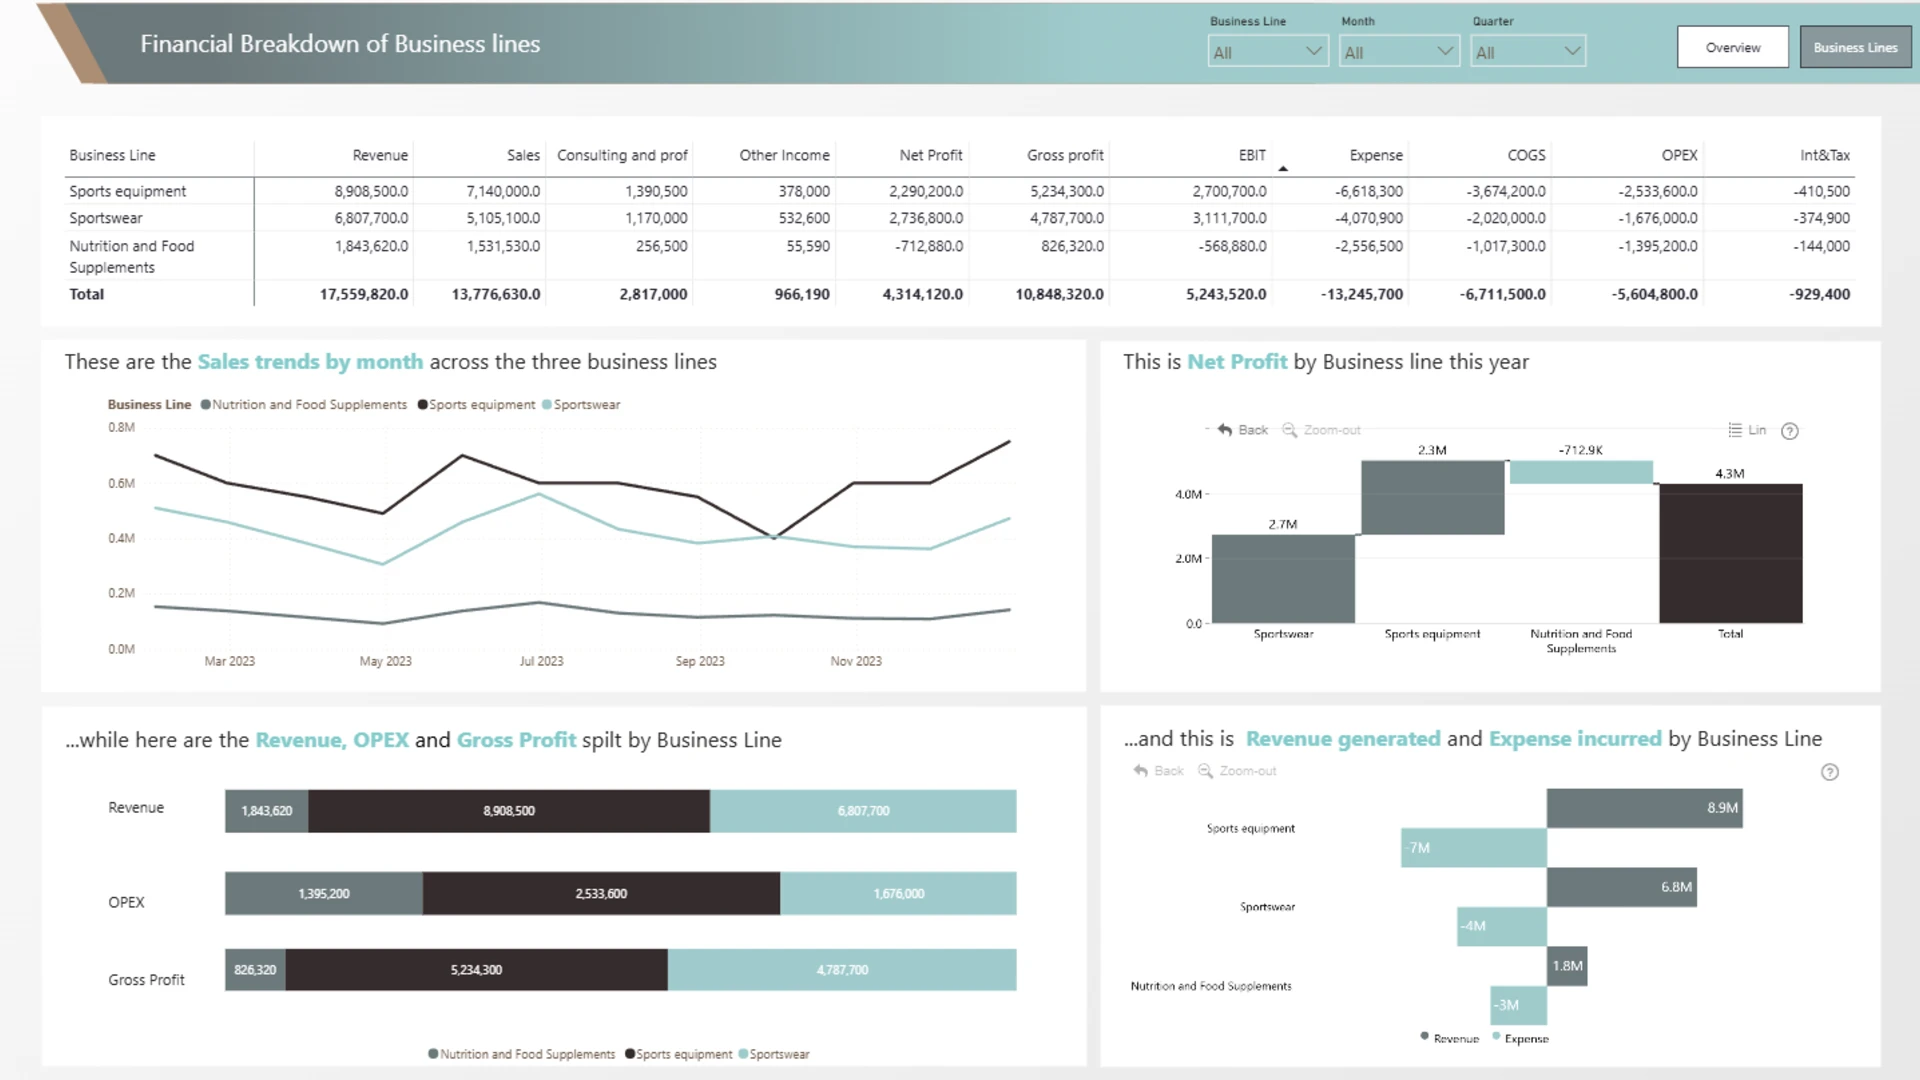
The report is structured across two main views: an income statement overview and a business line analysis. The overview page highlights key financial KPIs, margin metrics, monthly trends, and a detailed income statement, while the business line page compares the performance of sports equipment, sportswear, and nutrition and food supplements.
Some of the main insights include:
- Revenue, gross profit, net profit, EBIT, COGS, OPEX, interest, and tax analysis
- Gross margin, net margin, EBIT margin, and OPEX margin
- Month-over-month financial performance trends
- Revenue, gross profit, and net profit comparison over time
- Revenue versus marketing costs by month
- Sales performance across business lines
- Net profit contribution by each business line
- Revenue, operating expenses, gross profit, and expense distribution by business line
With a clean layout and interactive visuals, this Power BI financial analysis dashboard makes it easy to understand how revenue, costs, and profitability evolve over time. Users can quickly identify the strongest-performing business lines and explore the factors driving overall financial results.
How to Use This Power BI Financial Analysis Dashboard
To interact with this Power BI finance dashboard, click on any active chart element or use the available filters to analyze data by business line, month, or quarter.
Download the .pbix file to explore the report's data model, calculations, and visual configurations. You can also adapt the report to analyze your own financial data and build similar income statement and profitability dashboards.


4U Report Challenges
Participate in data challenges, build and submit reports to get free template downloads.
Join CommunityMobile view allows you to interact with the report. To Download the template please switch to desktop view.



How to use a PBIX template
Preview the interactive report, download the PBIX file, open it in Power BI Desktop, and replace the same data connection with your own dataset.
Preview and download
Explore the report online and download the PBIX template file.
Open in Power BI Desktop
Open the downloaded PBIX file in Power BI Desktop.
Connect your data
Replace the sample data source with your own dataset.
Refresh and adjust
Refresh the model and update fields or visual were needed.
Save and share
Save your report and publish it for your audience.


