643
Financial Performance Analysis of a Sporting Goods Manufacturer
Financial Performance Analysis of a Sporting Goods Manufacturer
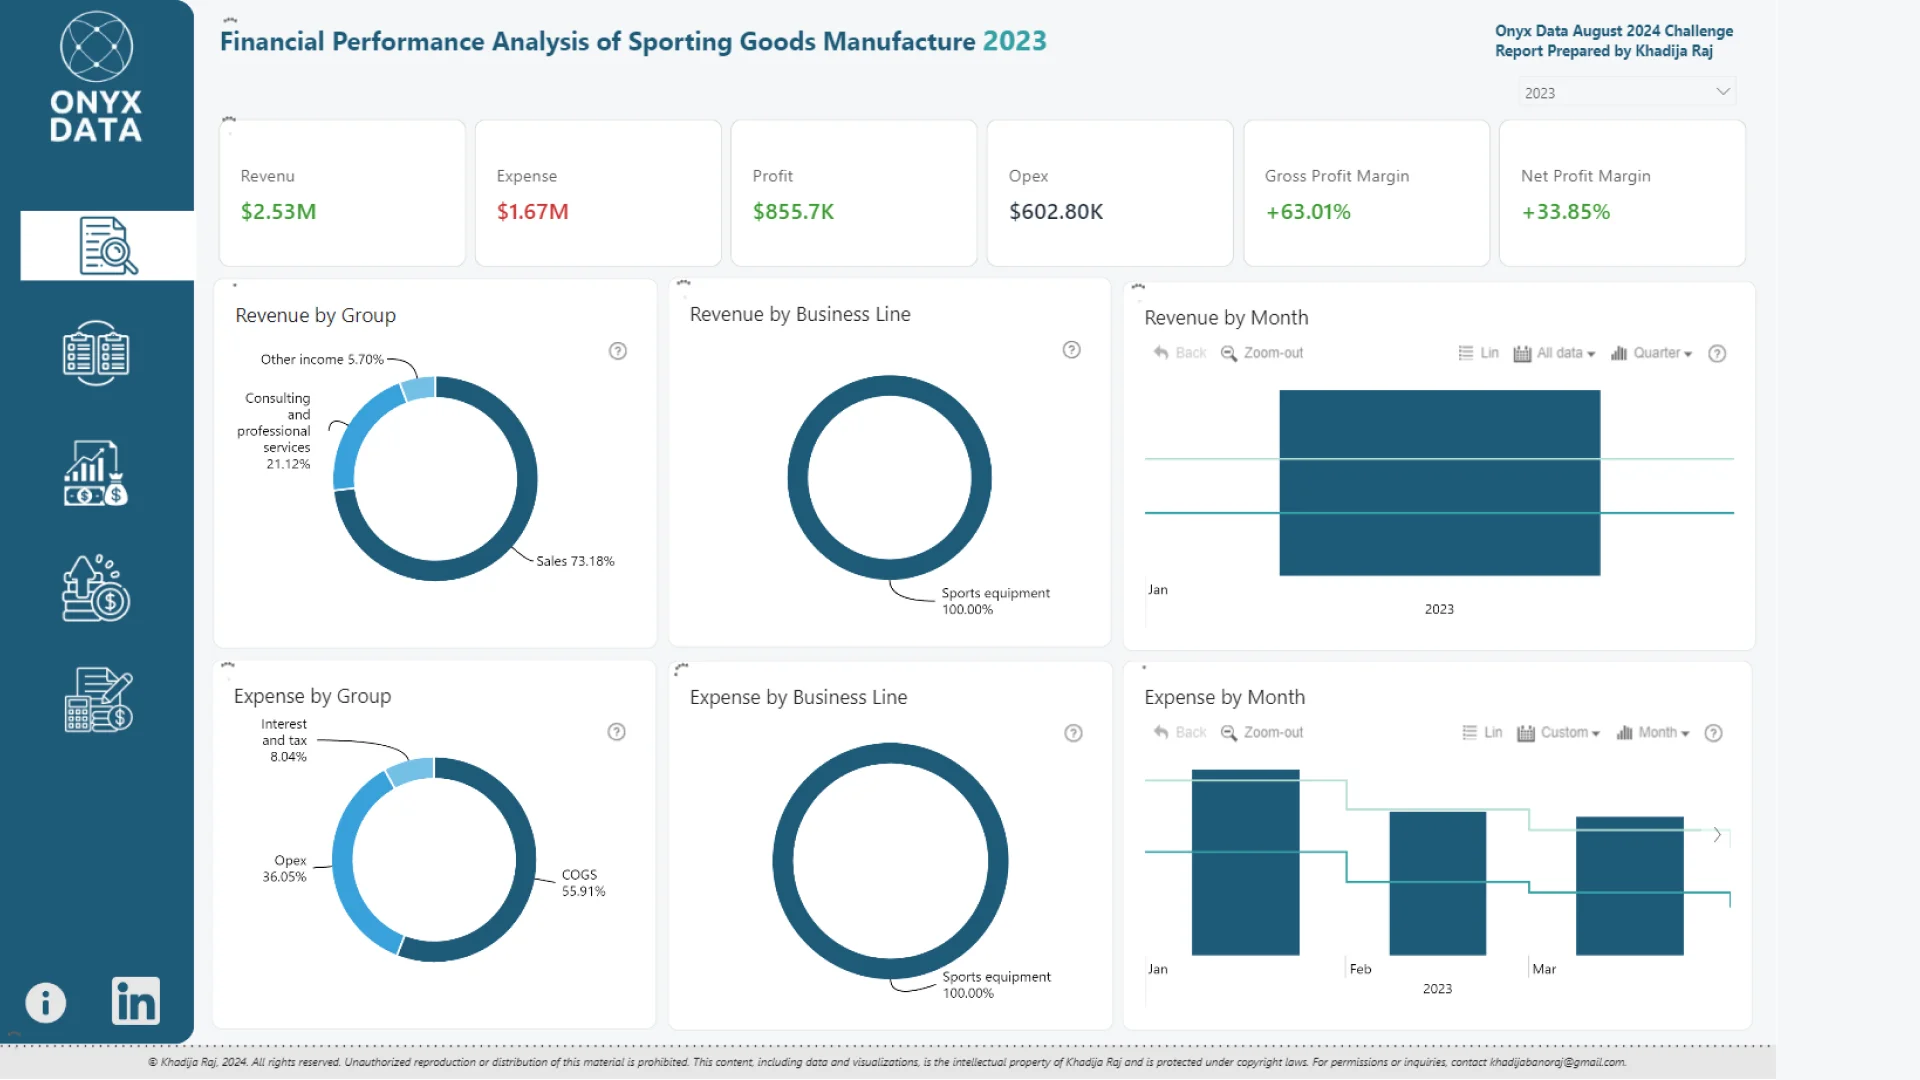
Report Author: Khadija Raj
643
Share template with others
Report submitted for Onyx Data DataDNA ZoomCharts Mini Challenge, August 2024. The report was built based on Fitness Company Finance Dataset and includes ZoomCharts custom Drill Down PRO visuals for Power BI.
Author's description:
The dashboard analyzes the financial performance of a sporting goods manufacturer across three business lines: Sports Equipment, Sportswear, and Nutrition & Food Supplements. It focuses on key financial metrics, including revenue, expenses, gross profit, operating profit, and net profit margins. The report provides insights into each business line's profitability, cost management, and overall financial health, comparing current and prior months to highlight trends and variances. The goal is to identify which areas are performing well and which need improvement to optimize financial outcomes.
4U Report Challenges
Participate in data challenges, build and submit reports to get free template downloads.
Join CommunityMobile view allows you to interact with the report. To Download the template please switch to desktop view.
Was this helpful? Thank you for your feedback!
Sorry about that.
How can we improve it?