logo
For Power BI
  • Products
    • Drill Down Donut Pro Drill Down Donut PRO
    • Drill Down Pie Pro Drill Down Pie PRO
    • Drill TimeSeries Pro Drill Down TimeSeries PRO
    • Drill Combo Pro Drill Down Combo PRO
    • Drill Map Pro Drill Down Map PRO
    • Drill Scatter Pro Drill Down Scatter PRO
    • Drill Down Network Pro Drill Down Network PRO
    • Drill Down Waterfall Pro Drill Down Waterfall PRO
    • Drill Down Graph Pro Drill Down Graph PRO
    • Drill Down Timeline Pro Drill Down Timeline PRO
    • Drill Down Combo Bar PRO Drill Down Combo Bar PRO
    • Drill Down Line PRO Drill Down Line PRO

    Video tutorials

    Watch Now

    More than 90 videos on how to enhance Power BI with ZoomCharts

    Learn more
    All visuals
  • Resources

      Resources

    • Documentation
    • Report Examples
    • Blog
    • Webinars
    • Video Tutorials
    • Visuals Gallery

    Support

    • ZoomCharts Assistance
    • Contact Sales
    • Contact Support
    • FAQ

    Challenges

    Challenges

    Improve your report creation skills by participating in free challenges for report creators.

    Learn more
    Start trial
  • Services
    • Power BI Report Development
    • Custom Visual Development
  • Challenges
  • Pricing
Request a quote Start Free Book a Demo Sign in
Get it now
Go back

Contents

Go back

Jun 26, 2025

How to Add a Slicer in Power BI: Standard vs ZoomCharts Approach

Power BI is a powerful tool for visualizing data, but how you interact with that data can make all the difference. One of the most fundamental ways to control what data you see is by using a slicer. In this article, we’ll walk through how to add a slicer in Power BI using the standard method and compare it with the more dynamic ZoomCharts visuals, which take data exploration to the next level.
Title image
Title image

Power BI is a powerful tool for visualizing data, but how you interact with that data can make all the difference. One of the most fundamental ways to control what data you see is by using a slicer. In this article, we’ll walk through how to add a slicer in Power BI using the standard method and compare it with the more dynamic ZoomCharts visuals, which take data exploration to the next level.

Contents

Share this article

What Is a Slicer in Power BI?

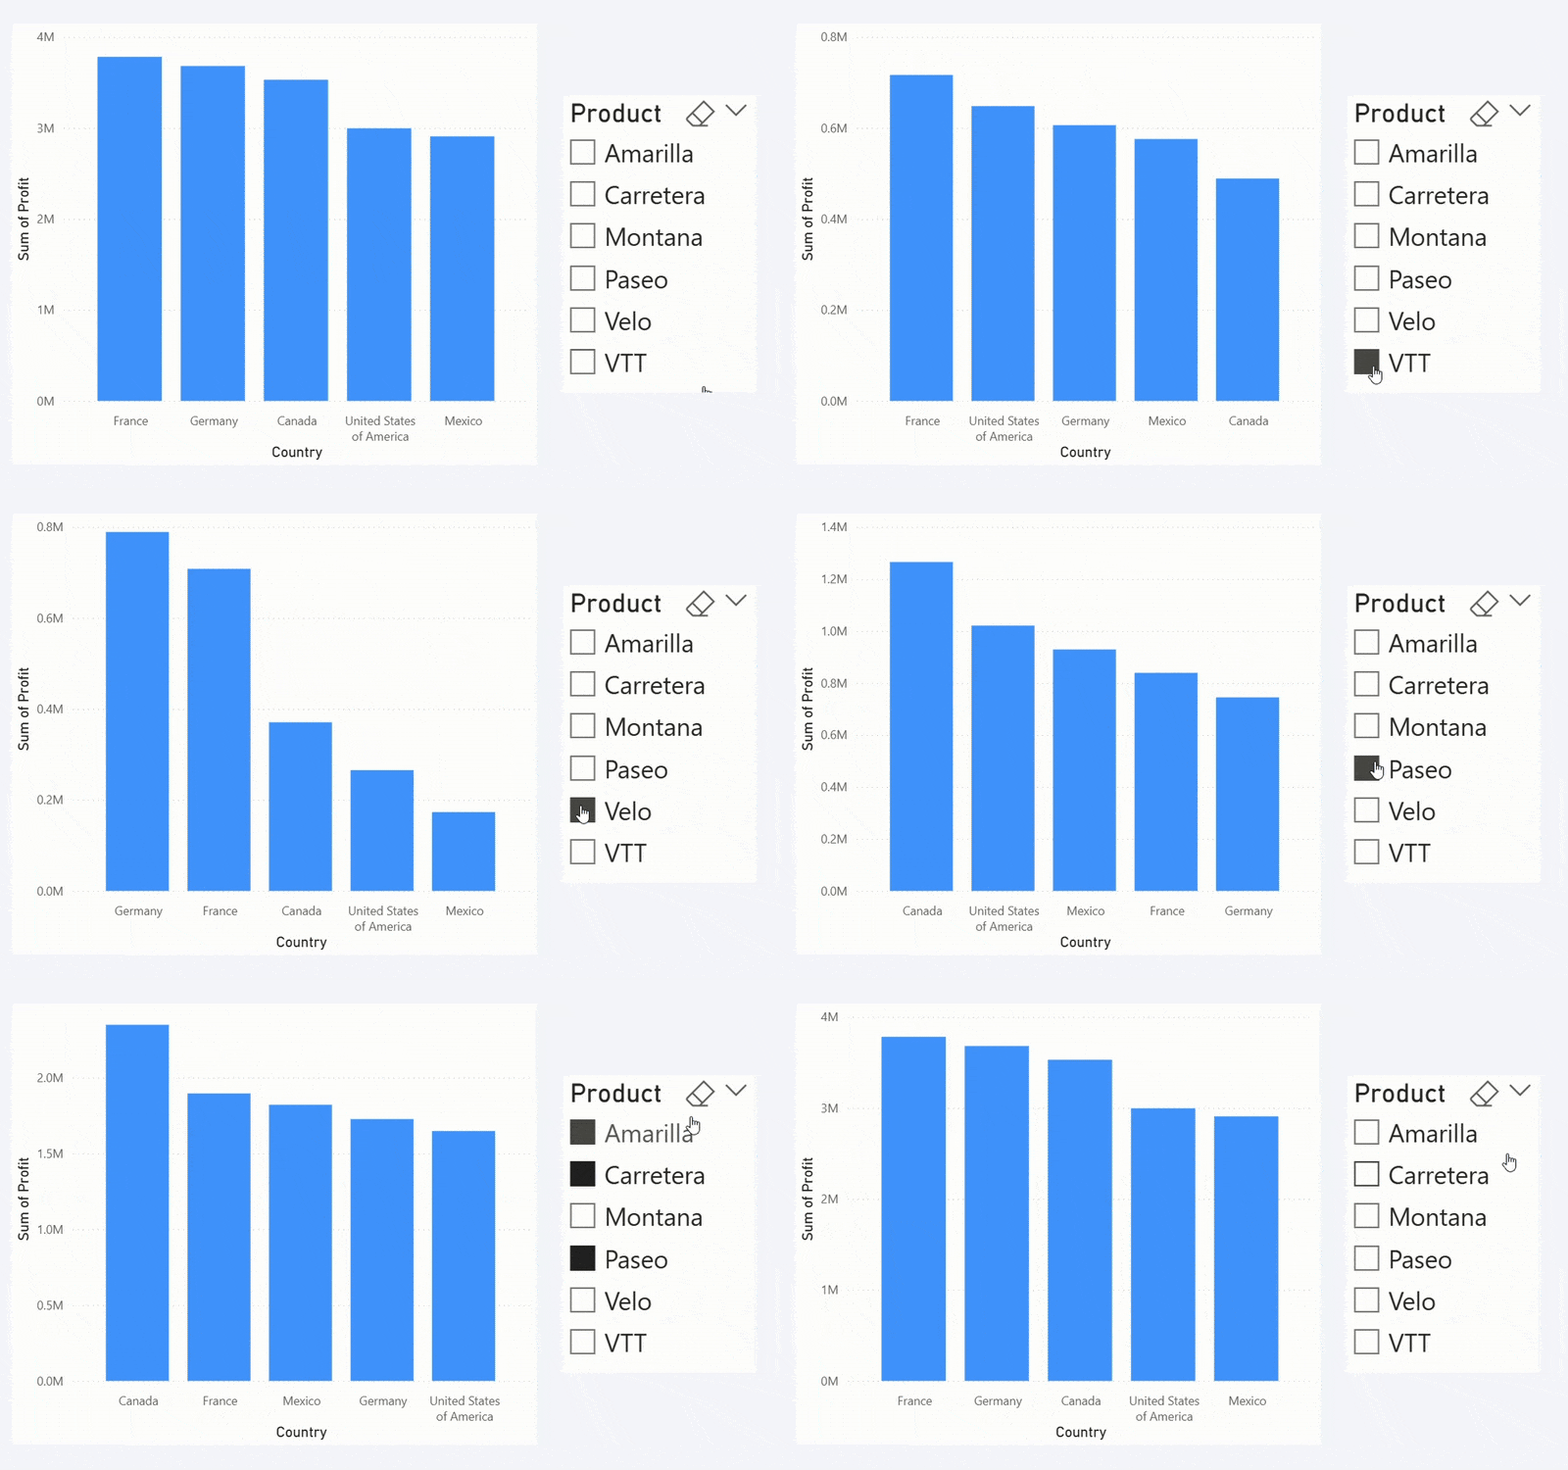
A slicer is a visual filter that allows users to segment and focus on a subset of data within Power BI reports. It’s commonly used for time frames, categories, regions, and other dimensional data. Usually, slicers are displayed as checklists, drop-down menus or similar elements on the report - they list the available categories and instantly apply a filter when the user selects one or multiple categories.

Why Slicers Matter

Slicers simplify complex datasets by letting you focus on the most relevant data. Whether you're looking at quarterly sales performance or isolating metrics for a single department, slicers make it easier to gain insights quickly. 

Method 1: Adding a Standard Slicer in Power BI
Power BI Default Slicers

Step-by-Step Guide

  1. Go to the Visualizations pane and select Slicer from the list of visuals.
  2. Drag a field into the slicer visual. For example, if you have a column with product names, the slicer will display each product as an option.
  3. Customize the slicer using the Format Visual tab - choose between list, dropdown, or button layout, customize fonts, borders and other options.
  4. Interact with your report! When the user selects an option in the slicer, all related visuals on the report will filter data to that category.

Pros and Cons

  • Pros: Easy implementation, native to Power BI, familiar to most users, compact.
  • Cons: Limited interactivity and contextual filtering. Switching between multiple slicers can become clunky in more advanced reports. 

Method 2: Using ZoomCharts Custom Visuals for Slicing
Interactive Power BI cross-filtering with ZoomCharts visuals

What are ZoomCharts Visuals?

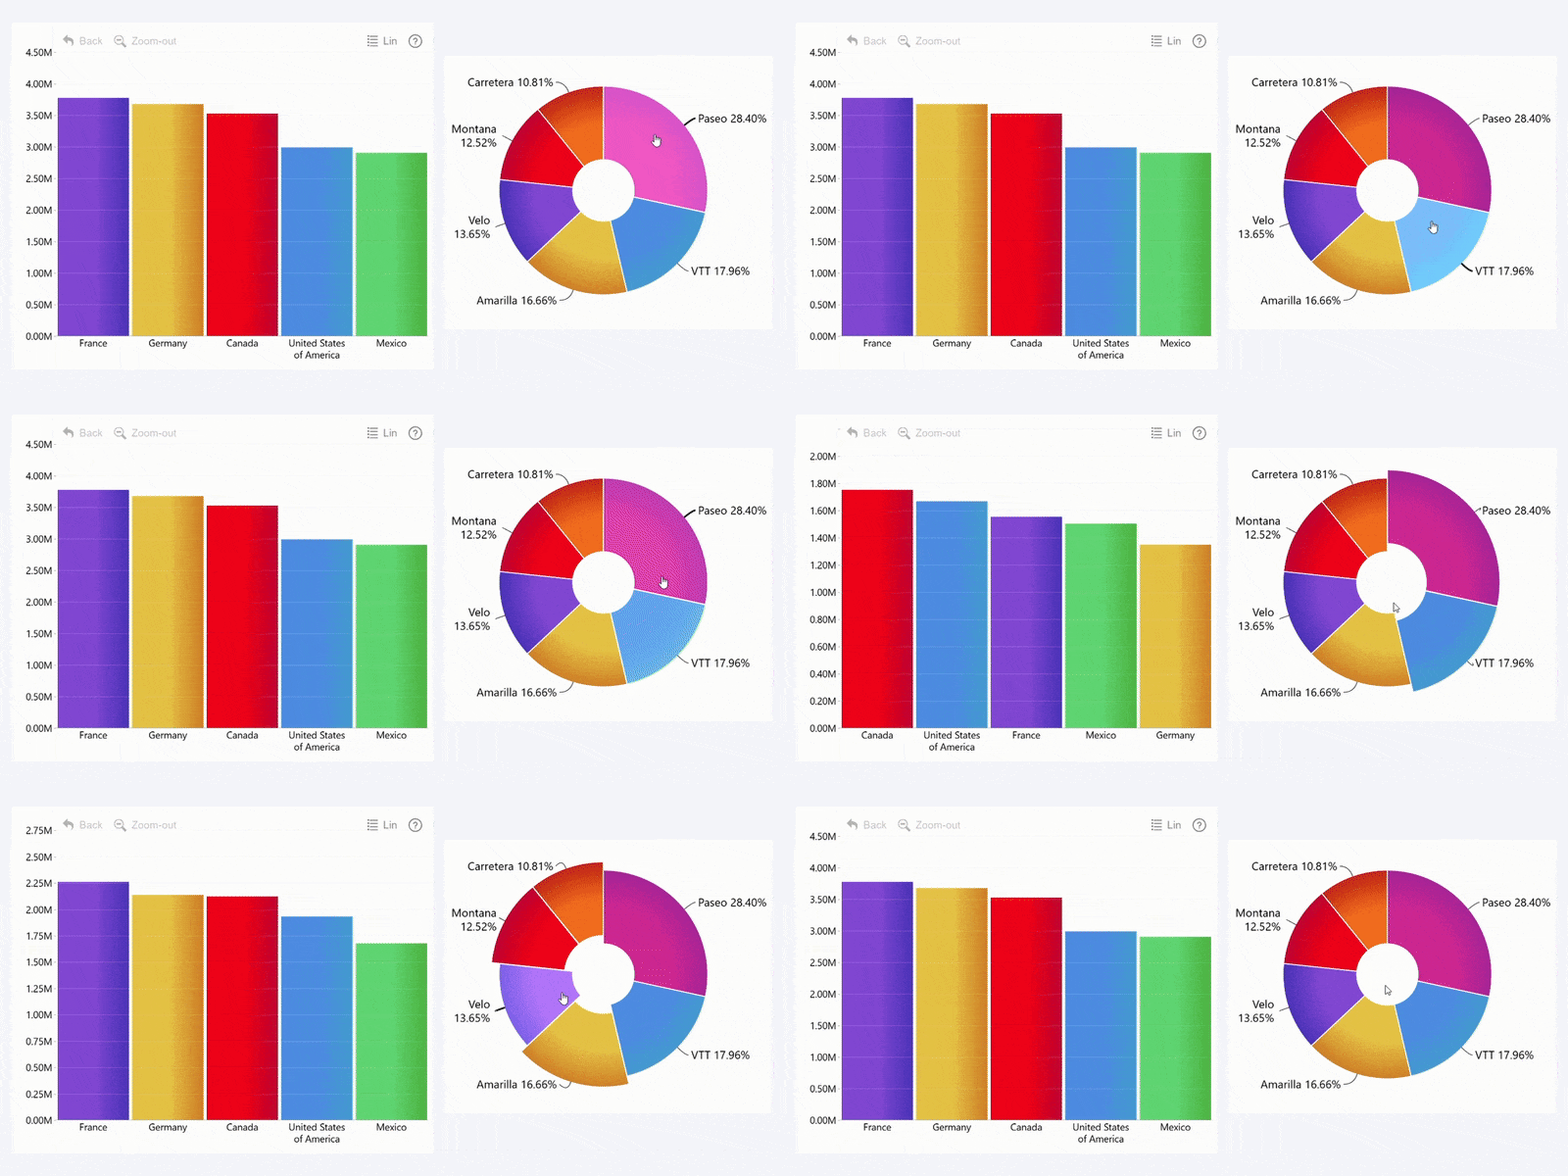
ZoomCharts offers a suite of custom Power BI visuals like Drill Down Donut, Combo, Timeline, Graph and others that are designed not just for data visualization, but also exploration. These visuals allow users to instantly drill down and filter with just a click and instantly cross-filter to analyze data from multiple dimensions.

Step-by-Step Guide

  1. Install ZoomCharts Visuals from AppSource and add them to your report. 
  2. Add your desired fields to the visual - for example, 'Product' and 'Sales'.
  3. Enable cross-filtering: make sure that the "Use as Filter" toggle is enabled in the visual's settings.
  4. Interact with the visual: when you select data in one chart, the other visuals will instantly get filtered to provide relevant insights.

Benefits of This Method

  • Intuitive Filtering: Make the reports feel more responsive and dynamic to the user, and see the full picture from multiple perspectives.
  • Multi-Dimensional Drill Down: Explore deeper levels of data without changing pages.
  • Better insights: Instead of a static list of categories, the user can see them displayed as pie charts, map charts, columns or other intuitive visualizations.

When to Use Each Method

  • Use slicers when your report needs a simple list of filtering options in a compact, discreet package that's familiar to most users.
  • Use ZoomCharts Visuals when you want to create dynamic and interactive reports and analyze the same data across multiple dimensions for fully informed insights.

Final Thoughts

Knowing how to add a slicer in Power BI is crucial for building interactive reports. While the standard method offers simplicity, ZoomCharts custom visuals bring a whole new level of interactivity and speed, making it easier to uncover deeper insights faster.

Ready to elevate your Power BI experience? Try ZoomCharts custom visuals today and see the difference.

Start Free 30-Day Trial

FAQ

Can I use ZoomCharts visuals alongside standard slicers?

Yes, ZoomCharts visuals are fully compatible with Power BI slicers, allowing for a hybrid approach. In fact, you can use both on the same report to create seamless filtering and navigation experience for the users.

Do ZoomCharts visuals require coding?

No. ZoomCharts visuals for Power BI are plug-and-play and they will seamlessly work with your existing Power BI reports. All setup and configuration is done in the built-in Format Visual pane, so if you know how to use Power BI, you know how to use ZoomCharts as well.

Do ZoomCharts visuals support mobile reports?

Absolutely - ZoomCharts visuals are designed ground-up to provide excellent user experience both on PCs and multi-touch devices. 

envelope icon

Want more info like this?

Subscribe to our newsletter and be the first to read our latest articles and expert data visualization tips!

Find out more

Nov 30, 2022

Blog Thumbnail
Guides

How to Make Power BI Network Charts Step-By-Step

Here’s the thing about Power BI network charts – they aren’t as difficult to make as they might look. You just need the right tools and creating interactive and fully featured network graph visualizations will become a breeze. In this blog post, we share some tips and tricks for Power BI network charts and go through the most popular use cases for this kind of visual.  

Nov 07, 2022

Blog Thumbnail
Guides

Using Power BI Conditional Formatting in ZoomCharts Drill Down Visuals

When you’re creating reports in Power BI, conditional formatting is one of the most powerful tools for data storytelling. Color is one of the main factors in visual salience, and you can use it to make your reports give a lot of information to the viewer with just a quick glance.

Oct 18, 2022

Blog Thumbnail
Guides

Create a Power BI Org Chart & More with Drill Down Graph PRO

Drill Down Graph PRO is one of our most advanced data visualization tools, and in this article, we will explore the many ways you can use it in your Power BI reports, including org charts, AML graphs and more. Furthermore, we will go through some tips & tricks on how to create graphs in Power BI with this powerful visual.

Jun 12, 2022

Blog Thumbnail
Guides

Power BI Waterfall Charts: A Detailed Guide

Do you know how to make a waterfall chart? Here are 7 tips you should know when building user friendly Power BI waterfall charts. Customize it to tell a data story that helps you make data driven decisions. Bar and column charts work great for visualizing a beginning and ending value. However, these charts fail to display the full data story by leaving out all the unique factors that contribute to a final net value. In this article, we will look at the basics of waterfall charts and what practices you can implement to build the best waterfall charts in Power BI.

Jul 01, 2022

Blog Thumbnail
Use cases

Microsoft Integrates ZoomCharts in Dynamics 365 Supply Chain Insights

We are excited to announce the collaboration between Microsoft’s latest product – Dynamics 365 Supply Chain Insights – and technologies provided by ZoomCharts – the Network and Map visuals.

Feb 14, 2022

Blog Thumbnail
Guides

Everything You Need To Know About Power BI Bar Charts

Power BI bar charts are a simple and efficient way to show category-based data. Almost everyone has used a bar chart, which is why they've remained incredibly popular through the years. In this article, we will explore the many ways you can make Power BI bar charts even more powerful and use them to the max.
  • «
  • 1
  • ...
  • 5
  • 6
  • 7
  • 8
  • 9
  • 10
  • 11
  • »

Contents

Share this article

Want more info like this?

Subscribe to our newsletter and be the first to read our latest articles and expert data visualization tips!


Thank you!

Check your inbox to verify your email address.

logo
[email protected]
+44 204 577 3993
logo

Products

Drill Down Network PRO Drill Down Waterfall PRO Drill Down Graph PRO Drill Down Combo PRO Drill Down Combo Bar PRO Drill Down Donut PRO Drill Down Pie PRO Drill Down TimeSeries PRO Drill Down Timeline PRO Drill Down Map PRO Drill Down Scatter PRO All Visuals

Resources

Report Examples Webinars Blog ZoomCharts Academy Visuals Gallery Documentation Custom Visual Development Subscribe to News

Solutions

Custom Visual Development

Company

Pricing About Us Partners Leave feedback Join PowerGroup EU Funding

Help

ZoomCharts Assistance Contact Sales Contact Support FAQ

Drill Down Network PRO Drill Down Waterfall PRO Drill Down Graph PRO Drill Down Combo PRO Drill Down Combo Bar PRO Drill Down Donut PRO Drill Down Pie PRO Drill Down TimeSeries PRO Drill Down Timeline PRO Drill Down Map PRO Drill Down Scatter PRO All Visuals

Report Examples Webinars Blog ZoomCharts Academy Visuals Gallery Documentation Custom Visual Development Subscribe to News

Custom Visual Development

Pricing About Us Partners Leave feedback Join PowerGroup EU Funding

ZoomCharts Assistance Contact Sales Contact Support FAQ
+44 204 577 3993
[email protected]

Ready to get in touch?

Contact our experts with any question about Power BI and ZoomCharts for Free!

Contact us

© 2025, Data Visualization Software Lab

U.S. Patents No. 11,645,343; 11,921,804

Cookies Policy
Manage cookies
Privacy Policy
Global
EULA
Patent
warning

Error message

success

Success info: Done!

ZoomCharts AI Assistant

We noticed you're using an old OS version.

For the best experience, we recommend upgrading to ensure that all website features display correctly.

Cookie settings

We use necessary cookies for site functionality, as well as statistic, marketing, and preference cookies to enhance your experience. For more information and to manage your preferences, please visit our Cookie policy