Jun 26, 2025
How to Add a Slicer in Power BI: Standard vs ZoomCharts Approach
Power BI is a powerful tool for visualizing data, but how you interact with that data can make all the difference. One of the most fundamental ways to control what data you see is by using a slicer. In this article, we’ll walk through how to add a slicer in Power BI using the standard method and compare it with the more dynamic ZoomCharts visuals, which take data exploration to the next level.
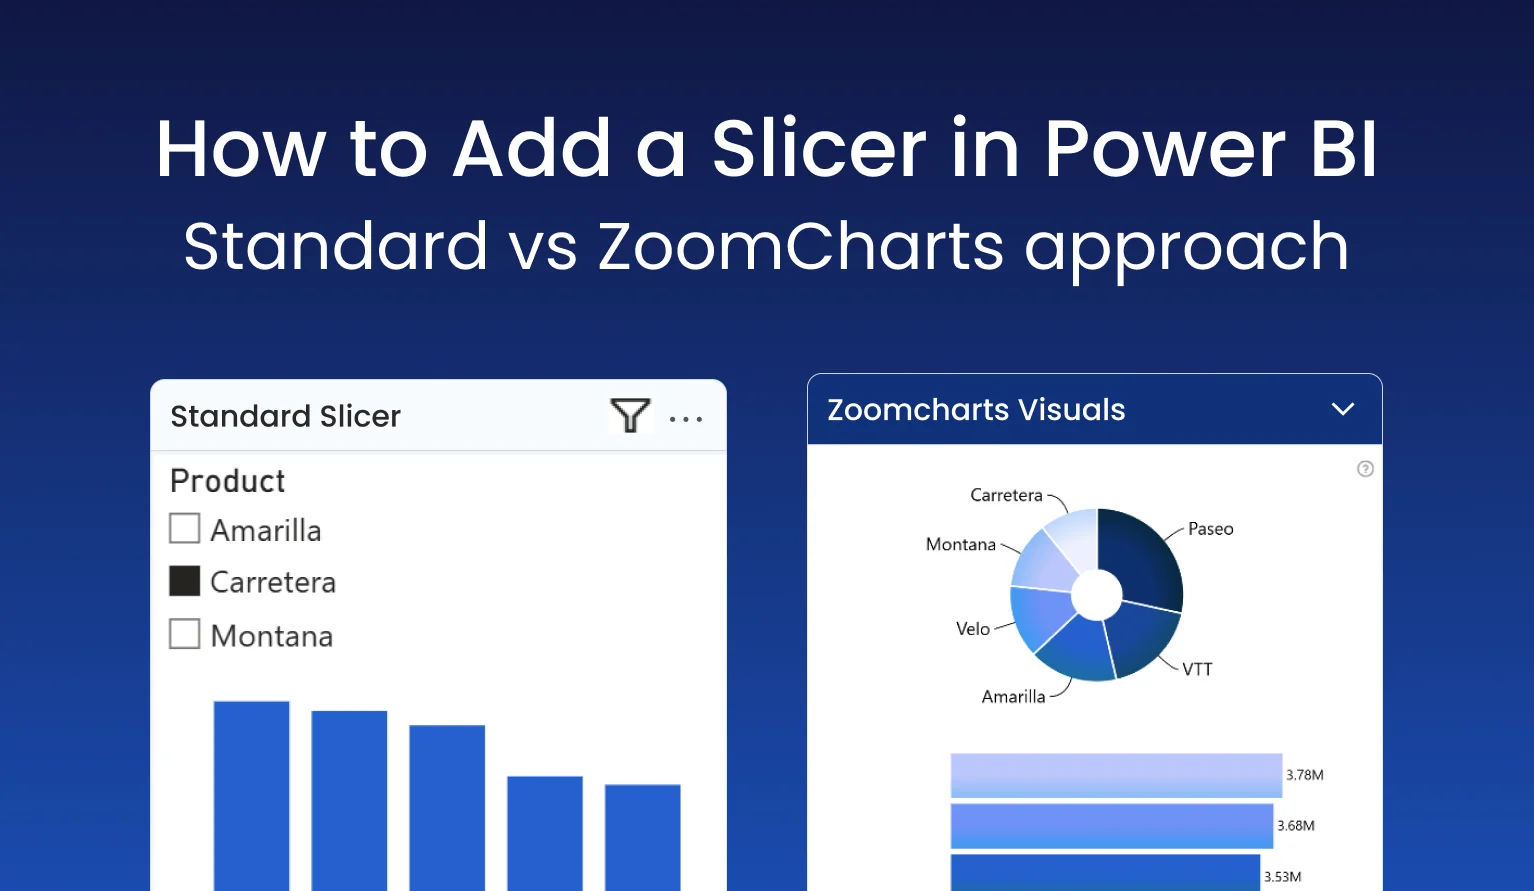

Power BI is a powerful tool for visualizing data, but how you interact with that data can make all the difference. One of the most fundamental ways to control what data you see is by using a slicer. In this article, we’ll walk through how to add a slicer in Power BI using the standard method and compare it with the more dynamic ZoomCharts visuals, which take data exploration to the next level.
What Is a Slicer in Power BI?
A slicer is a visual filter that allows users to segment and focus on a subset of data within Power BI reports. It’s commonly used for time frames, categories, regions, and other dimensional data. Usually, slicers are displayed as checklists, drop-down menus or similar elements on the report - they list the available categories and instantly apply a filter when the user selects one or multiple categories.
Why Slicers Matter
Slicers simplify complex datasets by letting you focus on the most relevant data. Whether you're looking at quarterly sales performance or isolating metrics for a single department, slicers make it easier to gain insights quickly.
Method 1: Adding a Standard Slicer in Power BI
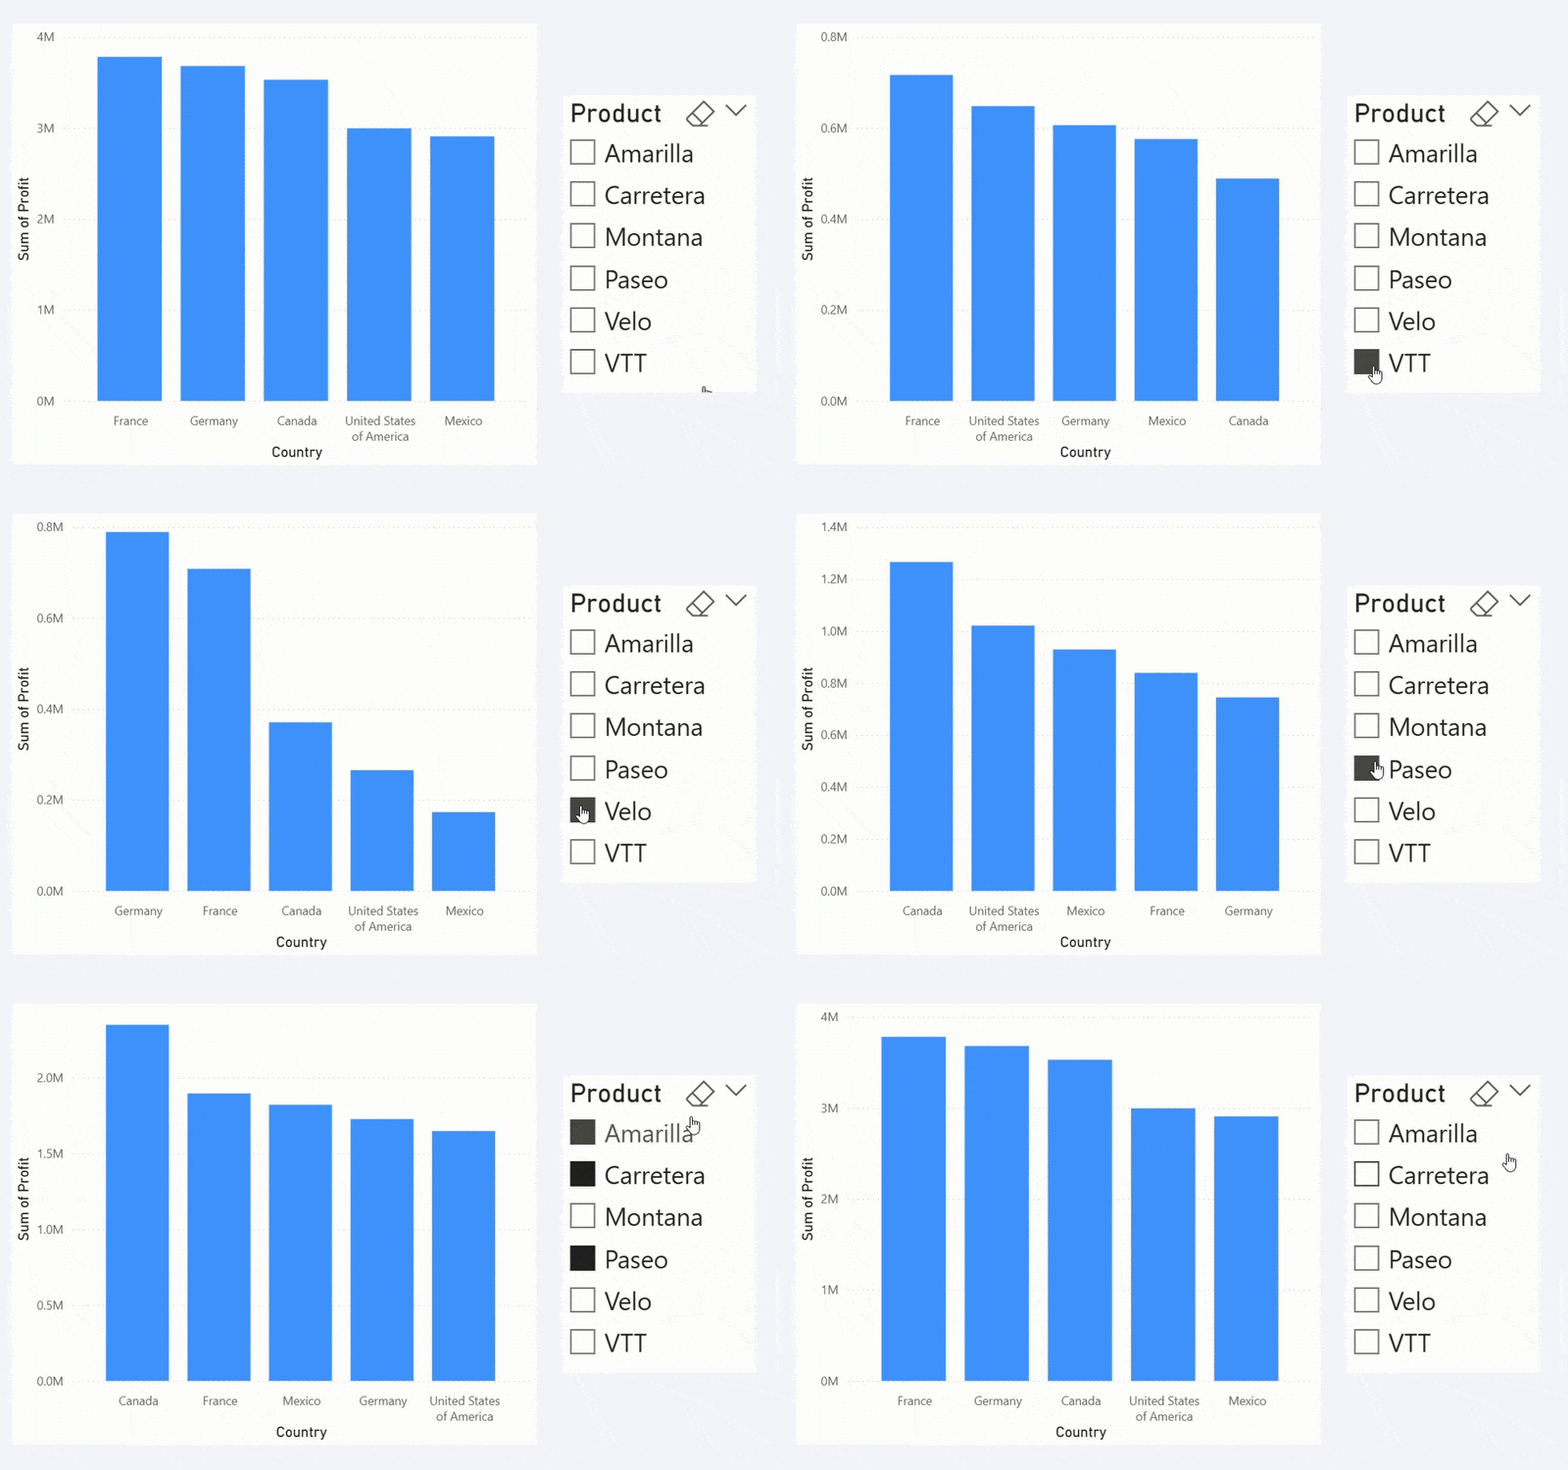
Step-by-Step Guide
- Go to the Visualizations pane and select Slicer from the list of visuals.
- Drag a field into the slicer visual. For example, if you have a column with product names, the slicer will display each product as an option.
- Customize the slicer using the Format Visual tab - choose between list, dropdown, or button layout, customize fonts, borders and other options.
- Interact with your report! When the user selects an option in the slicer, all related visuals on the report will filter data to that category.
Pros and Cons
- Pros: Easy implementation, native to Power BI, familiar to most users, compact.
- Cons: Limited interactivity and contextual filtering. Switching between multiple slicers can become clunky in more advanced reports.
Method 2: Using ZoomCharts Custom Visuals for Slicing
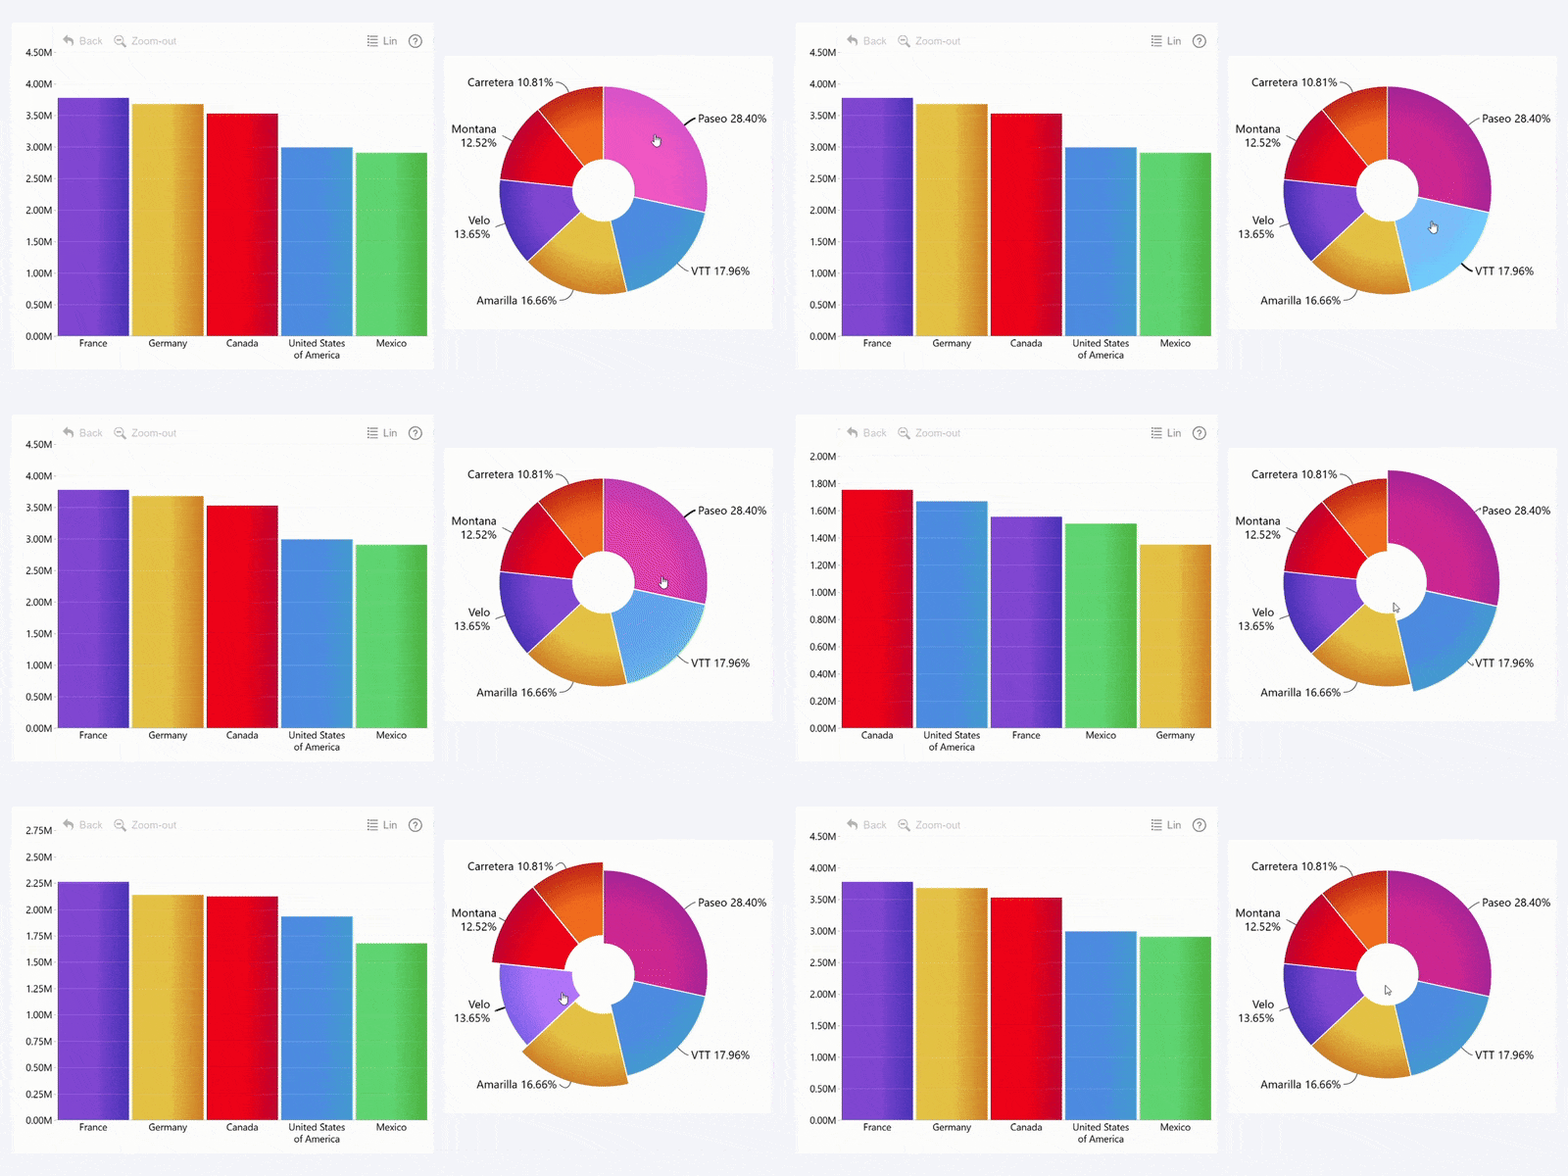
What are ZoomCharts Visuals?
ZoomCharts offers a suite of custom Power BI visuals like Drill Down Donut, Combo, Timeline, Graph and others that are designed not just for data visualization, but also exploration. These visuals allow users to instantly drill down and filter with just a click and instantly cross-filter to analyze data from multiple dimensions.
Step-by-Step Guide
- Install ZoomCharts Visuals from AppSource and add them to your report.
- Add your desired fields to the visual - for example, 'Product' and 'Sales'.
- Enable cross-filtering: make sure that the "Use as Filter" toggle is enabled in the visual's settings.
- Interact with the visual: when you select data in one chart, the other visuals will instantly get filtered to provide relevant insights.
Benefits of This Method
- Intuitive Filtering: Make the reports feel more responsive and dynamic to the user, and see the full picture from multiple perspectives.
- Multi-Dimensional Drill Down: Explore deeper levels of data without changing pages.
- Better insights: Instead of a static list of categories, the user can see them displayed as pie charts, map charts, columns or other intuitive visualizations.
When to Use Each Method
- Use slicers when your report needs a simple list of filtering options in a compact, discreet package that's familiar to most users.
- Use ZoomCharts Visuals when you want to create dynamic and interactive reports and analyze the same data across multiple dimensions for fully informed insights.
Final Thoughts
Knowing how to add a slicer in Power BI is crucial for building interactive reports. While the standard method offers simplicity, ZoomCharts custom visuals bring a whole new level of interactivity and speed, making it easier to uncover deeper insights faster.
Ready to elevate your Power BI experience? Try ZoomCharts custom visuals today and see the difference.
FAQ
Can I use ZoomCharts visuals alongside standard slicers?
Yes, ZoomCharts visuals are fully compatible with Power BI slicers, allowing for a hybrid approach. In fact, you can use both on the same report to create seamless filtering and navigation experience for the users.
Do ZoomCharts visuals require coding?
No. ZoomCharts visuals for Power BI are plug-and-play and they will seamlessly work with your existing Power BI reports. All setup and configuration is done in the built-in Format Visual pane, so if you know how to use Power BI, you know how to use ZoomCharts as well.
Do ZoomCharts visuals support mobile reports?
Absolutely - ZoomCharts visuals are designed ground-up to provide excellent user experience both on PCs and multi-touch devices.
Related content
- Power BI Dashboard vs Report: What's the Difference?
- Filters in Power BI: Everything You Need to Know
- Top 10 Power BI Tips and Tricks for Better Reports

Want more info like this?
Subscribe to our newsletter and be the first to read our latest articles and expert data visualization tips!
