logo
For Power BI
  • Products
    • Drill Down Donut Pro Drill Down Donut PRO
    • Drill Down Pie Pro Drill Down Pie PRO
    • Drill TimeSeries Pro Drill Down TimeSeries PRO
    • Drill Combo Pro Drill Down Combo PRO
    • Drill Map Pro Drill Down Map PRO
    • Drill Scatter Pro Drill Down Scatter PRO
    • Drill Down Network Pro Drill Down Network PRO
    • Drill Down Waterfall Pro Drill Down Waterfall PRO
    • Drill Down Graph Pro Drill Down Graph PRO
    • Drill Down Timeline Pro Drill Down Timeline PRO
    • Drill Down Combo Bar PRO Drill Down Combo Bar PRO
    • Drill Down Line PRO Drill Down Line PRO

    Video tutorials

    Watch Now

    More than 90 videos on how to enhance Power BI with ZoomCharts

    Learn more
    All visuals
  • Resources

      Resources

    • Documentation
    • Report Examples
    • Blog
    • Webinars
    • Video Tutorials
    • Visuals Gallery

    Support

    • ZoomCharts Assistance
    • Contact Sales
    • Contact Support
    • FAQ

    Challenges

    Challenges

    Improve your report creation skills by participating in free challenges for report creators.

    Learn more
    Start trial
  • Services
    • Power BI Report Development
    • Custom Visual Development
  • Challenges
  • Pricing
Request a quote Start Free Book a Demo Sign in
Get it now
Go back

Contents

Go back

Aug 14, 2025

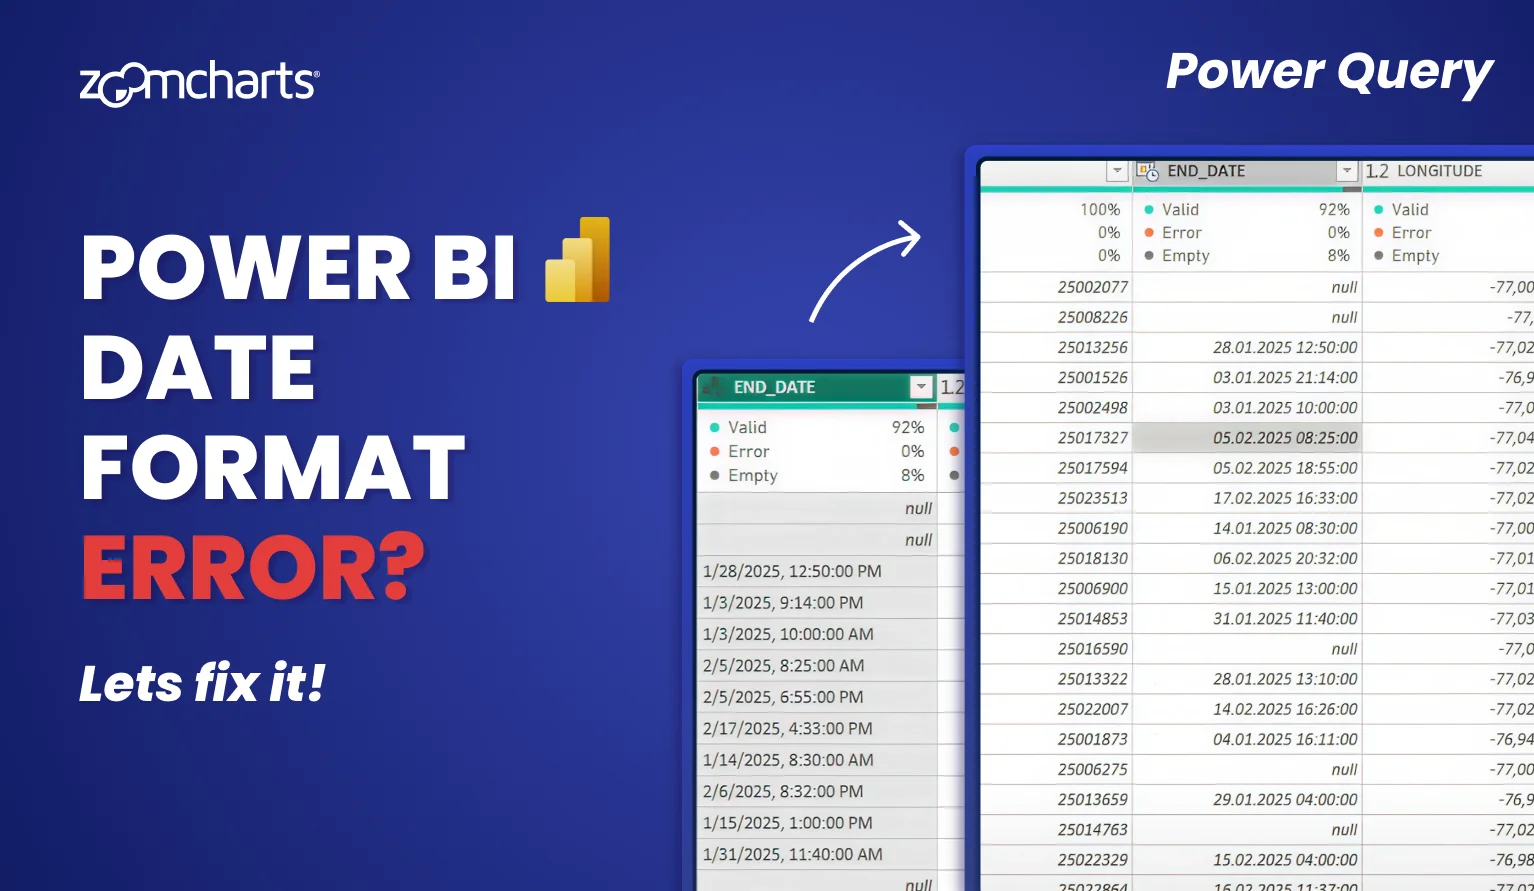
Fixing Date Format Errors in Power BI: A Step-by-Step Guide

When working with Power BI, especially across international datasets, one of the most common (and frustrating) issues developers encounter is data format errors.

Title image
Title image

When working with Power BI, especially across international datasets, one of the most common (and frustrating) issues developers encounter is data format errors.

Contents

Share this article

Date format errors usually occur due to differences in regional date conventions (for example, DD.MM.YYYY in Europe, MM-DD-YYYY in the US, and YYYY/MM/DD in Asia). In this guide, we will show you how to quickly resolve Power BI date issues with a simple trick: “Change Type with Locale” in Power Query.

Common Problem: Date Format Mismatches in Power BI

Many datasets originate from different regions, and the date notation in each data source may be different due to regional conventions. For example, your Paris HQ may write “August 12, 2025” as 12.08.2025, whereas the data from your New York HQ has it like 08-12-2025, and Tokyo HQ notates it as 2025/12/08. Which is August 12, and which is December 8?

When merging international datasets together, Power BI may be just as confused by the mismatched date formats as you are, so it may result in:

  • Misinterpreted dates or errors
  • Incorrect column formats (Text instead of Date or DateTime)
  • Broken visuals if they rely on datetimes.

Solution: Convert Date Columns Using Locale

Power BI provides a smart workaround using locale settings in Power Query to interpret columns according to the correct regional format. In just a few clicks, the entire column will have an unified datetime format using your selected regional notation.

Video Tutorial: Change Type with Locale in Power Query

This video is a clip from our “Crime Analysis Power BI Report Workshop” webinar. Our resident Power BI report design expert Aivis often shares useful tips like this, so we recommend subscribing to ZoomCharts YouTube channel!  

Step-By-Step Instructions for Power BI Date Format Fix

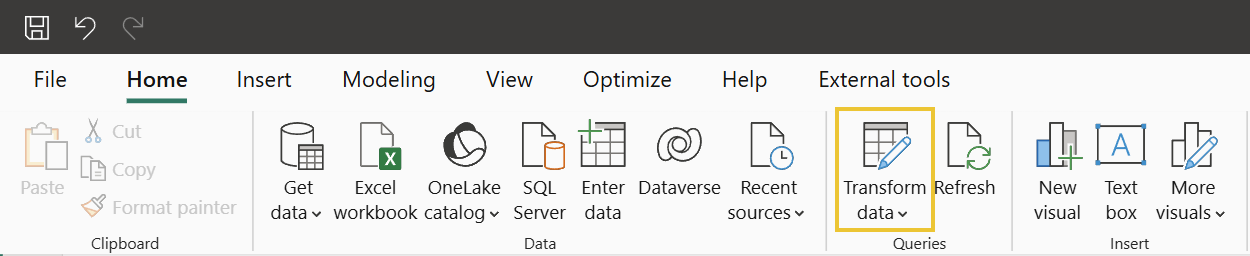
Step 1: Open Power Query Editor

In Power BI Desktop, click on Transform Data, located in the Home tab of the top ribbon.

Click Transform Data in Power BI to open Power Query Editor

Step 2: Highlight Affected Columns

Select the columns with mismatched date formats (e.g. “Start Date”, “End Date”, etc.) by clicking on their column headers.

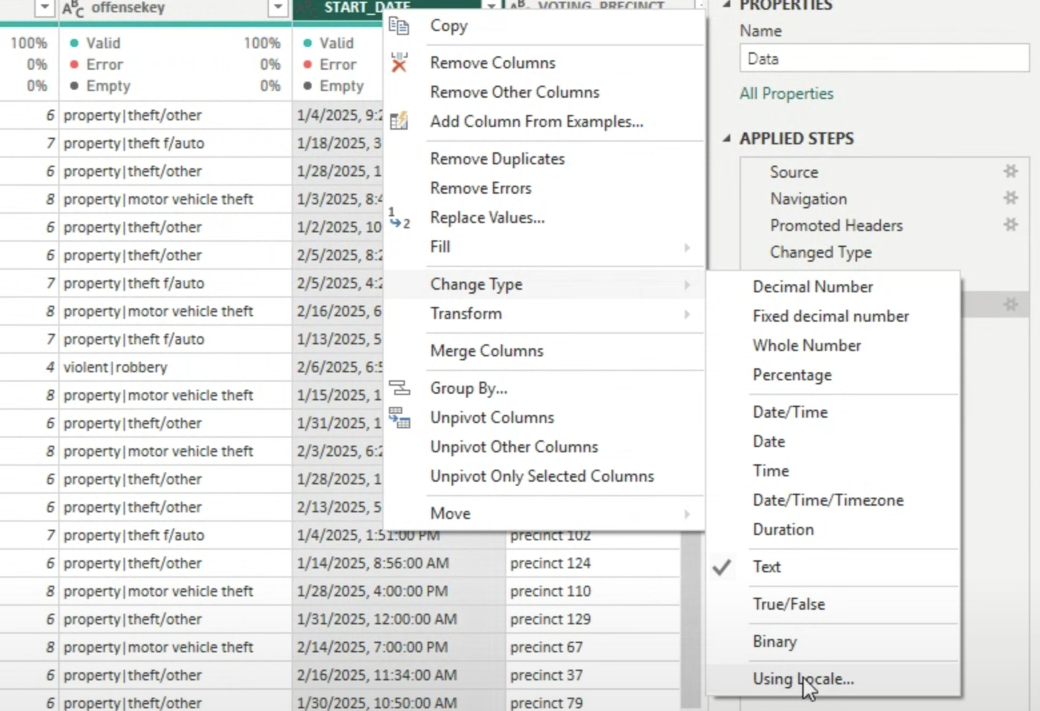
Step 3: Right Click -> Change Type -> Using Locale

The context menu will offer many different types – but instead of Date/Time, select Using Locale… instead.

Power Query: Change Type using Locale

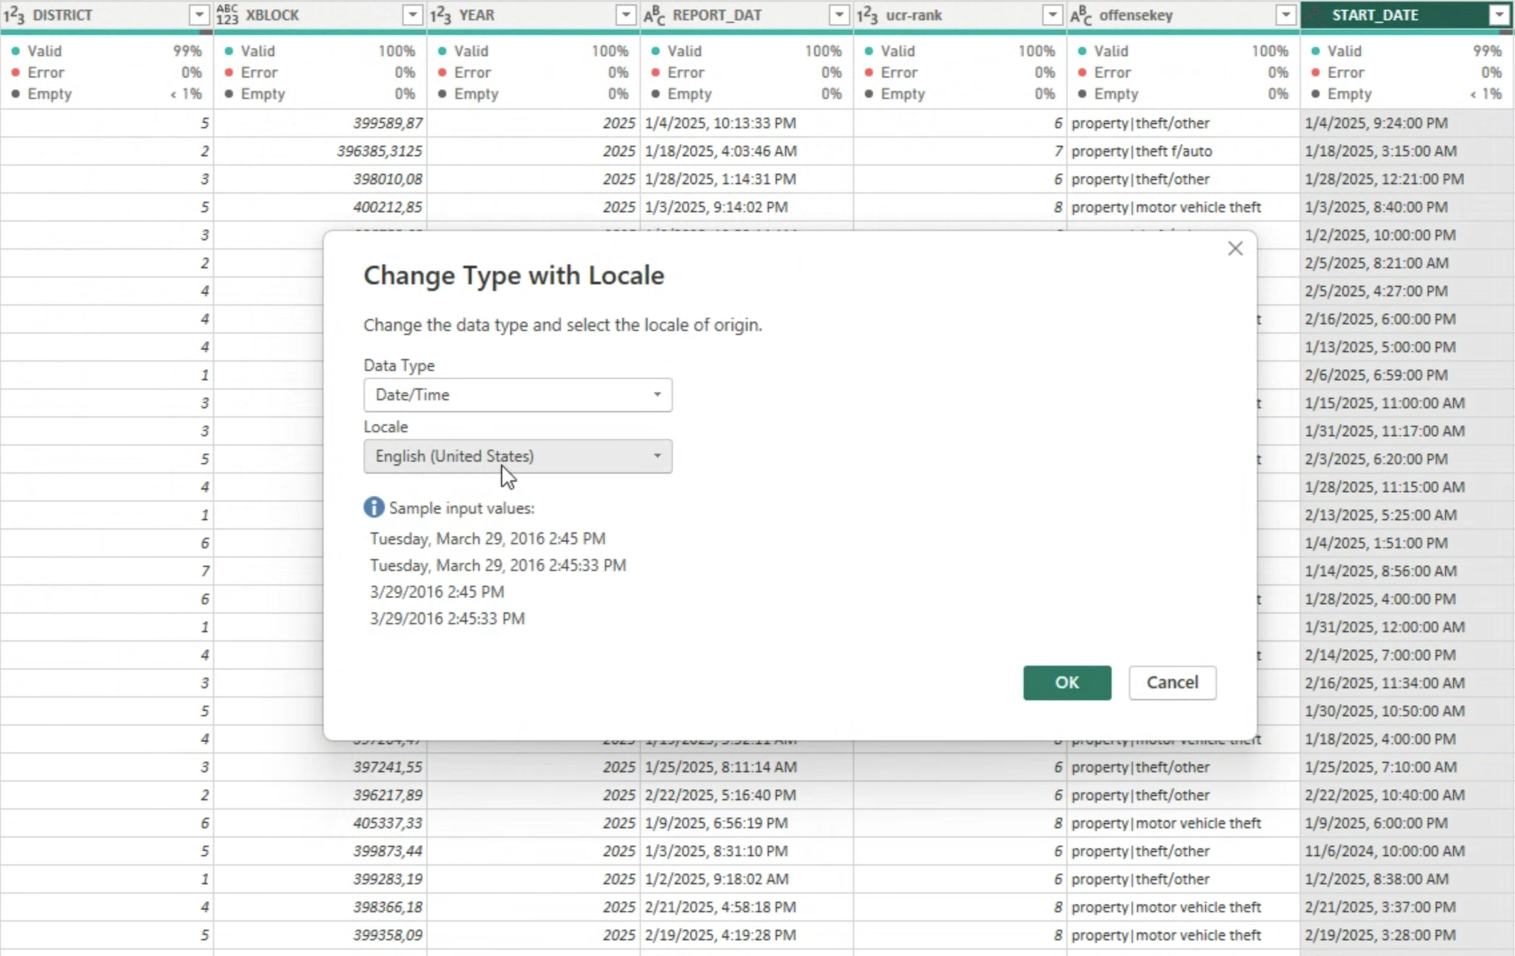
Step 4: Set the Correct Data Type and Locale

Once you select Using locale…, a new popup dialog will appear. There, set the data type to Date or Date/Time, and select the locale for the origin of your data. For example, if the data comes from USA, set to English (United States). This way, Power Query will know the origin locale of the data source and will know how to correctly interpret each date notation when merging multiple data sources from different regions together.

Power Query: Change Type using Locale dialog screen

Step 5: Click OK and Validate

Your date values should now convert properly without errors. For example, it will parse 1/08/2025 as January 8, not August 1, because it now knows that the locale that you set is United States so it should be read using MM/DD/YYYY.

Input Locale vs. Output Locale

  • Input Locale is how the data was formatted originally. What we adjusted now in Power Query is the input locale; it’s so that it can interpret them correctly.
  • Output Locale is how the data is displayed to the user, and the steps above did not affect that. It’s dependent on the users’ locale settings in Power BI – for example, if the user is in France, “August 12, 2025” will be displayed as “12 août 2025”.

Final Thoughts

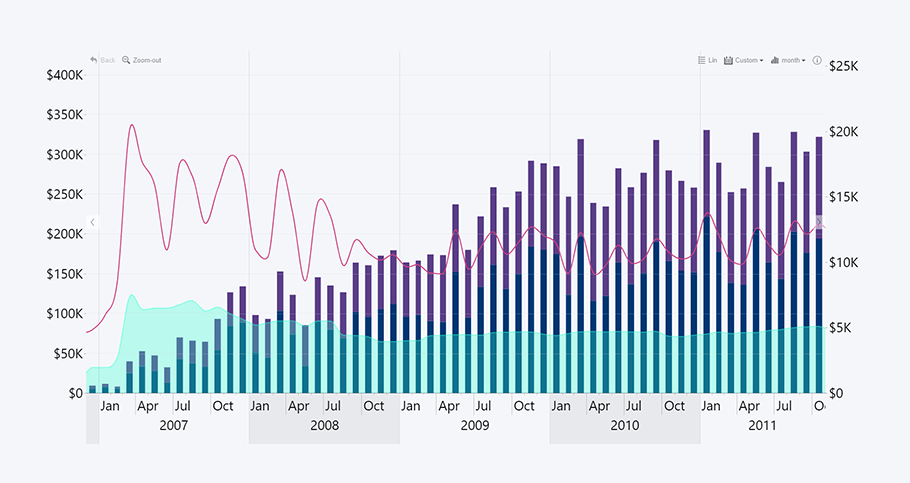
Power BI date format errors are one of the most annoying things, and the Change Type with Locale method is the quickest and easiest way to avoid issues – especially when working with multiple data sources with different regional date notations. Now, your date columns will be parsed correctly, and you can properly visualize them in your reports. For example, with our Timeline PRO visual, which will make it easy to drill down based on your datetime hierarchy – try it now!

Power BI Timeline Chart

FAQ

Why do my date columns show as text in Power BI?

This often happens because Power BI cannot automatically detect the correct date format due to mismatched locale settings or different date formats within the dataset.

Should I always change the locale when importing data?

The Change Type with Locale method should be used only if you encounter mismatched date formats or errors due to different locales; in most cases, Power BI should handle datetimes without any issues.

What if I want to display dates in a different format for users?

What we described above will only affect input locale. If you want to alter output locale, which is how they are displayed to the user, you can apply custom formatting with DAX or within visual settings; otherwise they will be displayed using the user’s regional date format.

Can I automate this for all reports?

You can set the default locale for all new reports under Options -> Regional Settings for consistency.


envelope icon

Want more info like this?

Subscribe to our newsletter and be the first to read our latest articles and expert data visualization tips!


Find out more

Jun 12, 2022

Blog Thumbnail
Guides

Power BI Waterfall Charts: A Detailed Guide

Do you know how to make a waterfall chart? Here are 7 tips you should know when building user friendly Power BI waterfall charts. Customize it to tell a data story that helps you make data driven decisions. Bar and column charts work great for visualizing a beginning and ending value. However, these charts fail to display the full data story by leaving out all the unique factors that contribute to a final net value. In this article, we will look at the basics of waterfall charts and what practices you can implement to build the best waterfall charts in Power BI.

Jul 01, 2022

Blog Thumbnail
Use cases

Microsoft Integrates ZoomCharts in Dynamics 365 Supply Chain Insights

We are excited to announce the collaboration between Microsoft’s latest product – Dynamics 365 Supply Chain Insights – and technologies provided by ZoomCharts – the Network and Map visuals.

Feb 14, 2022

Blog Thumbnail
Guides

Everything You Need To Know About Power BI Bar Charts

Power BI bar charts are a simple and efficient way to show category-based data. Almost everyone has used a bar chart, which is why they've remained incredibly popular through the years. In this article, we will explore the many ways you can make Power BI bar charts even more powerful and use them to the max.

Dec 16, 2021

Blog Thumbnail

How We Turned Many Excel Files Into an Interactive Power BI Report about Latvia’s Export landscape

How We Turned an Excel Sheet Into an Interactive Report: Latvia Export Barometer. ZoomCharts took part in a widescale project that created a full report of...

Sep 04, 2022

Blog Thumbnail
Guides

Power BI Donut Chart

The donut and pie charts are some of the most ubiquitous charts around. Instantly recognizable by people who have very little to do with charts, every report creator is bound to have to include a Power BI donut chart into a report at some point. This is not a commentary on whether you should love or hate donut charts, but rather a guide on getting the most out of donut and pie charts. Strap in tight, we're going to go over the whys, hows, do's and don'ts of Power BI donut charts.

Aug 30, 2021

Blog Thumbnail
Guides

Business Intelligence Implementation: A Complete Guide

It's no secret that the leading organizations of the world don't take any chances when it comes to business strategy - they use business intelligence to make data-driven decisions. Just like a sports team needs a coach or an army needs a strategist to achieve victory, your can reach your business goals more efficiently with the help of a robust BI system and expert BI analysts.
  • «
  • 1
  • ...
  • 7
  • 8
  • 9
  • 10
  • 11
  • 12
  • 13
  • »

Contents

Share this article

Want more info like this?

Subscribe to our newsletter and be the first to read our latest articles and expert data visualization tips!


Thank you!

Check your inbox to verify your email address.

logo
[email protected]
+44 204 577 3993
logo

Products

Drill Down Network PRO Drill Down Waterfall PRO Drill Down Graph PRO Drill Down Combo PRO Drill Down Combo Bar PRO Drill Down Donut PRO Drill Down Pie PRO Drill Down TimeSeries PRO Drill Down Timeline PRO Drill Down Map PRO Drill Down Scatter PRO All Visuals

Resources

Report Examples Webinars Blog ZoomCharts Academy Visuals Gallery Documentation Custom Visual Development Subscribe to News

Solutions

Custom Visual Development

Company

Pricing About Us Partners Leave feedback Join PowerGroup EU Funding

Help

ZoomCharts Assistance Contact Sales Contact Support FAQ

Drill Down Network PRO Drill Down Waterfall PRO Drill Down Graph PRO Drill Down Combo PRO Drill Down Combo Bar PRO Drill Down Donut PRO Drill Down Pie PRO Drill Down TimeSeries PRO Drill Down Timeline PRO Drill Down Map PRO Drill Down Scatter PRO All Visuals

Report Examples Webinars Blog ZoomCharts Academy Visuals Gallery Documentation Custom Visual Development Subscribe to News

Custom Visual Development

Pricing About Us Partners Leave feedback Join PowerGroup EU Funding

ZoomCharts Assistance Contact Sales Contact Support FAQ
+44 204 577 3993
[email protected]

Ready to get in touch?

Contact our experts with any question about Power BI and ZoomCharts for Free!

Contact us

© 2025, Data Visualization Software Lab

U.S. Patents No. 11,645,343; 11,921,804; 12,346,389

Cookies Policy
Manage cookies
Privacy Policy
Global
EULA
Patent
warning

Error message

success

Success info: Done!

ZoomCharts AI Assistant

We noticed you're using an old OS version.

For the best experience, we recommend upgrading to ensure that all website features display correctly.

Cookie settings

We use necessary cookies for site functionality, as well as statistic, marketing, and preference cookies to enhance your experience. For more information and to manage your preferences, please visit our Cookie policy