762
Urbanization in South America
Urbanization in South America
More Report pages
Report Author: Kamonphan Teeraphabpitag
762
Share template with others
Report submitted for Onyx Data DataDNA ZoomCharts Mini Challenge, February 2025. The report is based on the Demographic and Urbanization dataset and includes ZoomCharts custom Drill Down PRO visuals for Power BI.
Authors Description
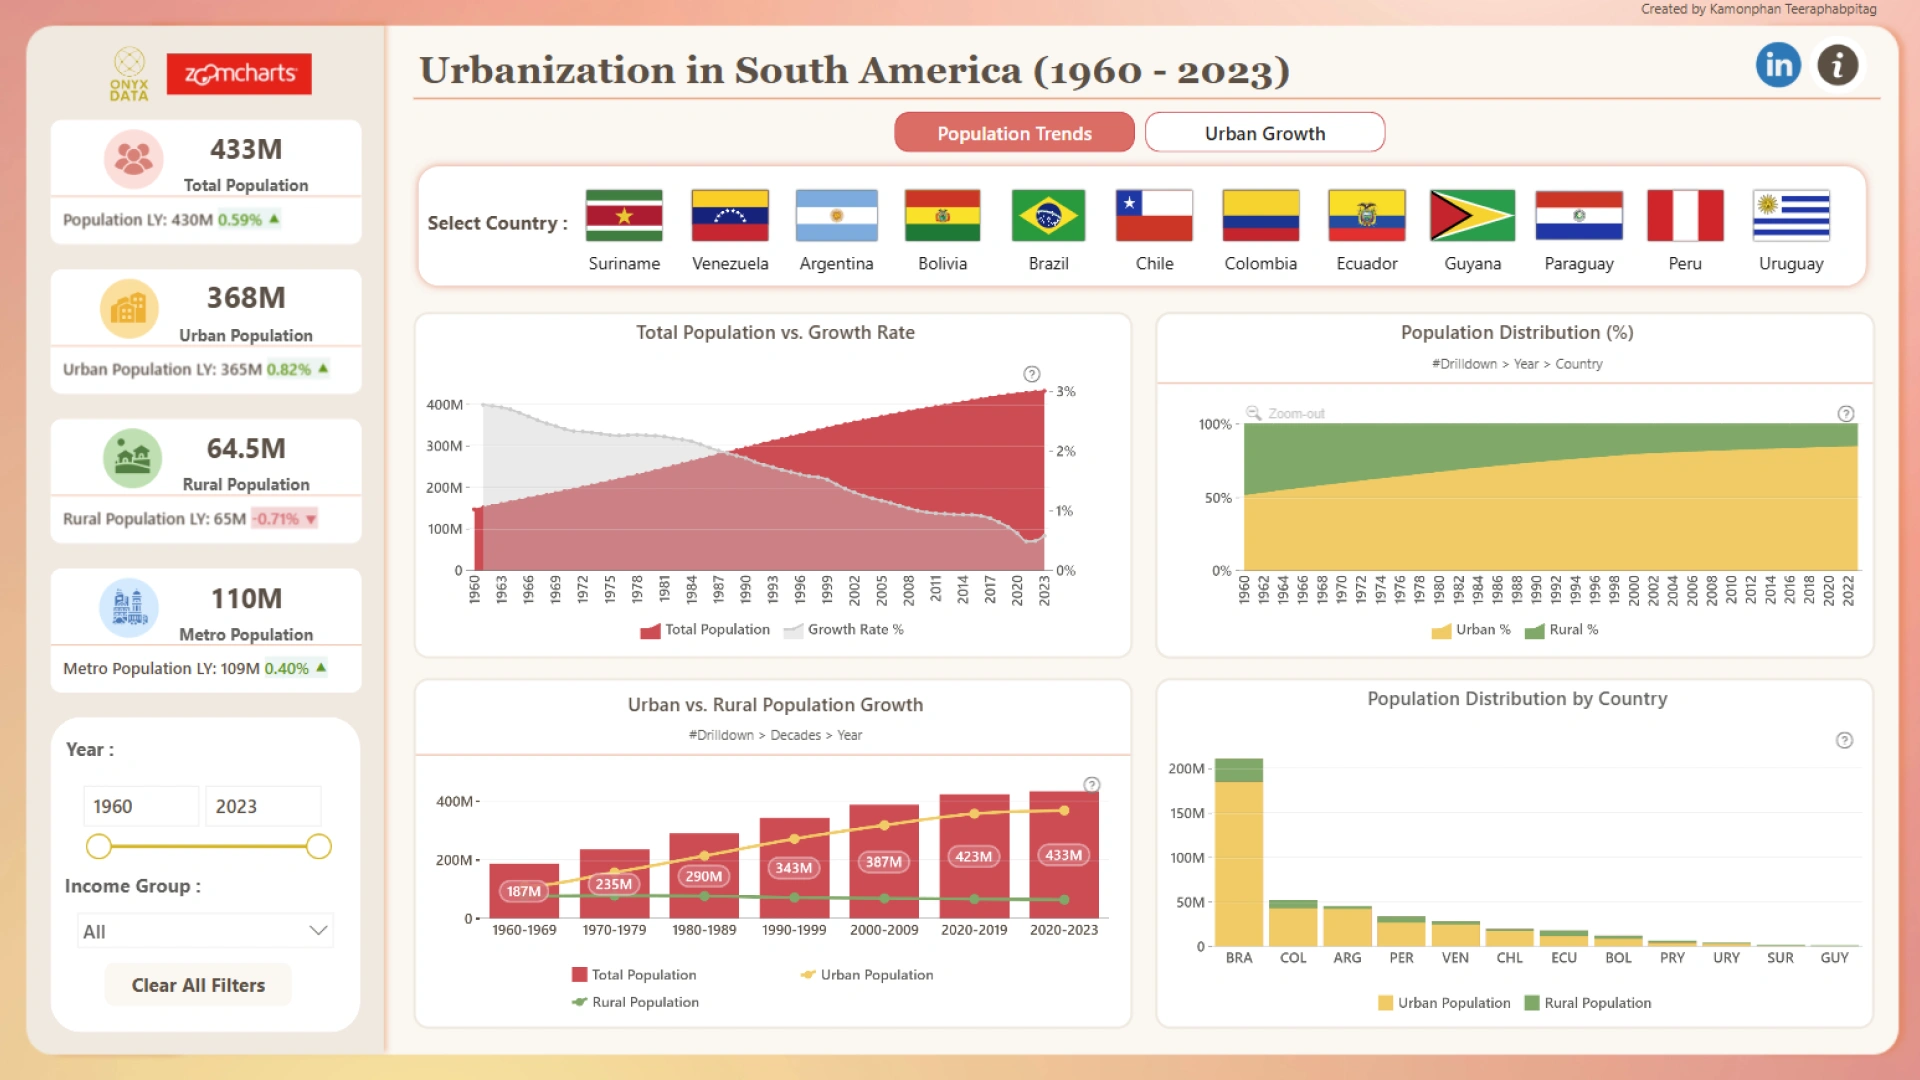
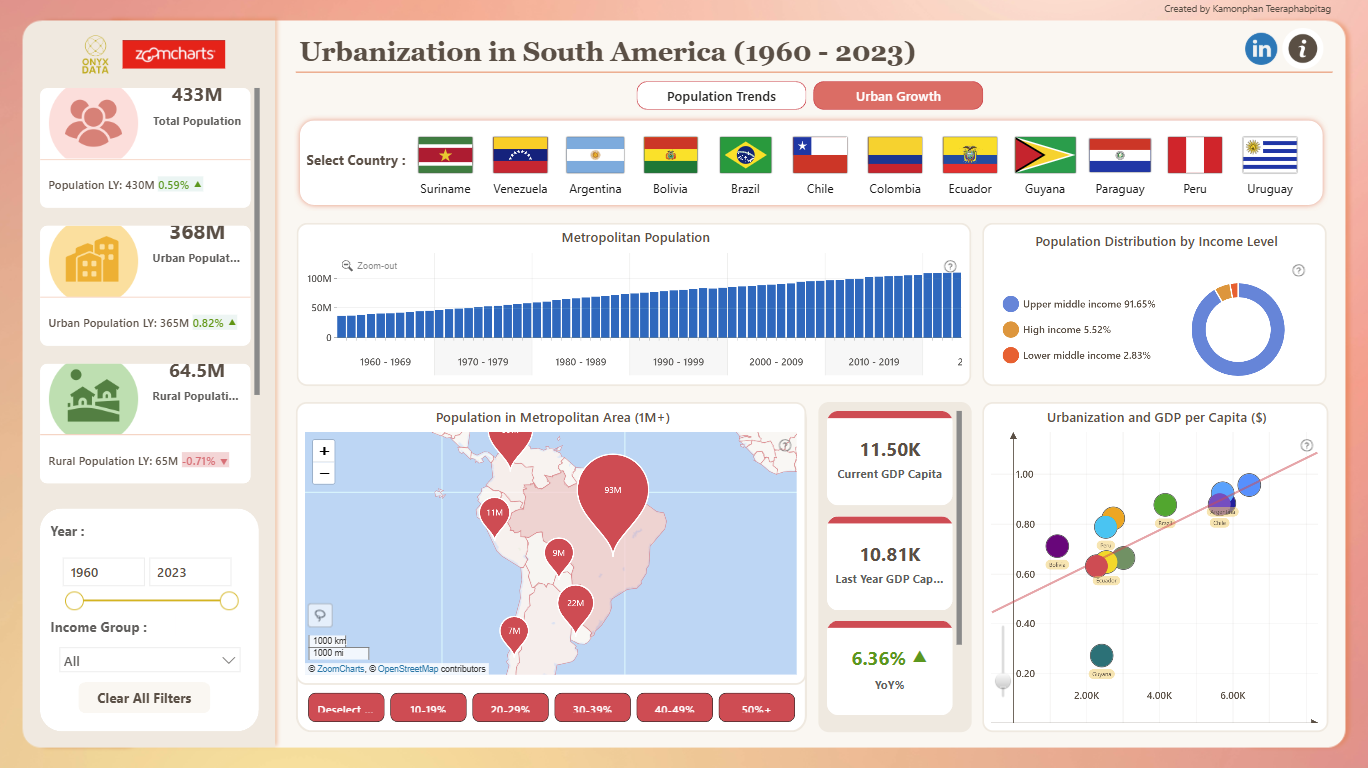
This dashboard explores urbanization and economic trends in South America (1960 - 2023). It highlights population growth, urban vs. rural distribution, metro expansion, and GDP per capita ($).
ZoomCharts visuals used
4U Report Challenges
Participate in data challenges, build and submit reports to get free template downloads.
Join CommunityMobile view allows you to interact with the report. To Download the template please switch to desktop view.


Was this helpful? Thank you for your feedback!
Sorry about that.
How can we improve it?