logo
For Power BI Report Templates
  • Products

    Drill Down Visuals for Power BI

    Discover the most customizable custom visuals for Power BI.

    Pricing & licensing
    • Drill Down Donut Pro
      Drill Down Donut Category Composition
    • Drill Down Pie Pro
      Drill Down Pie Proportional Breakdown
    • Drill Down Combo Pro
      Drill Down Combo Multi-Metric Trends
    • Drill Down Combo Bar Pro
      Drill Down Combo Bar Cross-Metric Trends
    • Drill Down Line Pro
      Drill Down Line Trend Analysis
    • Drill Down Bubble Pro
      Drill Down Bubble Value Relationships
    • Drill Down Scatter Pro
      Drill Down Scatter Correlation Analysis
    • Drill Down Network Pro
      Drill Down Network Entity Connections
    • Drill Down Graph Pro
      Drill Down Graph Relationship Mapping
    • Drill Down Map Pro
      Drill Down Map Geographic Insights
    • Drill Down Waterfall Pro
      Drill Down Waterfall Change Breakdown
    • Drill Down Timeline Pro
      Drill Down Timeline Time-Based Metrics
    • Drill Down TimeSeries Pro
      Drill Down TimeSeries Temporal Patterns
    • Drill Down Line Pro
      Drill Down Line Trend Analysis

    Visuals in Planning

    Discover visuals we’re exploring, share your feedback, and help us decide what to build next.

    Browse concepts
  • Template Reports
    • Browse Report Templates
      Browse Report Templates Explore 2000+
      Power BI reports
    • Pricing Report Templates
      unlimited access

    Explore Report Templates

    Industry

    • Logistics
    • Education
    • Healthcare
    • Transportation
    • Banking
    • Ecommerce
    • Crime analytics
    • Retail
    • Manufacturing

    Business Domain

    • Sales
    • Marketing
    • Accounting & Finance
    • Human Resources
    • Research
    • Project Management
    • CRM
    • Support
    • Customer experience
  • Resources

      Learn

    • Video Tutorials Step-by-step Power BI guides
    • Webinars Live and recorded expert sessions
    • Visuals Gallery Explore all custom Power BI visuals
    • Blog Power BI tips, updates, and guides
    • Documentation Setup, features, and API reference

    Support

    • ZoomCharts Assistance Help from our product experts
    • Contact Sales Questions about pricing or licensing
    • Contact Support Technical help and troubleshooting
    • FAQ Quick answers to common questions
  • Services
    • Power BI Report Development
      Power BI Report Development End-to-end custom
      Power BI reports.
    • Custom Visual Development
      Custom Visual Development Custom visuals for
      your business needs.
  • Challenges
  • Pricing
Get started
Get started
Get it now
Go back

Contents

Dashboard and report examples Power BI Real Estate Dashboard for Property Listings and Pricing Analysis
Go back

3448

Power BI Real Estate Dashboard for Property Listings and Pricing Analysis

Power BI Real Estate Dashboard for Property Listings and Pricing Analysis

Report
Report
Report
Report

More Report pages

Report
Report
Report
Report
Report Interact

Report Author: Nina Ikpe

3448

Scatter Combo Combo Bar Timeline Map Donut Real Estate

Share template with others

This interactive Power BI report template explores the European Real Estate Market Analytics dataset. It helps real estate agencies, property portals, investors, analysts, and Power BI developers analyze property prices, price per square meter, listing activity, and property characteristics across European countries and cities to identify market trends, compare locations, and evaluate investment opportunities.

The report was submitted to the FP20 Analytics ZoomCharts Data Challenge #36 (March – April 2026).

Use this Power BI real estate dashboard to:

  • Track property listings, average rent, average property price, and price per sqm across European markets
  • Compare listing activity and pricing across countries, cities, and locations
  • Analyze rental vs sale market distribution and overall market trends
  • Understand how furnishing, amenities, energy rating, floor level, size, and configuration affect property value
  • Explore individual properties by listing ID, property type, listing type, city, country, and furnishing status
  • Identify market patterns and investment opportunities across Europe

Key pages and metrics included:

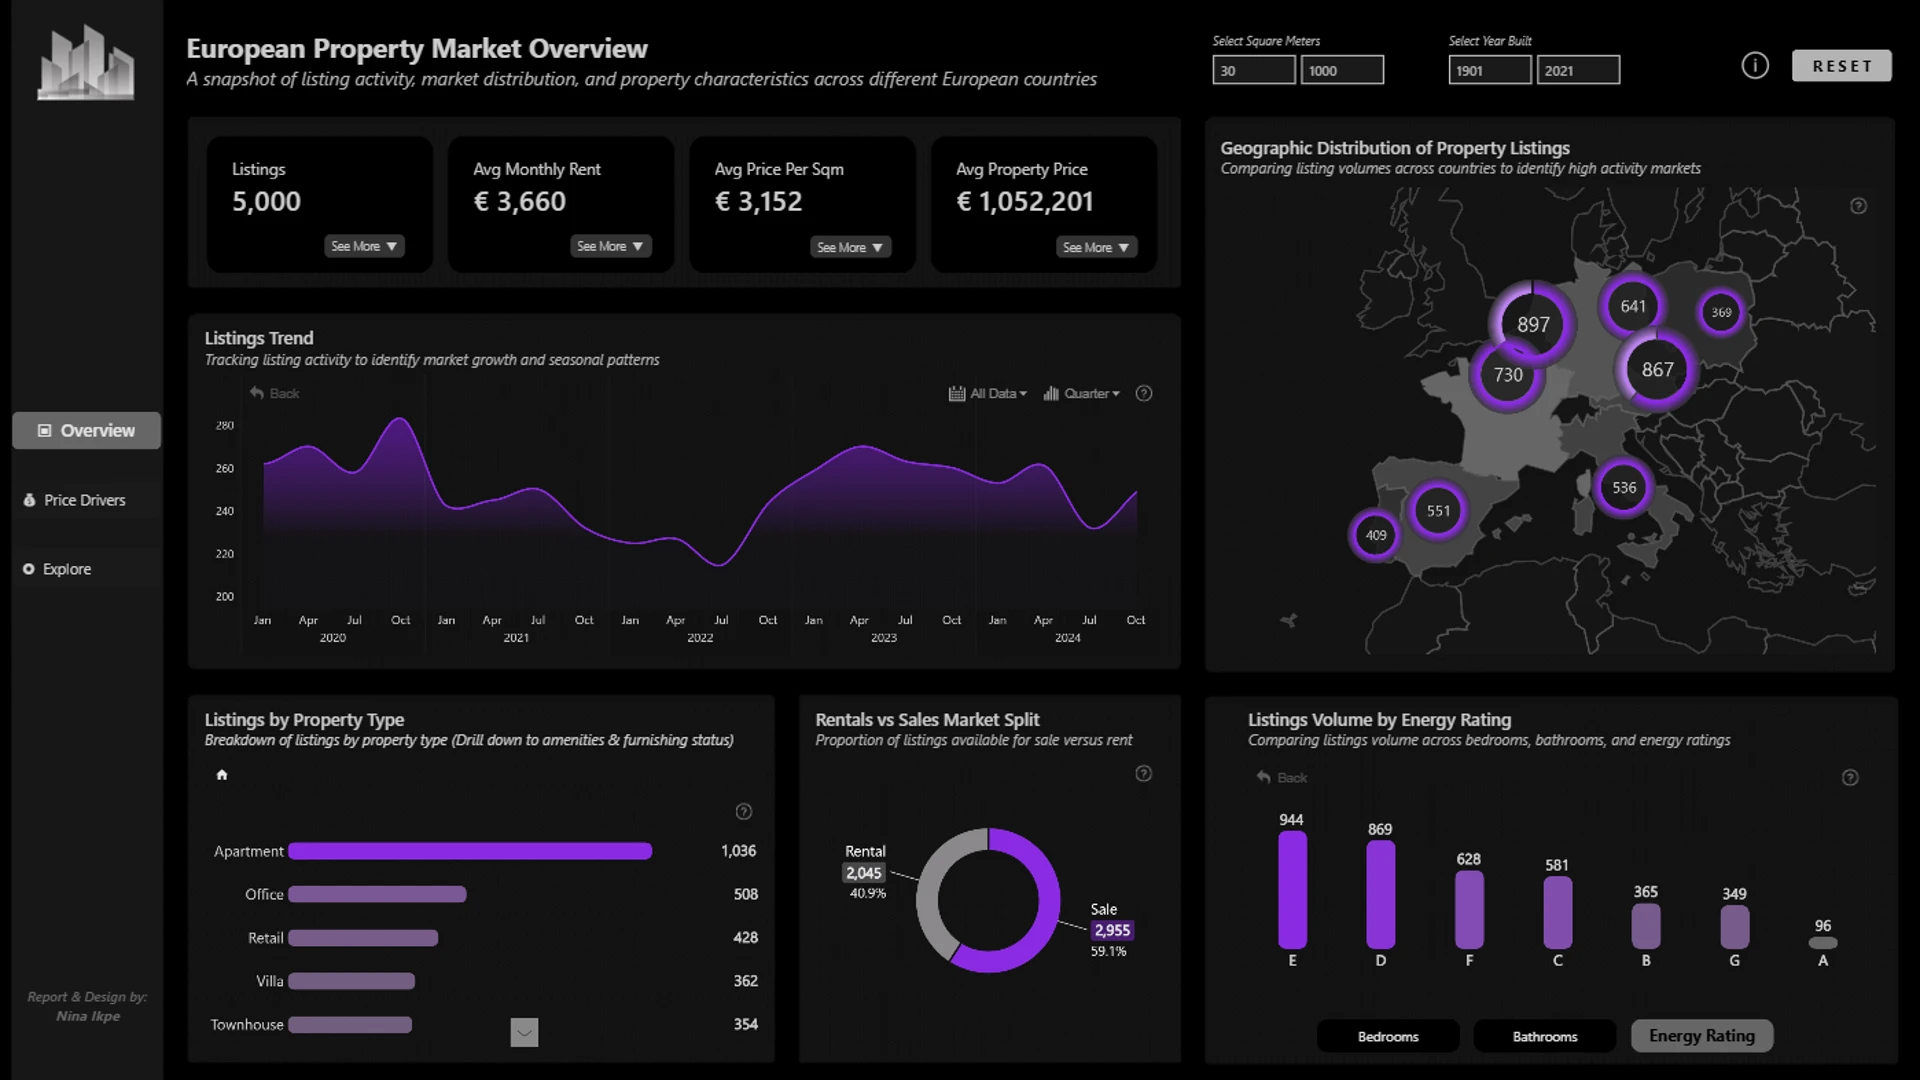
  • European Property Market Overview with KPI cards for listings, average monthly rent, average price per sqm, and average property price
  • Geographic distribution map for comparing listing volumes across countries
  • Listings trend analysis for tracking market activity over time
  • Listings by property type and energy rating distribution
  • Rentals vs sales market split
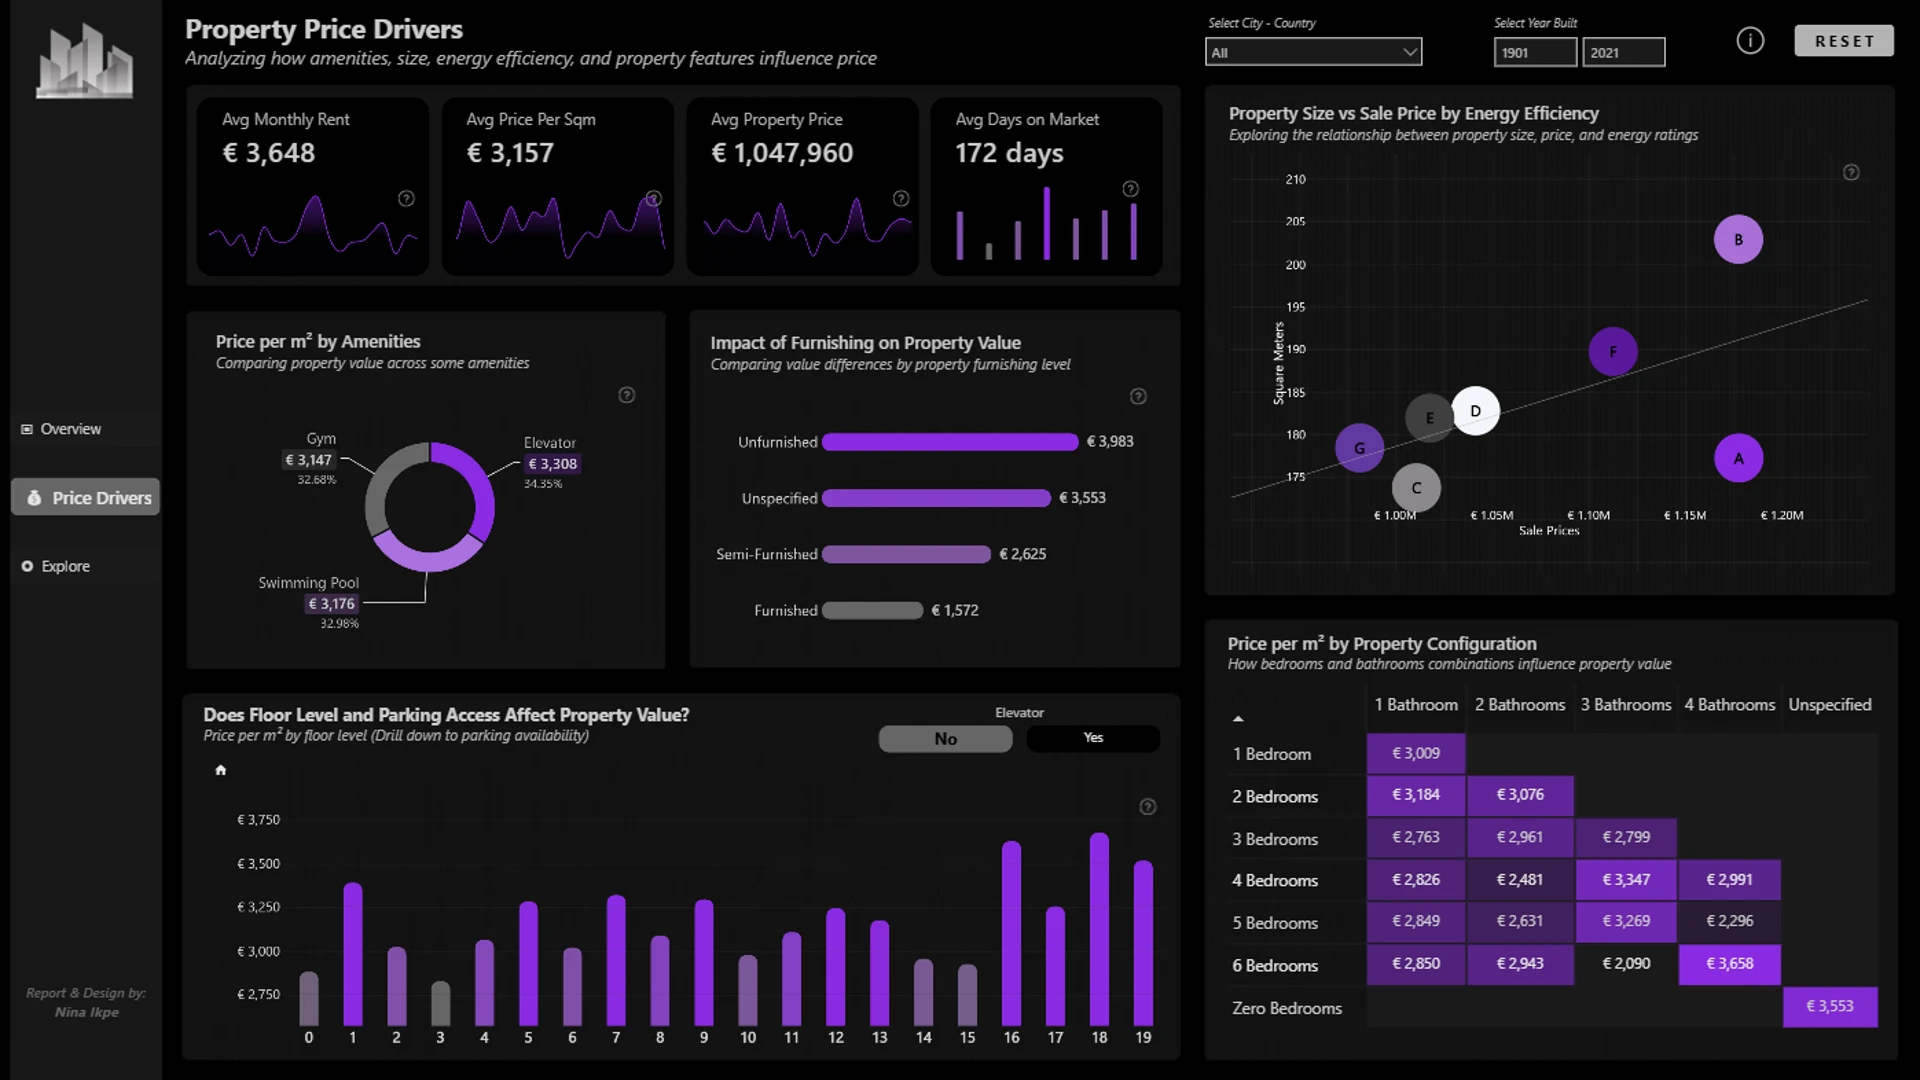
  • Property price drivers including amenities, furnishing, energy efficiency, and floor level
  • Price per m² by property configuration including bedrooms and bathrooms
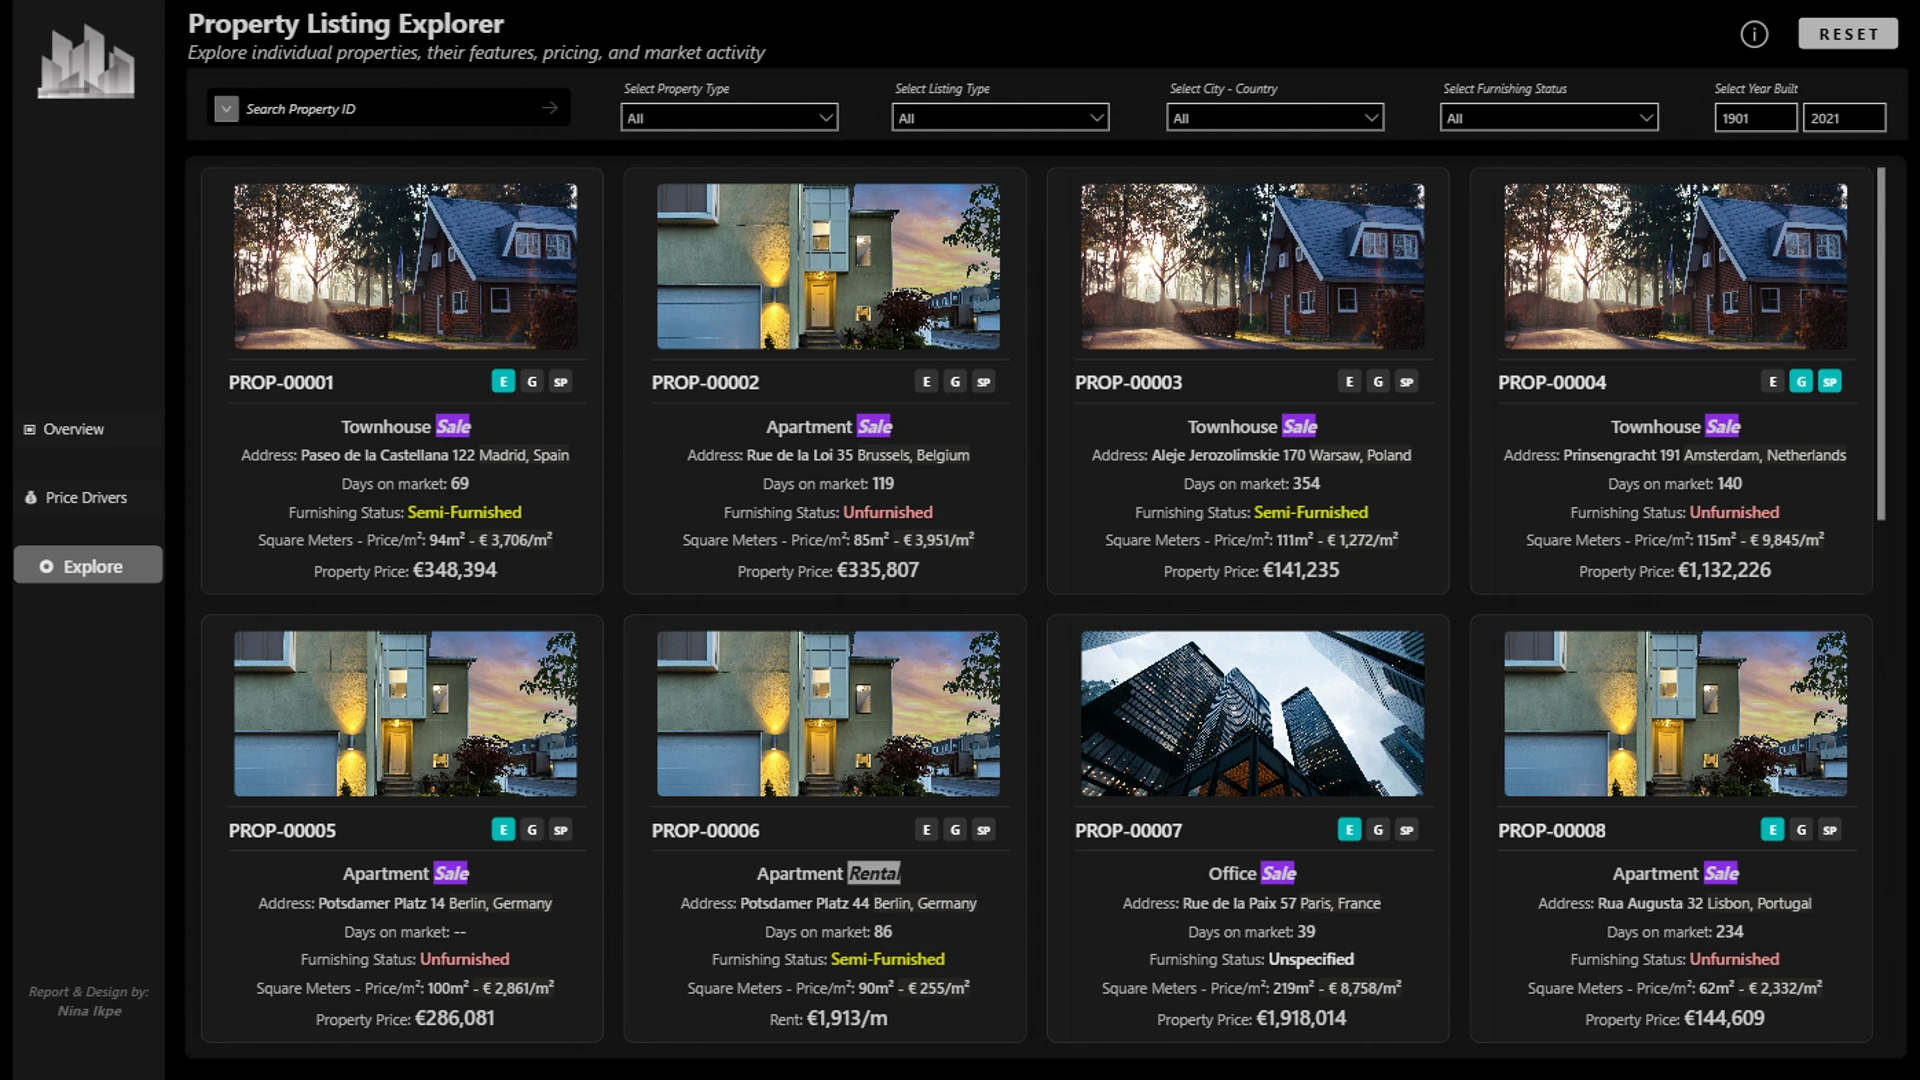
  • Property Listing Explorer with searchable listing-level cards for quick comparison

Real estate and pricing KPIs:

  • Total listings
  • Average monthly rent
  • Average price per square meter
  • Average property price
  • Average days on market
  • Listings by property type
  • Rental vs sale share
  • Price by amenities and furnishing status
  • Energy rating breakdown
  • Property value by size, layout, floor level, and building features

Interactive Power BI features:

  • Drill-down from market overview to pricing drivers and individual property listings
  • Cross-filtering across pricing, geography, and property characteristics
  • Interactive map-based analysis of listing distribution across Europe
  • Dynamic filtering by square meters, city-country, year built, property type, listing type, and furnishing status
  • Searchable property explorer for reviewing individual listings and comparing opportunities

Who this report is for:

  • Real estate agencies and brokerages
  • Property listing and proptech platforms
  • Real estate investors and portfolio managers
  • Housing and rental market analysts
  • Valuation and research teams
  • Power BI developers building real estate dashboards

This Power BI real estate dashboard template is fully customizable in Power BI Desktop and can be adapted to property marketplace data, brokerage listings, rental datasets, valuation models, and housing market analytics. It is ideal for teams that need a European property market dashboard to monitor listing trends, compare countries and cities, analyze pricing drivers, and support smarter real estate decisions.

ZoomCharts visuals used

Drill Down Scatter PRO Drill Down Scatter PRO
Drill Down Combo PRO Drill Down Combo PRO
Drill Down Combo Bar PRO Drill Down Combo Bar PRO
Drill Down Map PRO Drill Down Map PRO
Drill Down Timeline PRO Drill Down Timeline PRO
Drill Down Donut PRO Drill Down Donut PRO

4U Report Challenges

Participate in data challenges, build and submit reports to get free template downloads.

Join Community

Mobile view allows you to interact with the report. To Download the template please switch to desktop view.

Similar reports

All Reports 2 results
New
Report Card

Real Estate Listings & Pricing Explorer 2

1071

New
Report Card

Real Estate Analytics Power BI Dashboard 4

374

Explore all reports

Was this helpful? Thank you for your feedback!

Sorry about that.

How can we improve it?

Power BI Real Estate Dashboard for Property Listings and Pricing Analysis

Report Author: Nina Ikpe

3448

ZoomCharts

Welcome to ZoomCharts

You’re almost there! Create an account to download reports.

or
Sign up with Microsoft

Verify your email address

We have sent a code to your email address. Please input the code below.

Didn't receive code? Request again (after 30 seconds)

Already have an account? Log in

ZoomCharts

Log in to your ZoomCharts account

Log in with Microsoft
or
Forgot password?

Reset your password

We'll email you instructions on how to reset your password

Don't have an account? Sign up

Please add credits

You have 0 available downloads.
Get more credits or upgrade your plan to continue.

View pricing
logo
[email protected]
+44 204 577 3993
logo

Products

Drill Down Bubble PRO Drill Down Line PRO Drill Down Network PRO Drill Down Waterfall PRO Drill Down Graph PRO Drill Down Combo PRO Drill Down Combo Bar PRO Drill Down Donut PRO Drill Down Pie PRO Drill Down TimeSeries PRO Drill Down Timeline PRO Drill Down Map PRO Drill Down Scatter PRO All Visuals

Resources

Report Examples Webinars Blog ZoomCharts Academy Visuals Gallery Documentation Custom Visual Development Subscribe to News

Solutions

Custom Visual Development

Company

Pricing About Us Partners Leave feedback Join PowerGroup EU Funding

Help

ZoomCharts Assistance Contact Sales Contact Support FAQ AI Information

Drill Down Line PRO Drill Down Bubble PRO Drill Down Network PRO Drill Down Waterfall PRO Drill Down Graph PRO Drill Down Combo PRO Drill Down Combo Bar PRO Drill Down Donut PRO Drill Down Pie PRO Drill Down TimeSeries PRO Drill Down Timeline PRO Drill Down Map PRO Drill Down Scatter PRO All Visuals

Report Examples Webinars Blog ZoomCharts Academy Visuals Gallery Documentation Custom Visual Development Subscribe to News

Custom Visual Development

Pricing About Us Partners Leave feedback Join PowerGroup EU Funding

ZoomCharts Assistance Contact Sales Contact Support FAQ AI Information
+44 204 577 3993
[email protected]

Ready to get in touch?

Contact our experts with any question about Power BI and ZoomCharts for Free!

Contact us

© 2026, Data Visualization Software Lab

U.S. Patents No. 11,645,343; 11,921,804; 12,346,389

Cookies
Privacy Policy
Global
Legal
Patent
warning

Error message

success

Success info: Done!

ZoomCharts AI Assistant

We noticed you're using an old OS version.

For the best experience, we recommend upgrading to ensure that all website features display correctly.

Cookie settings

We use necessary cookies for site functionality, as well as statistic, marketing, and preference cookies to enhance your experience. For more information and to manage your preferences, please visit our Cookie policy