2625
Tactical Crime Analysis 11
Tactical Crime Analysis 11
More Report pages
Report Author: Goutham Rajasekaran
2625
Share template with others
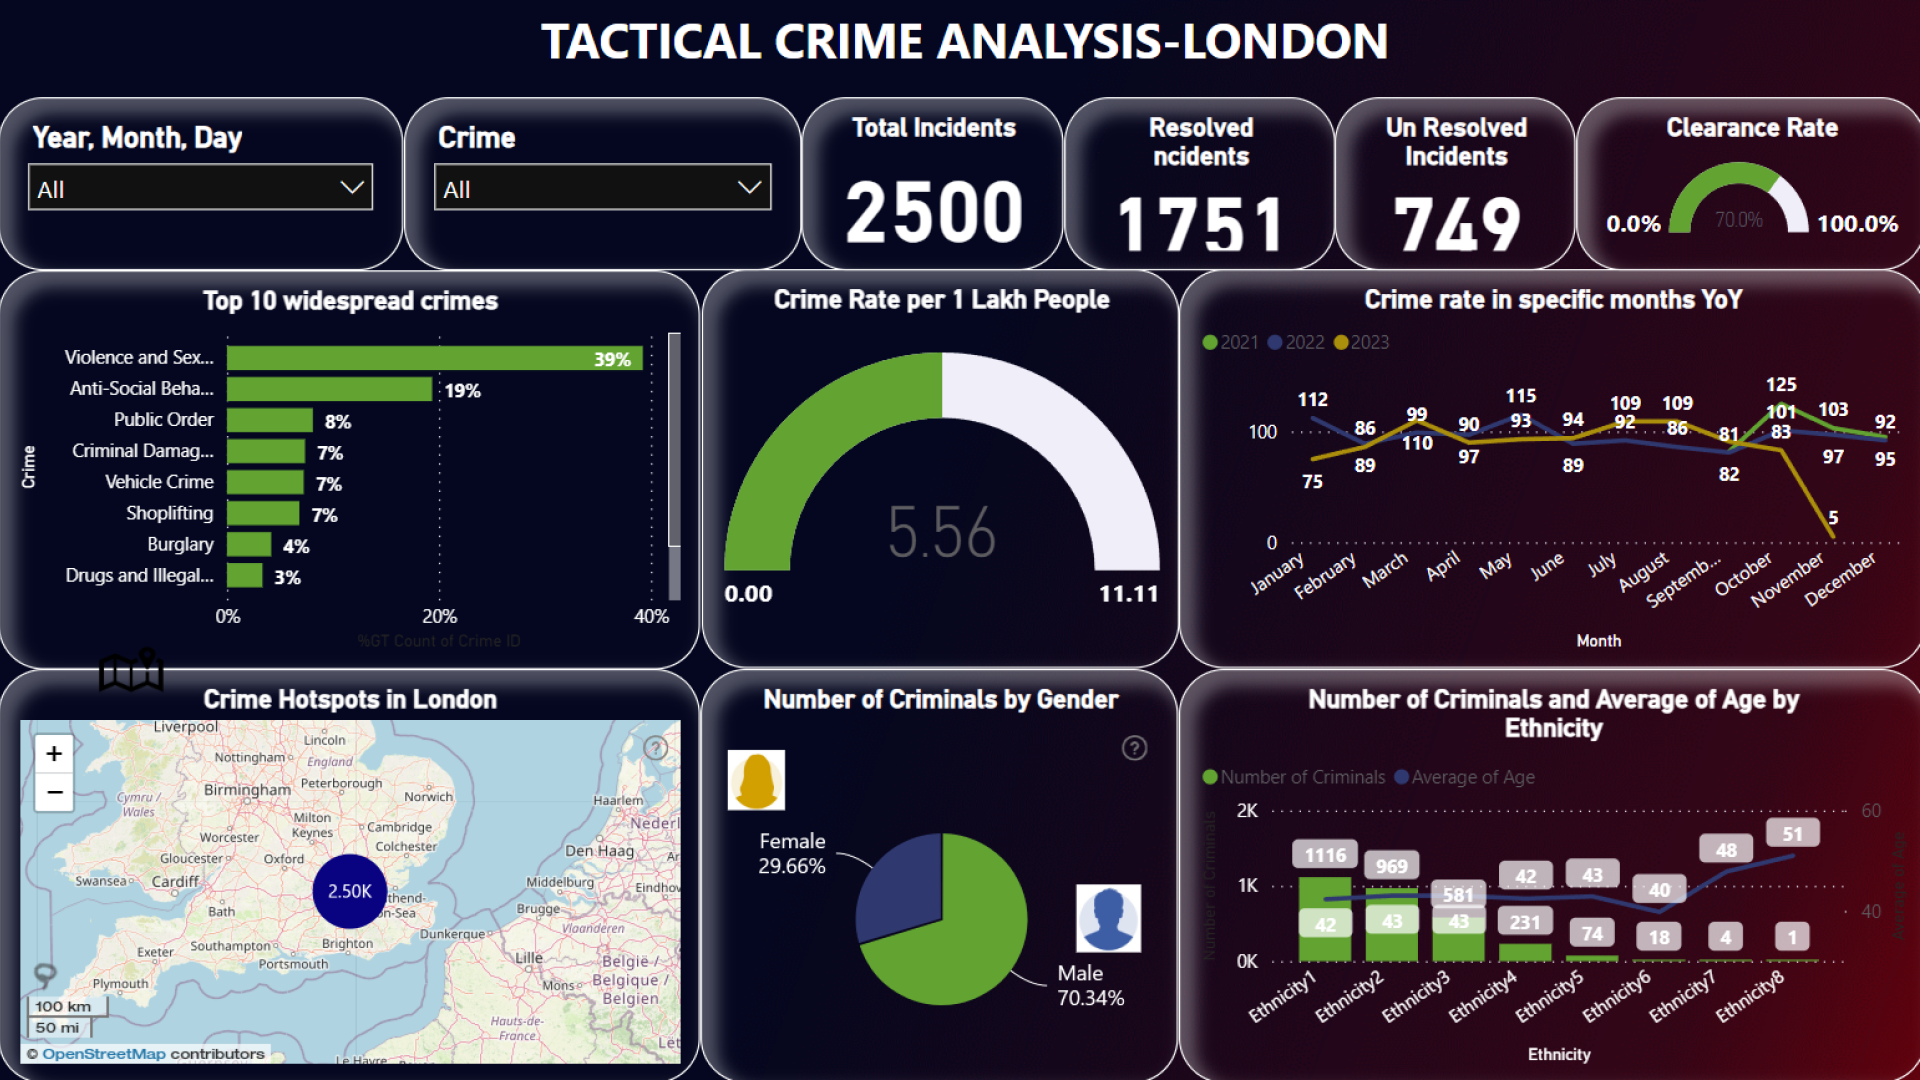
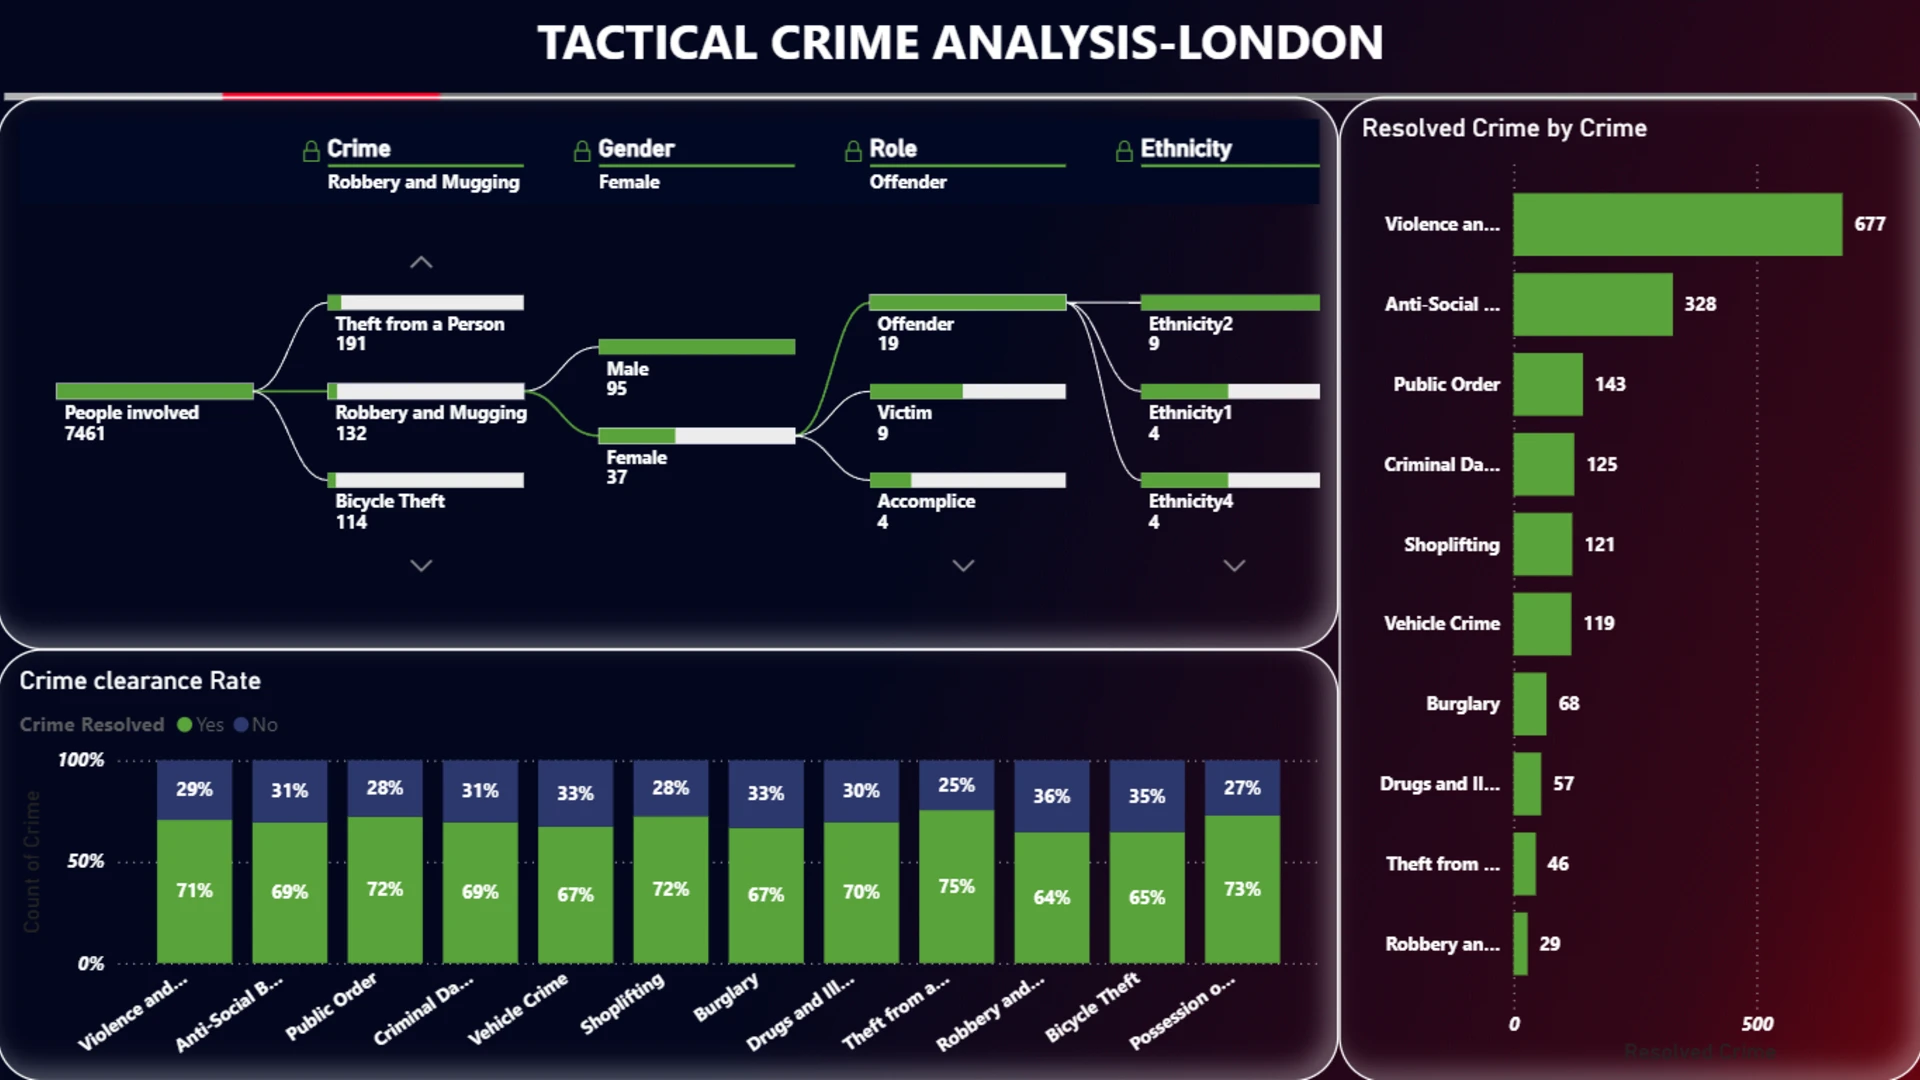
Report submitted for FP20 Analytics ZoomCharts Challenge, November 2023. The report was built with Tactical Crime Analysis dataset and includes ZoomCharts custom Drill Down PRO visuals for Power BI.
Author's description:
The Tactical Crime Analysis Dashboard in Power BI is a comprehensive solution designed to empower law enforcement agencies and security professionals with actionable insights for effective crime management and response strategies. This project aims to leverage the capabilities of Power BI to provide a user-friendly, visually appealing, and data-driven platform for analyzing and understanding crime patterns at a tactical level.
Key Features: Interactive Crime Maps: Utilize geospatial visualizations to represent crime incidents on an interactive map. Enable users to filter and drill down into specific geographic regions, providing a granular view of crime hotspots.
2. Temporal Analysis: Incorporate time-based analysis to identify patterns and trends in crime over different time intervals (daily, weekly, monthly). Implement sliders and date pickers for users to dynamically adjust the time frame and focus on specific periods.
3. Crime Type Classification: Categorize and classify different types of crimes for a more detailed analysis. Create visuals and charts that highlight the prevalence of specific crime categories in different areas.
4. User-Friendly Interface: Design an intuitive and user-friendly interface with interactive elements for easy exploration. Provide tooltips and instructional elements to guide users in utilizing the various features of the dashboard. By developing the Tactical Crime Analysis Dashboard in Power BI, this project aims to empower law enforcement agencies with a powerful tool to make informed decisions, allocate resources efficiently, and enhance overall public safety.


4U Report Challenges
Participate in data challenges, build and submit reports to get free template downloads.
Join CommunityMobile view allows you to interact with the report. To Download the template please switch to desktop view.
How to use a PBIX template
Preview the interactive report, download the PBIX file, open it in Power BI Desktop, and replace the same data connection with your own dataset.
Preview and download
Explore the report online and download the PBIX template file.
Open in Power BI Desktop
Open the downloaded PBIX file in Power BI Desktop.
Connect your data
Replace the sample data source with your own dataset.
Refresh and adjust
Refresh the model and update fields or visual were needed.
Save and share
Save your report and publish it for your audience.


