760
Consumer Financial Complaints Report 6
Consumer Financial Complaints Report 6
Report Author: Kanchan Kulkarni
760
Share template with others
This Power BI report uses the Consumer Financial Complaints Dataset and features ZoomCharts Drill Down PRO custom visuals for Power BI. It was submitted to the Onyx Data DataDNA ZoomCharts Mini Challenge in October 2025.
Author Description:
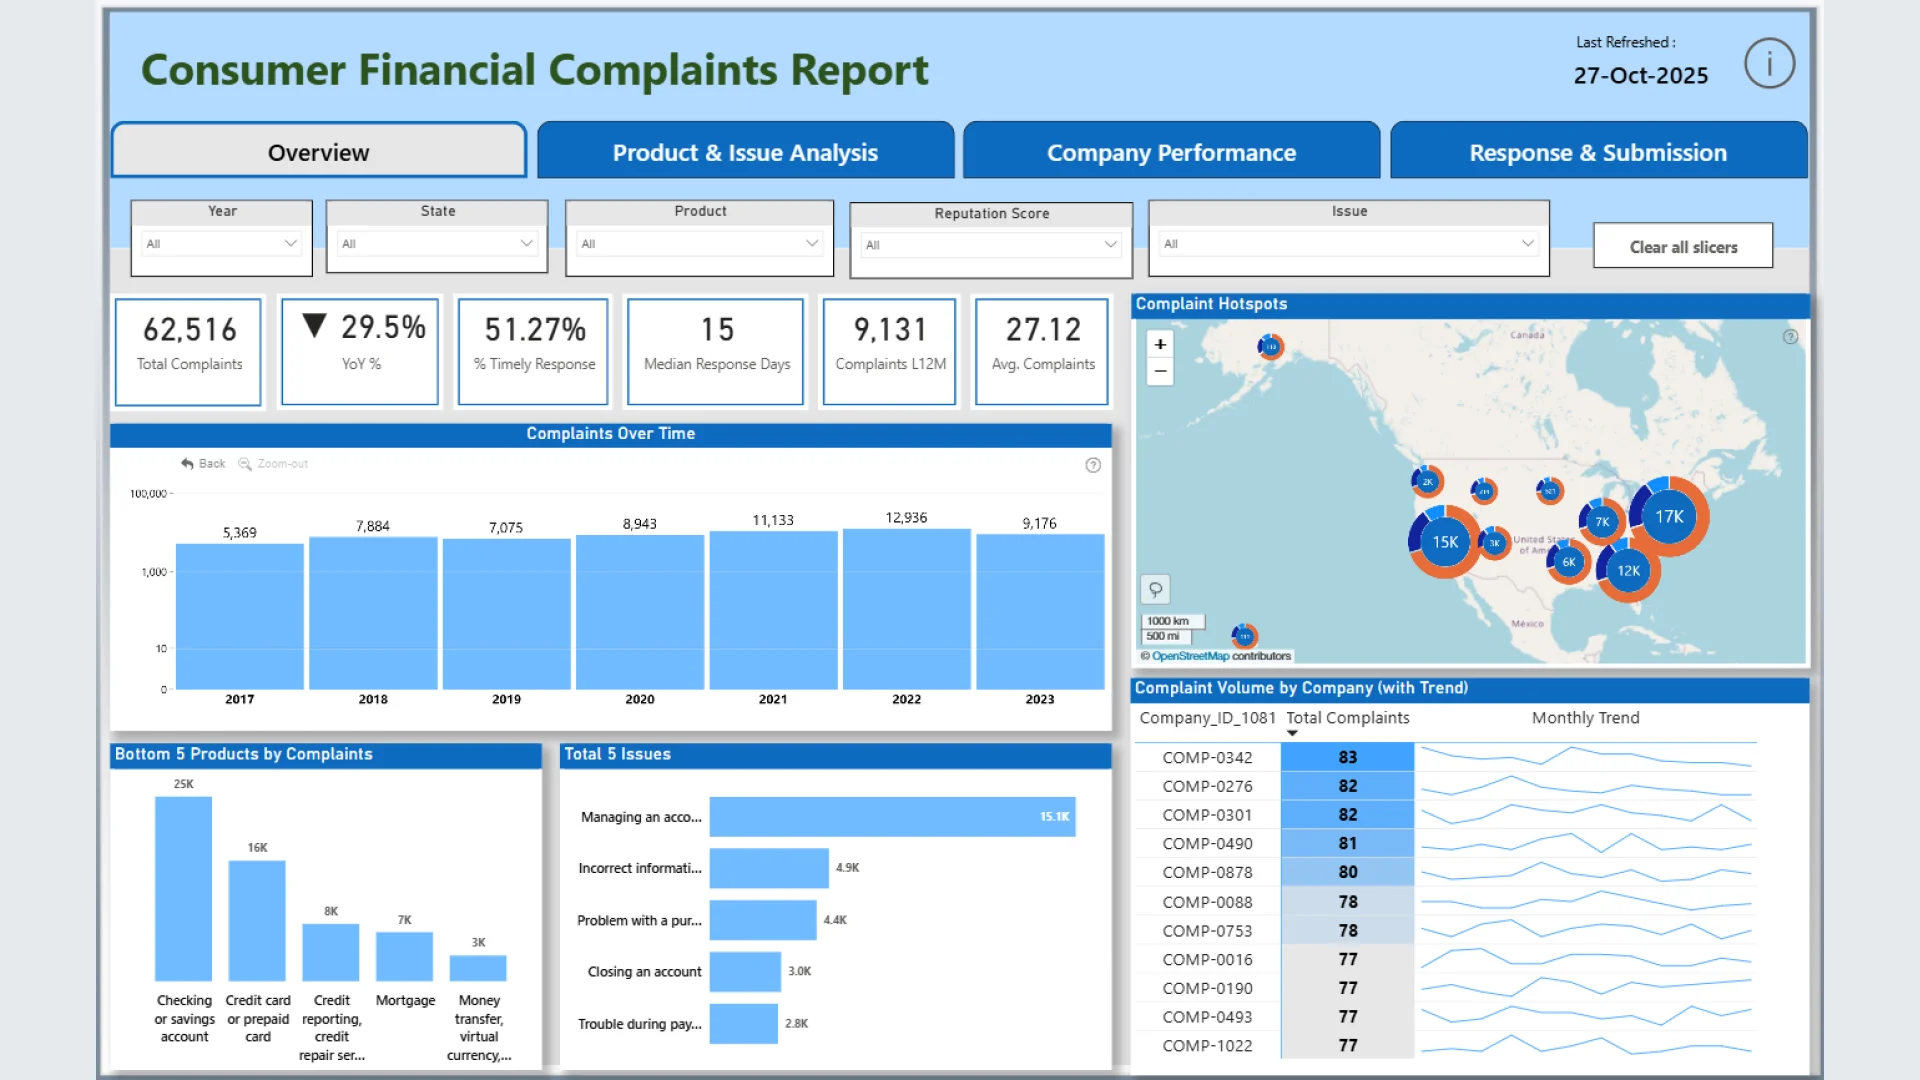
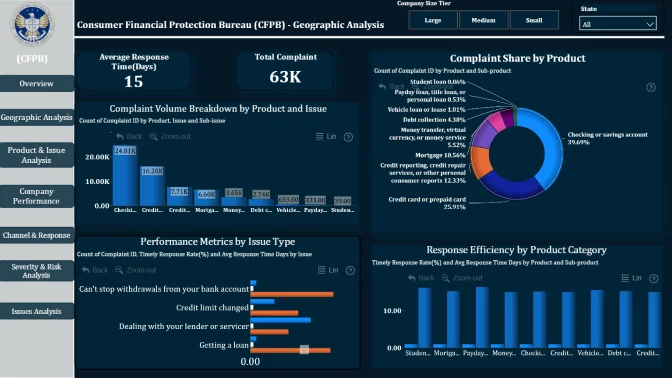
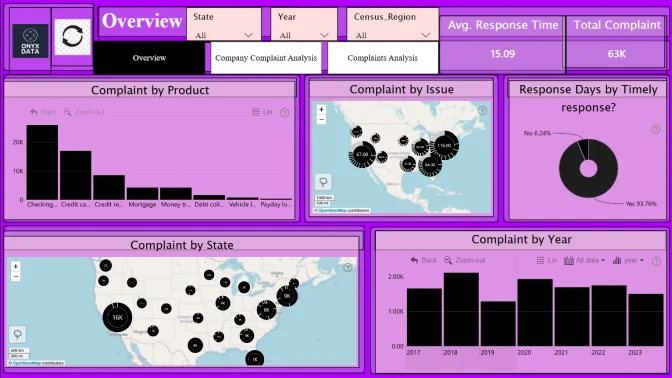
Your project focuses on building an end-to-end Power BI dashboard that analyzes customer complaints using various KPIs like complaint rate, response time.It integrates multiple data sources, cleans and consolidates them for accurate insights. The report includes interactive visuals, tooltips, and filters to compare company performance and identify key improvement areas.
ZoomCharts visuals used
4U Report Challenges
Participate in data challenges, build and submit reports to get free template downloads.
Join CommunityMobile view allows you to interact with the report. To Download the template please switch to desktop view.
Was this helpful? Thank you for your feedback!
Sorry about that.
How can we improve it?