625
Paralympic Games Reporting
Paralympic Games Reporting
More Report pages
Report Author: Hang Tran
625
Share template with others
Report submitted for Onyx Data DataDNA ZoomCharts Mini Challenge, September 2024. The report was built based on Paralympic Games dataset and includes ZoomCharts custom Drill Down PRO visuals for Power BI.
Author's description:
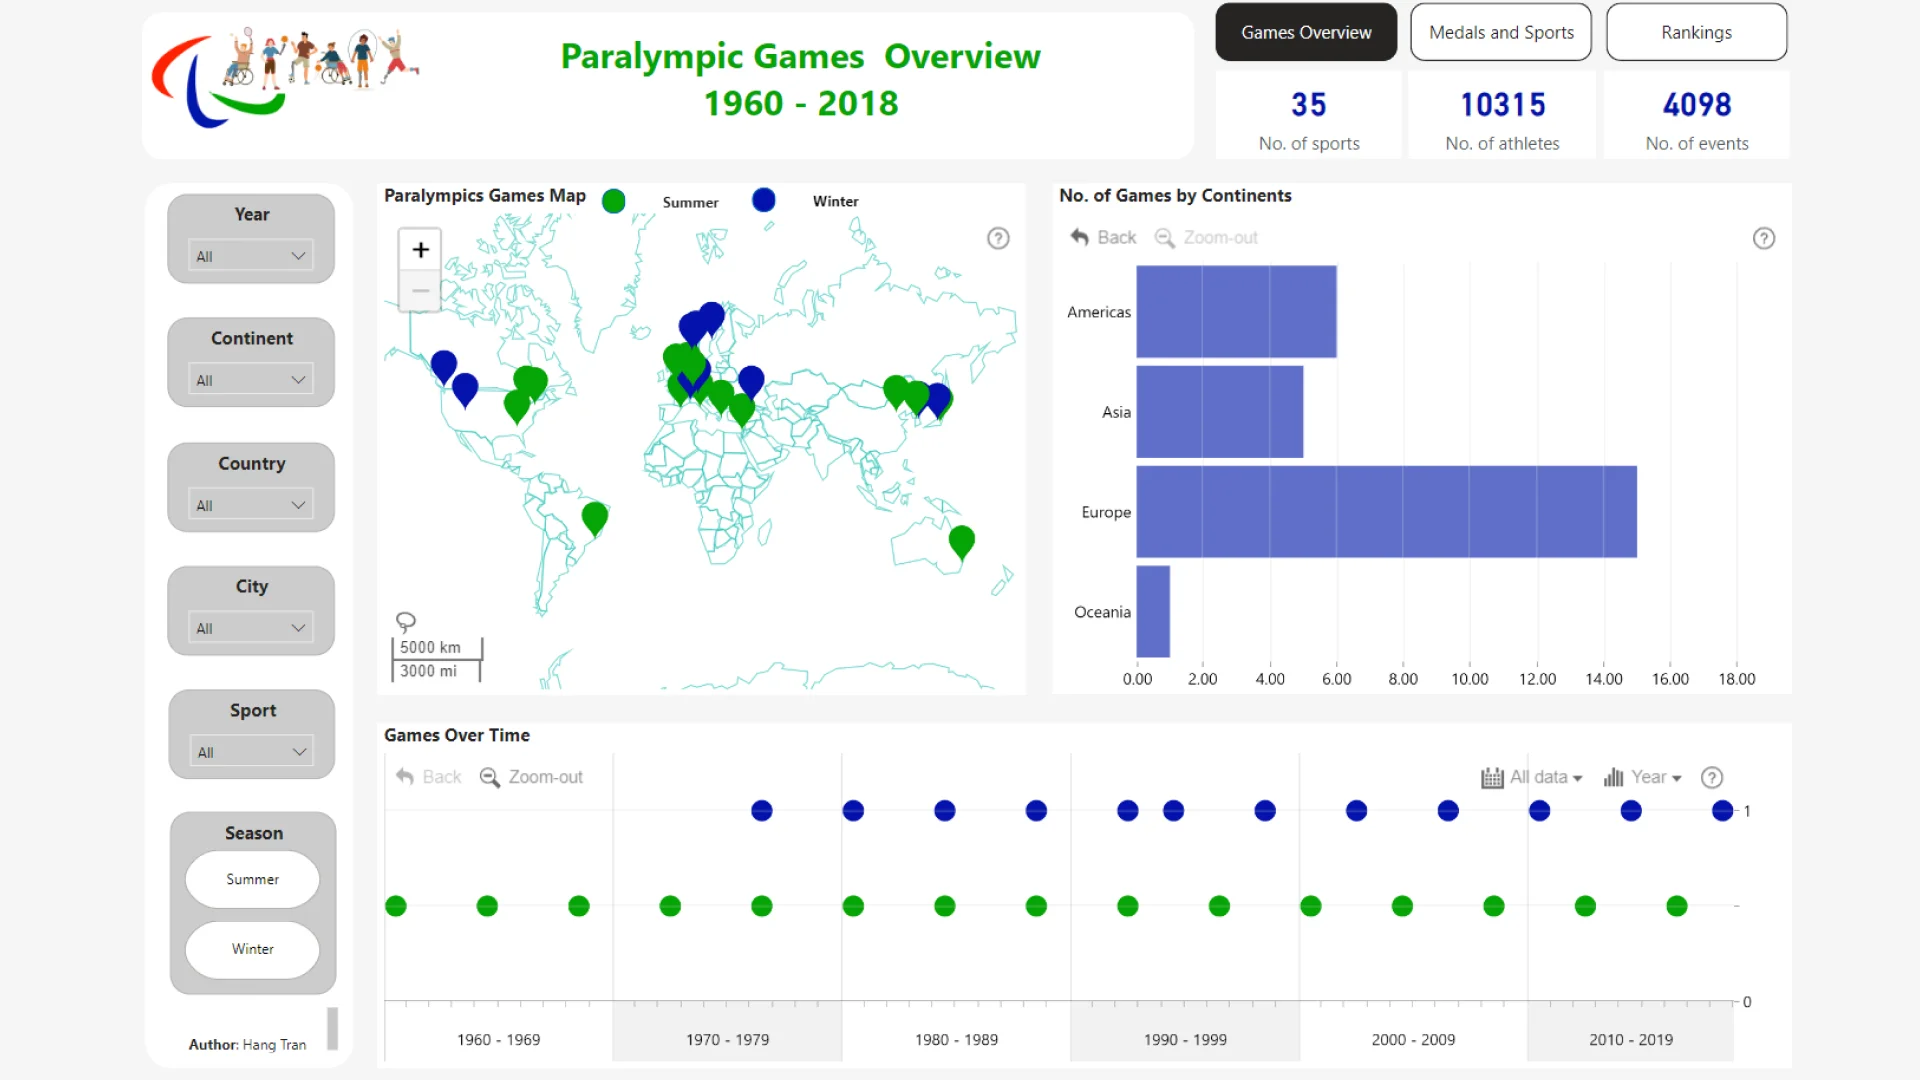
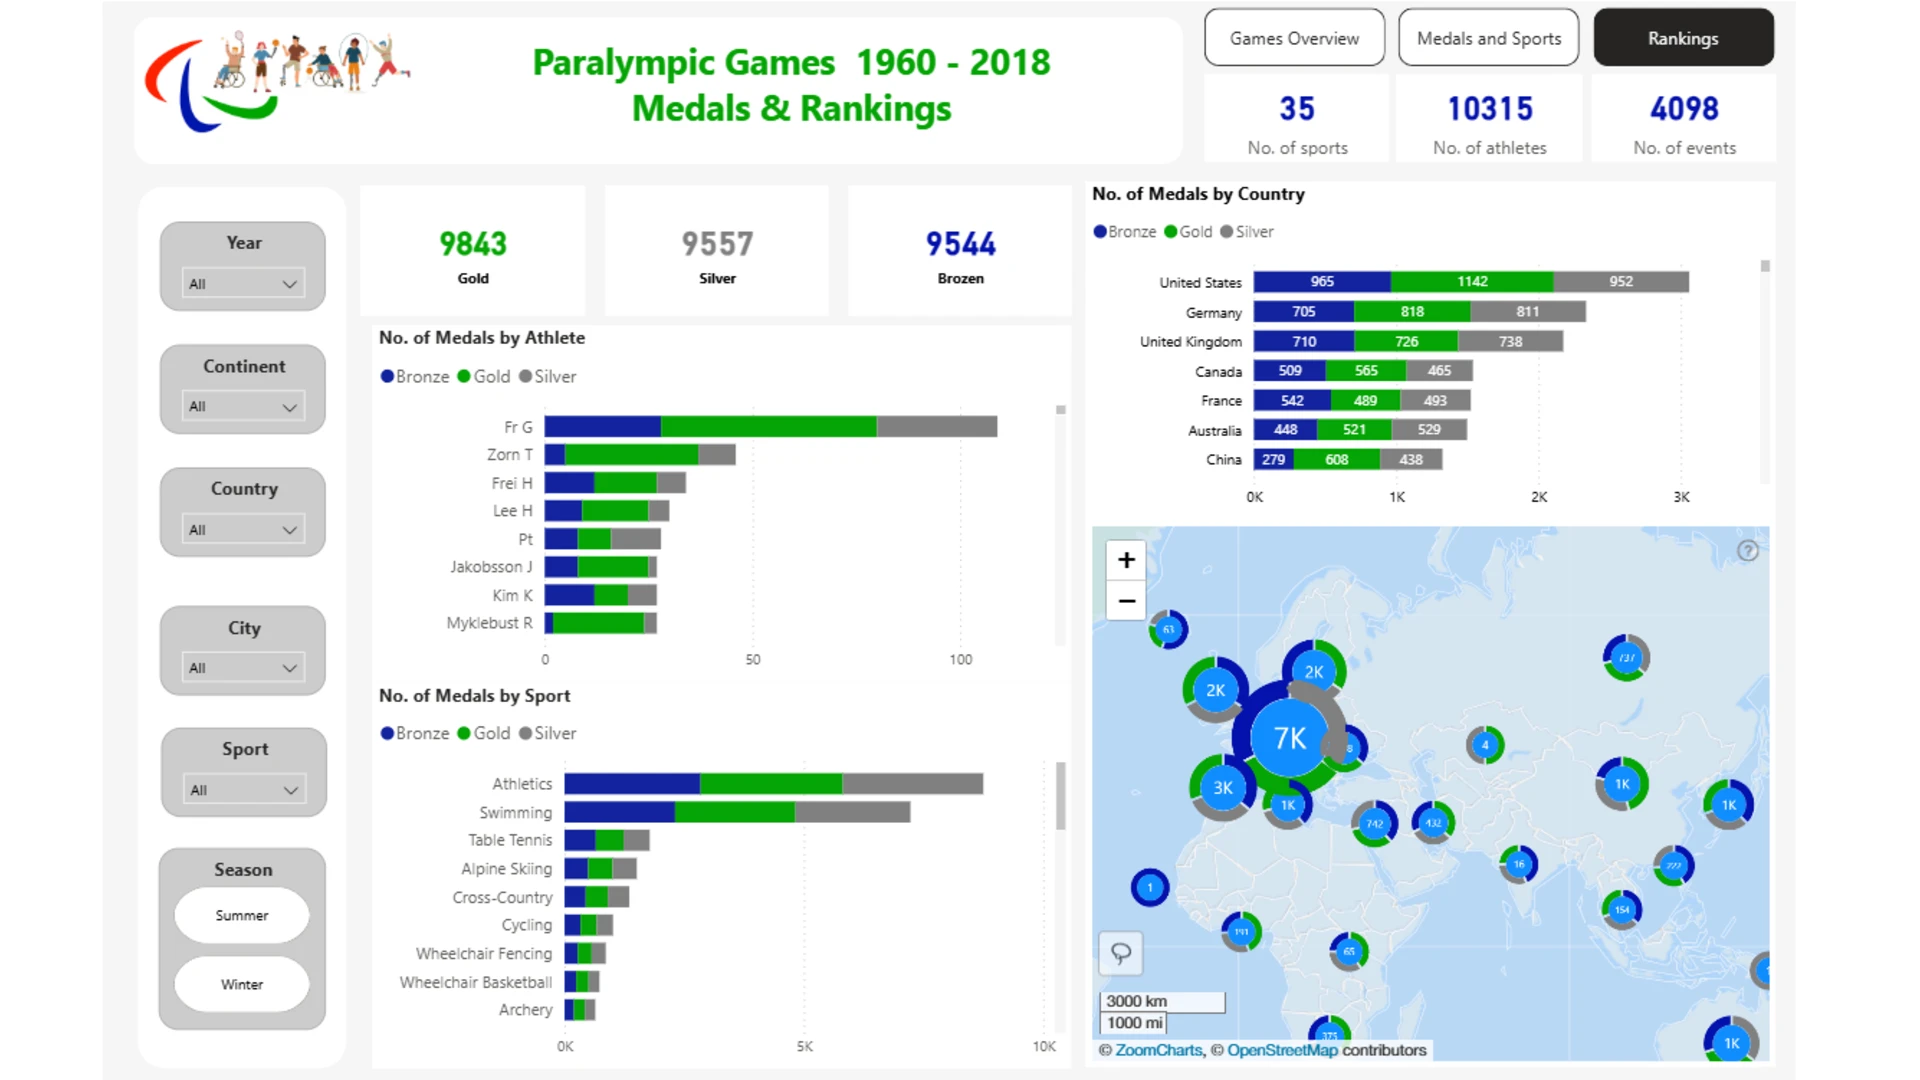
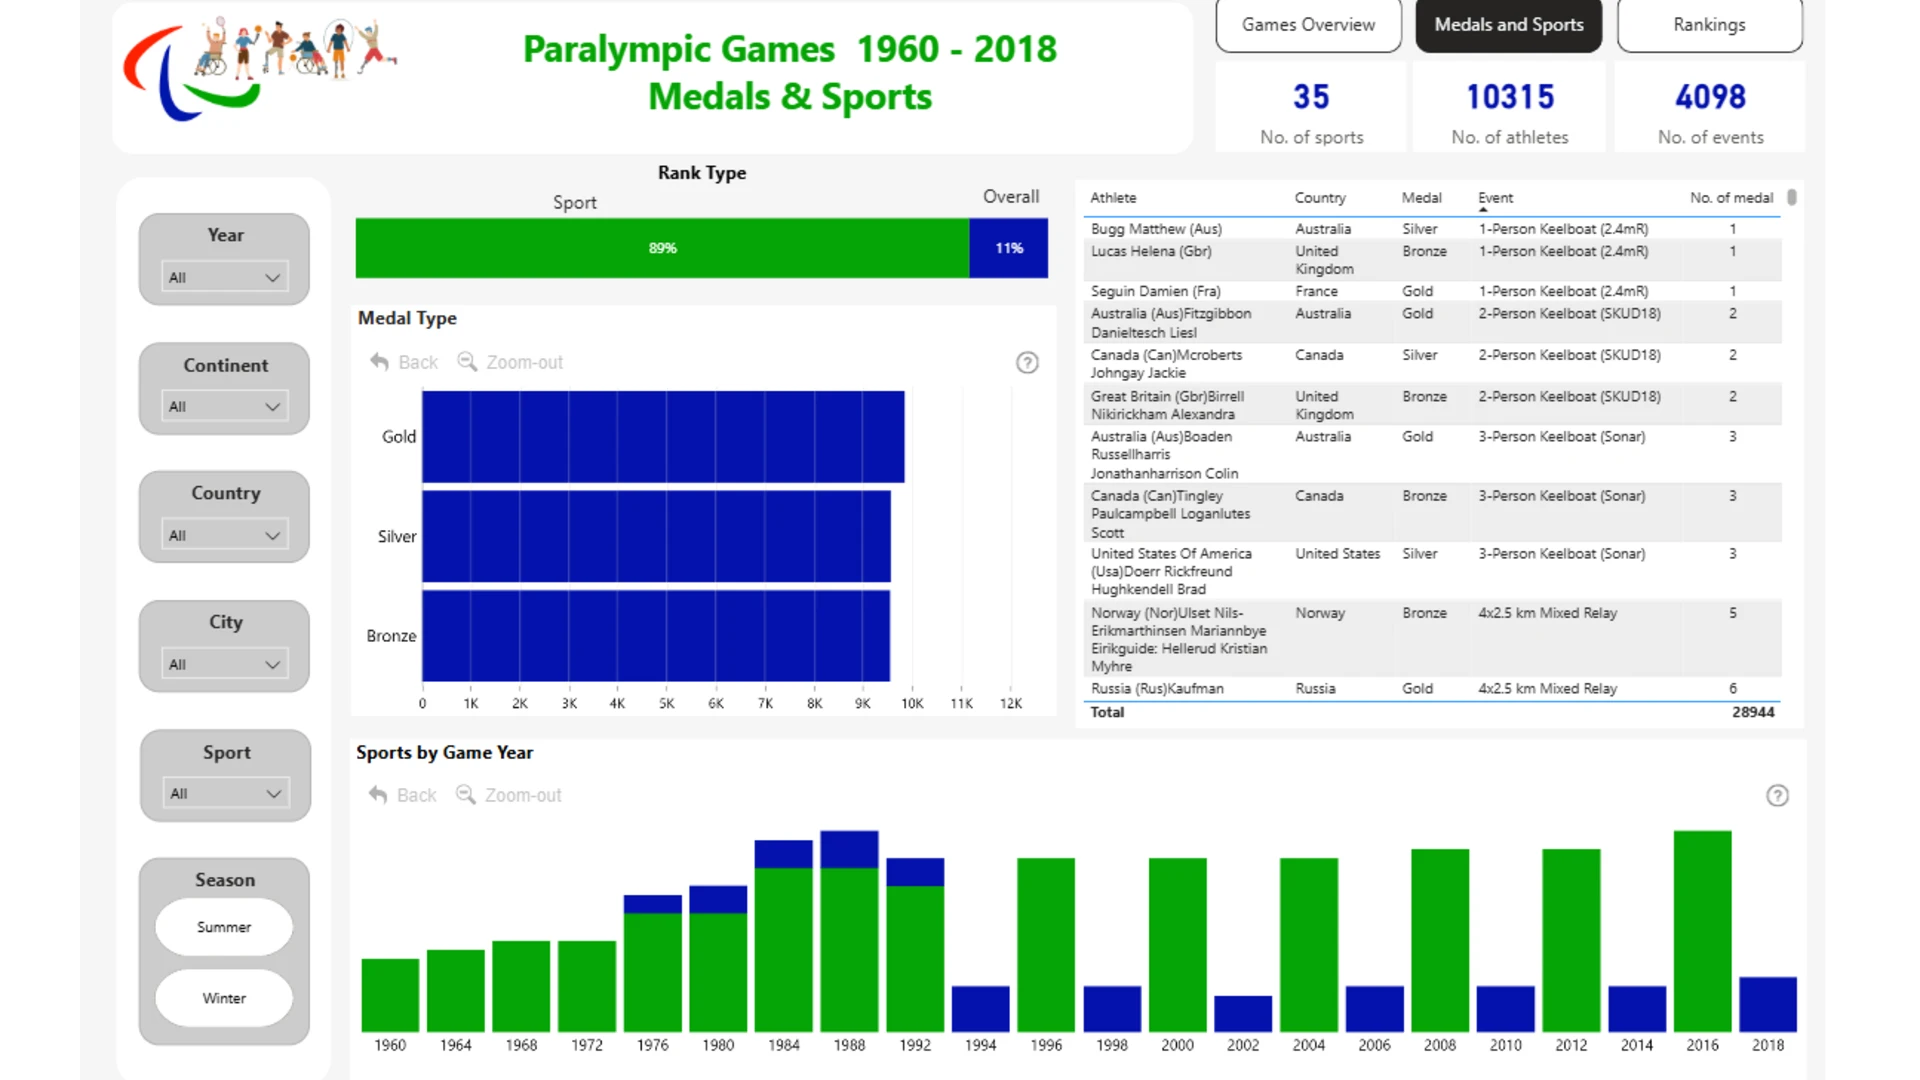
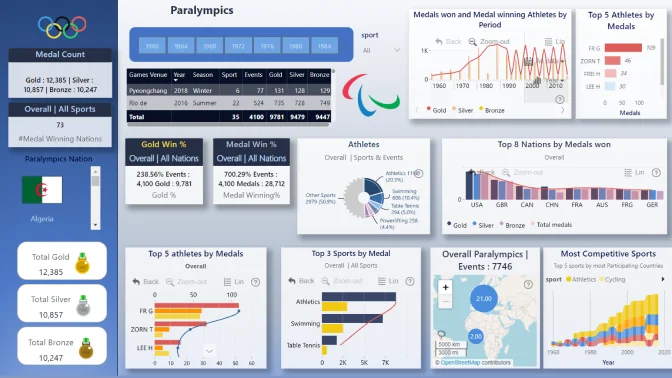
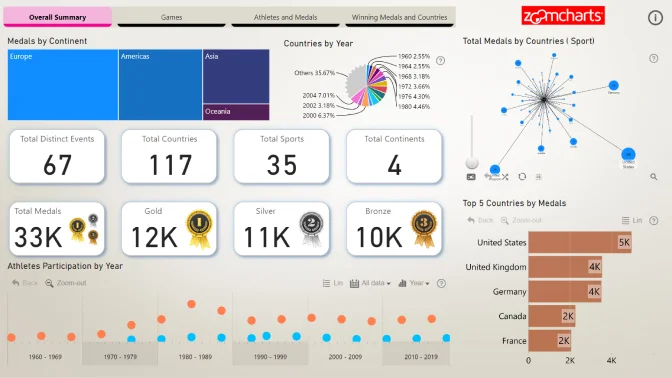
Paralympic Games Reporting used different drill-down visuals to tell stories, including which sports played most, which countries achieved more medals (gold, silver, bronze), and who (athletes) won more medals. Also, the reporting shows the games organised over the years between 1960 and 2018, explore which games seasons were organised in which countries, etc.
ZoomCharts visuals used
4U Report Challenges
Participate in data challenges, build and submit reports to get free template downloads.
Join CommunityMobile view allows you to interact with the report. To Download the template please switch to desktop view.
Was this helpful? Thank you for your feedback!
Sorry about that.
How can we improve it?