742
ZoomCharts Challenge Paralympics Dashboard
ZoomCharts Challenge Paralympics Dashboard
More Report pages
Report Author: Venugopal Varma Balraju
742
Share template with others
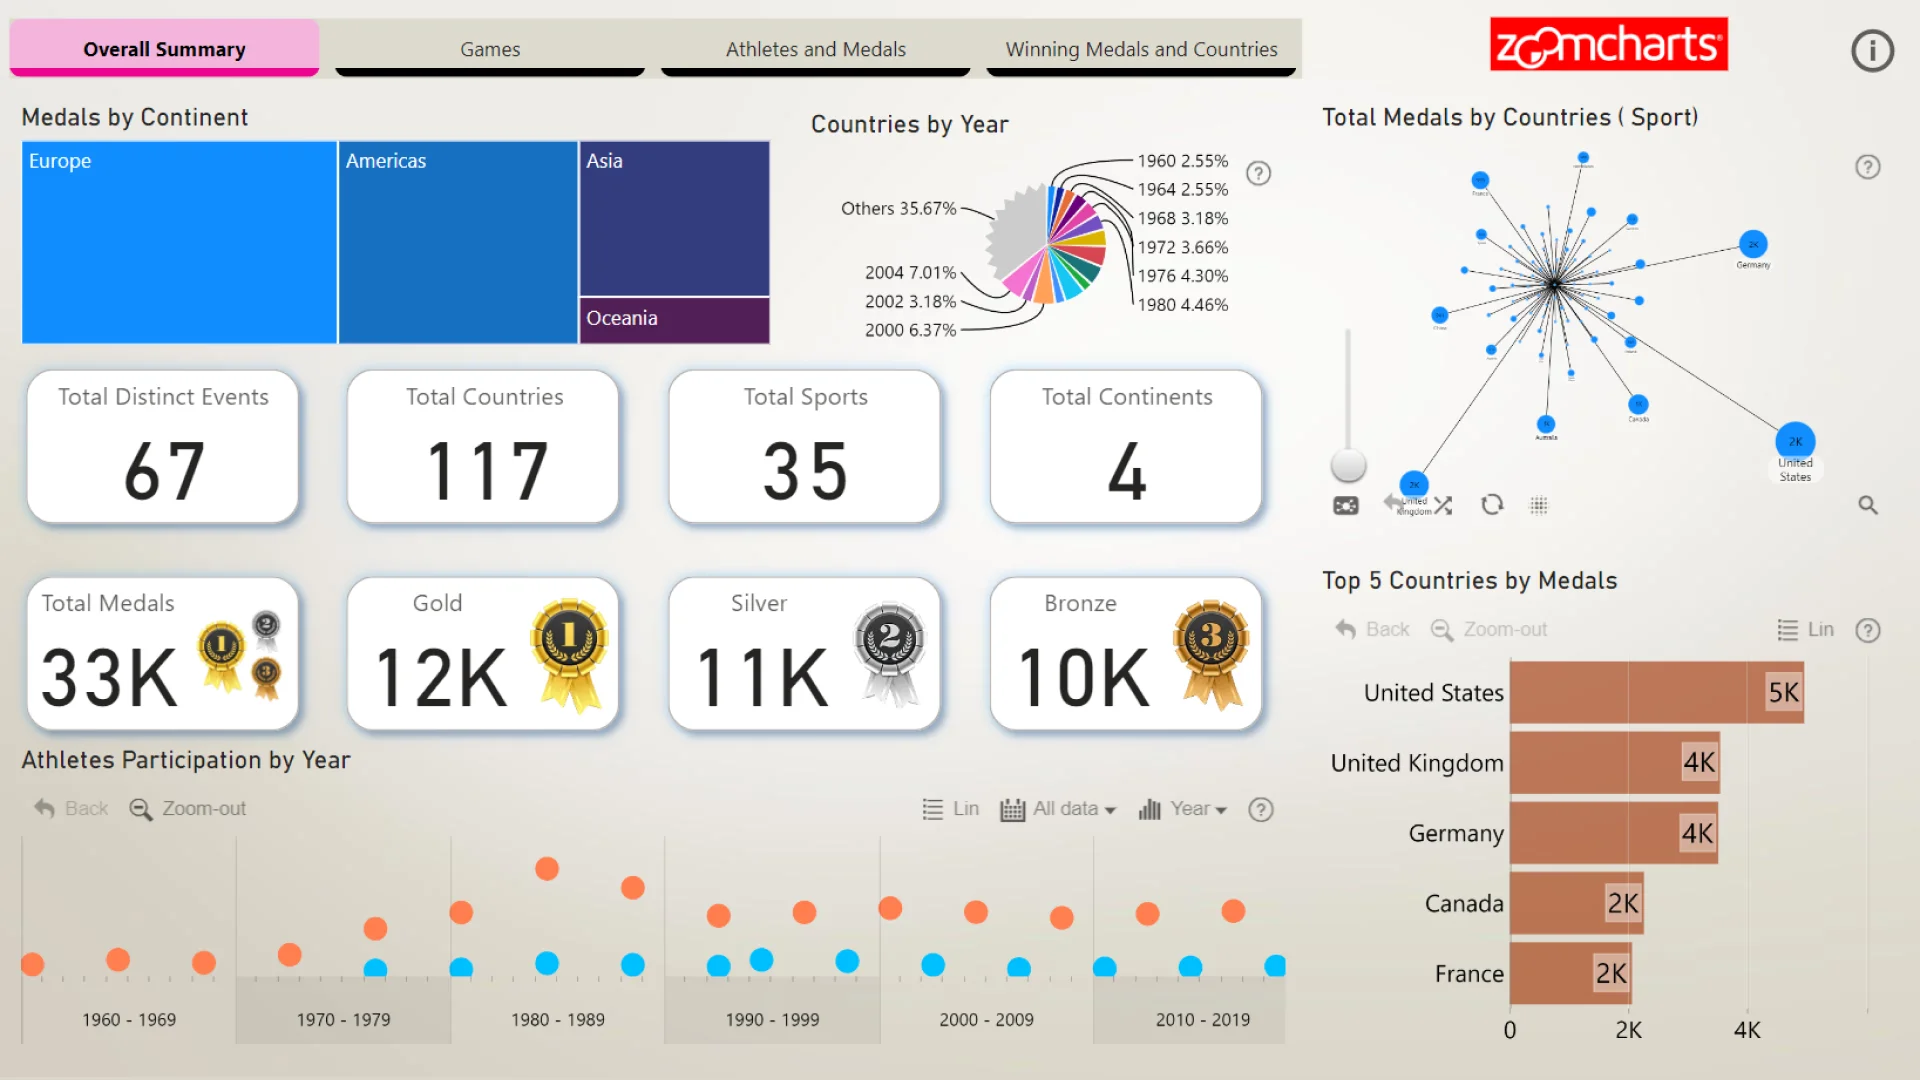
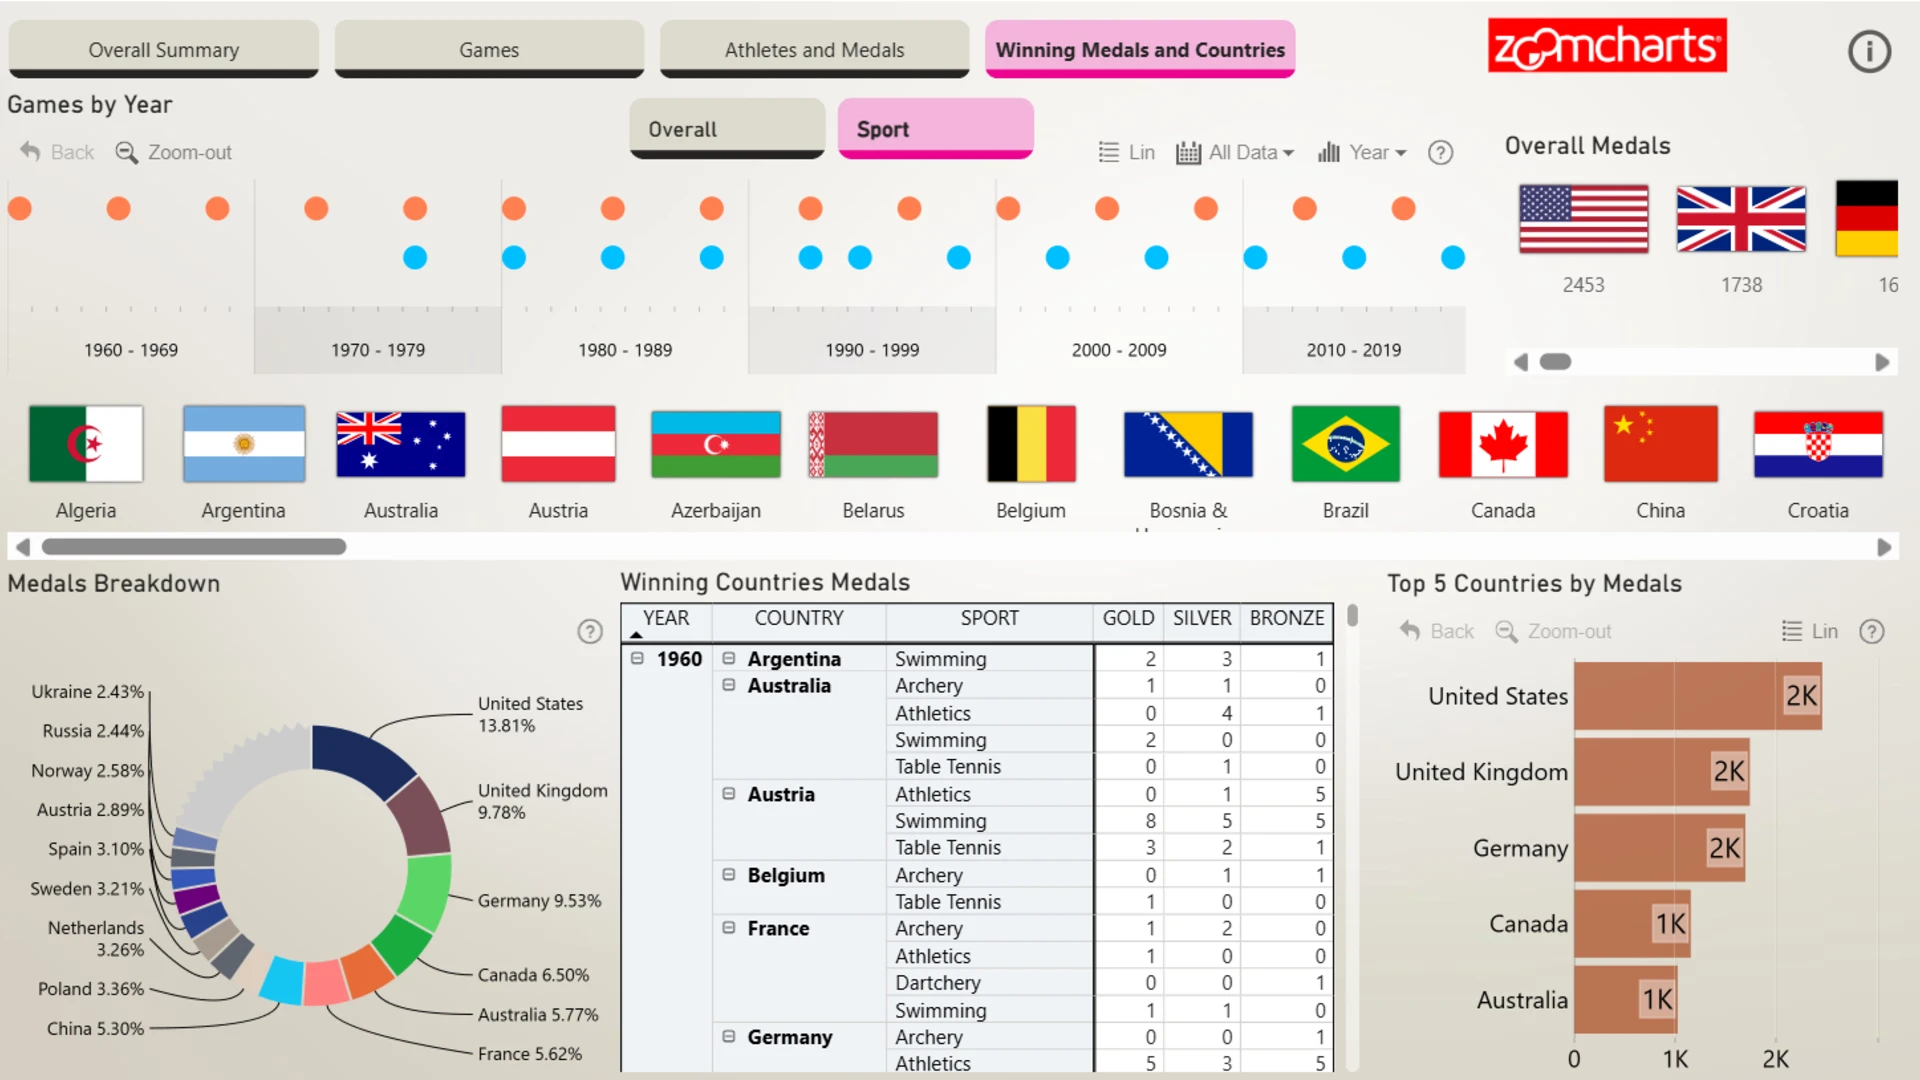
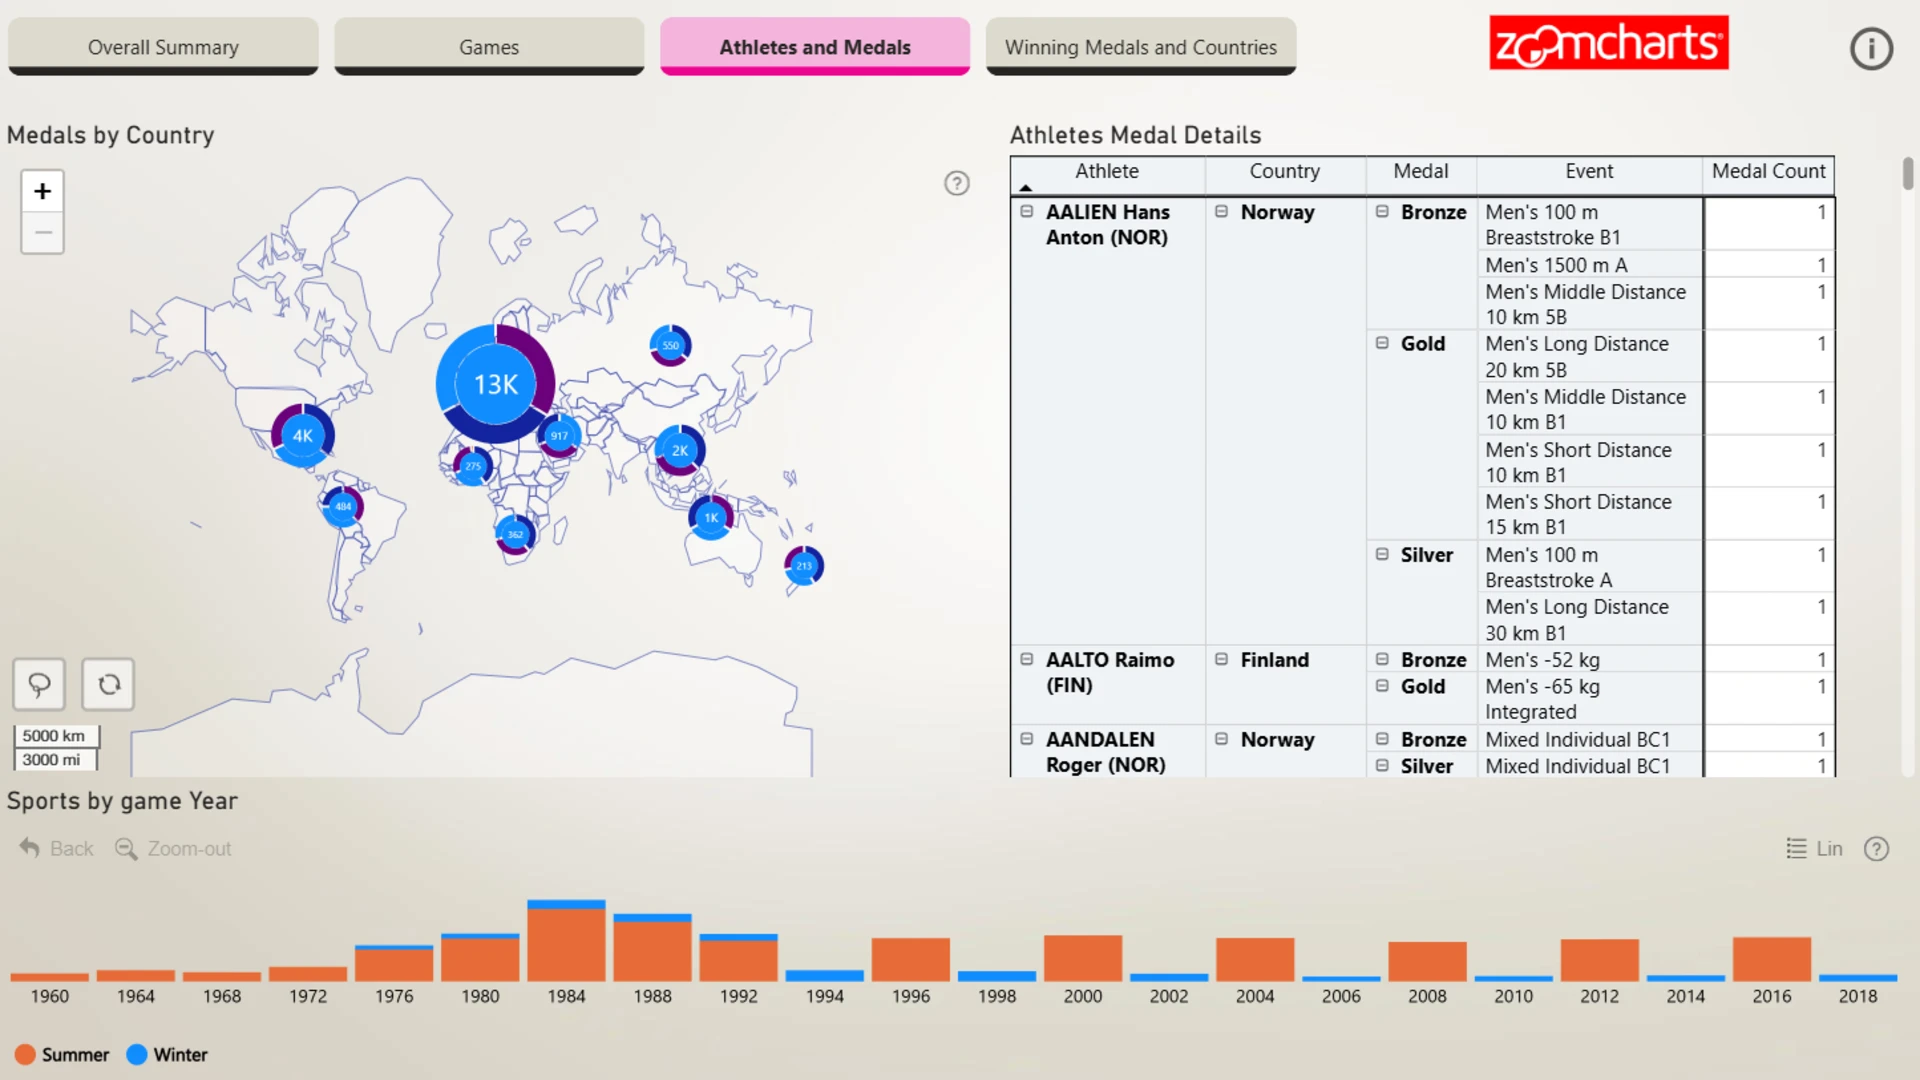
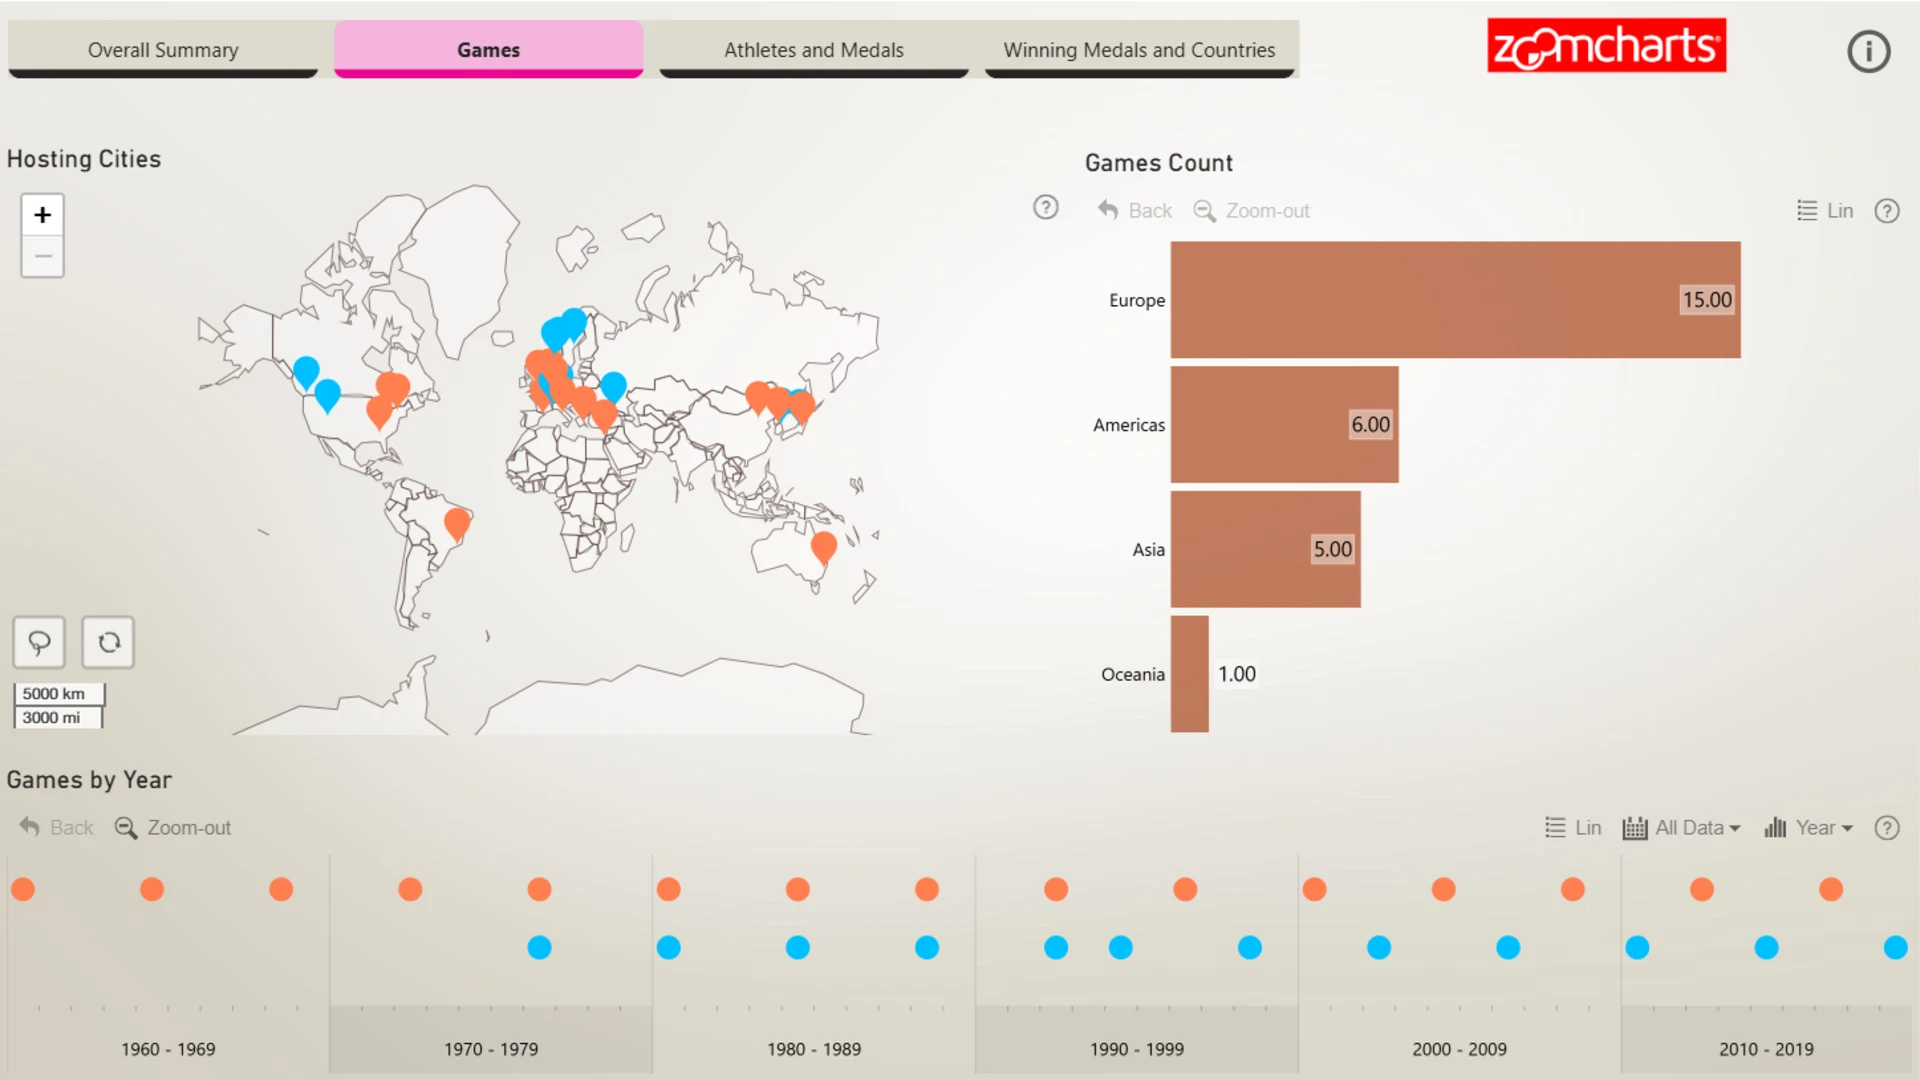
Report submitted for Onyx Data DataDNA ZoomCharts Mini Challenge, September 2024. The report was built based on Paralympic Games dataset and includes ZoomCharts custom Drill Down PRO visuals for Power BI.
Author's description:
The Zoom Charts Challenge Paralympics Dashboard provides an interactive and visually engaging platform for exploring the performance of various countries in the Paralympics. Users can analyze medal counts, rankings, and achievements across different sports, allowing for in-depth comparisons and insights. With dynamic visuals and customizable filters, the dashboard makes it easy to track trends and highlight standout performances in the Paralympic Games.
ZoomCharts visuals used
4U Report Challenges
Participate in data challenges, build and submit reports to get free template downloads.
Join CommunityMobile view allows you to interact with the report. To Download the template please switch to desktop view.


Was this helpful? Thank you for your feedback!
Sorry about that.
How can we improve it?