740
Marketing Campaign Performance Power BI Report
Marketing Campaign Performance Power BI Report
More Report pages
Report Author: Minautee Minautee
740
Share template with others
Report submitted for the FP20 Analytics ZoomCharts Challenge, October 2024. The report was built using the Marketing Email Campaign performance dataset and includes ZoomCharts custom Drill Down PRO visuals for Power BI.
Author's description:
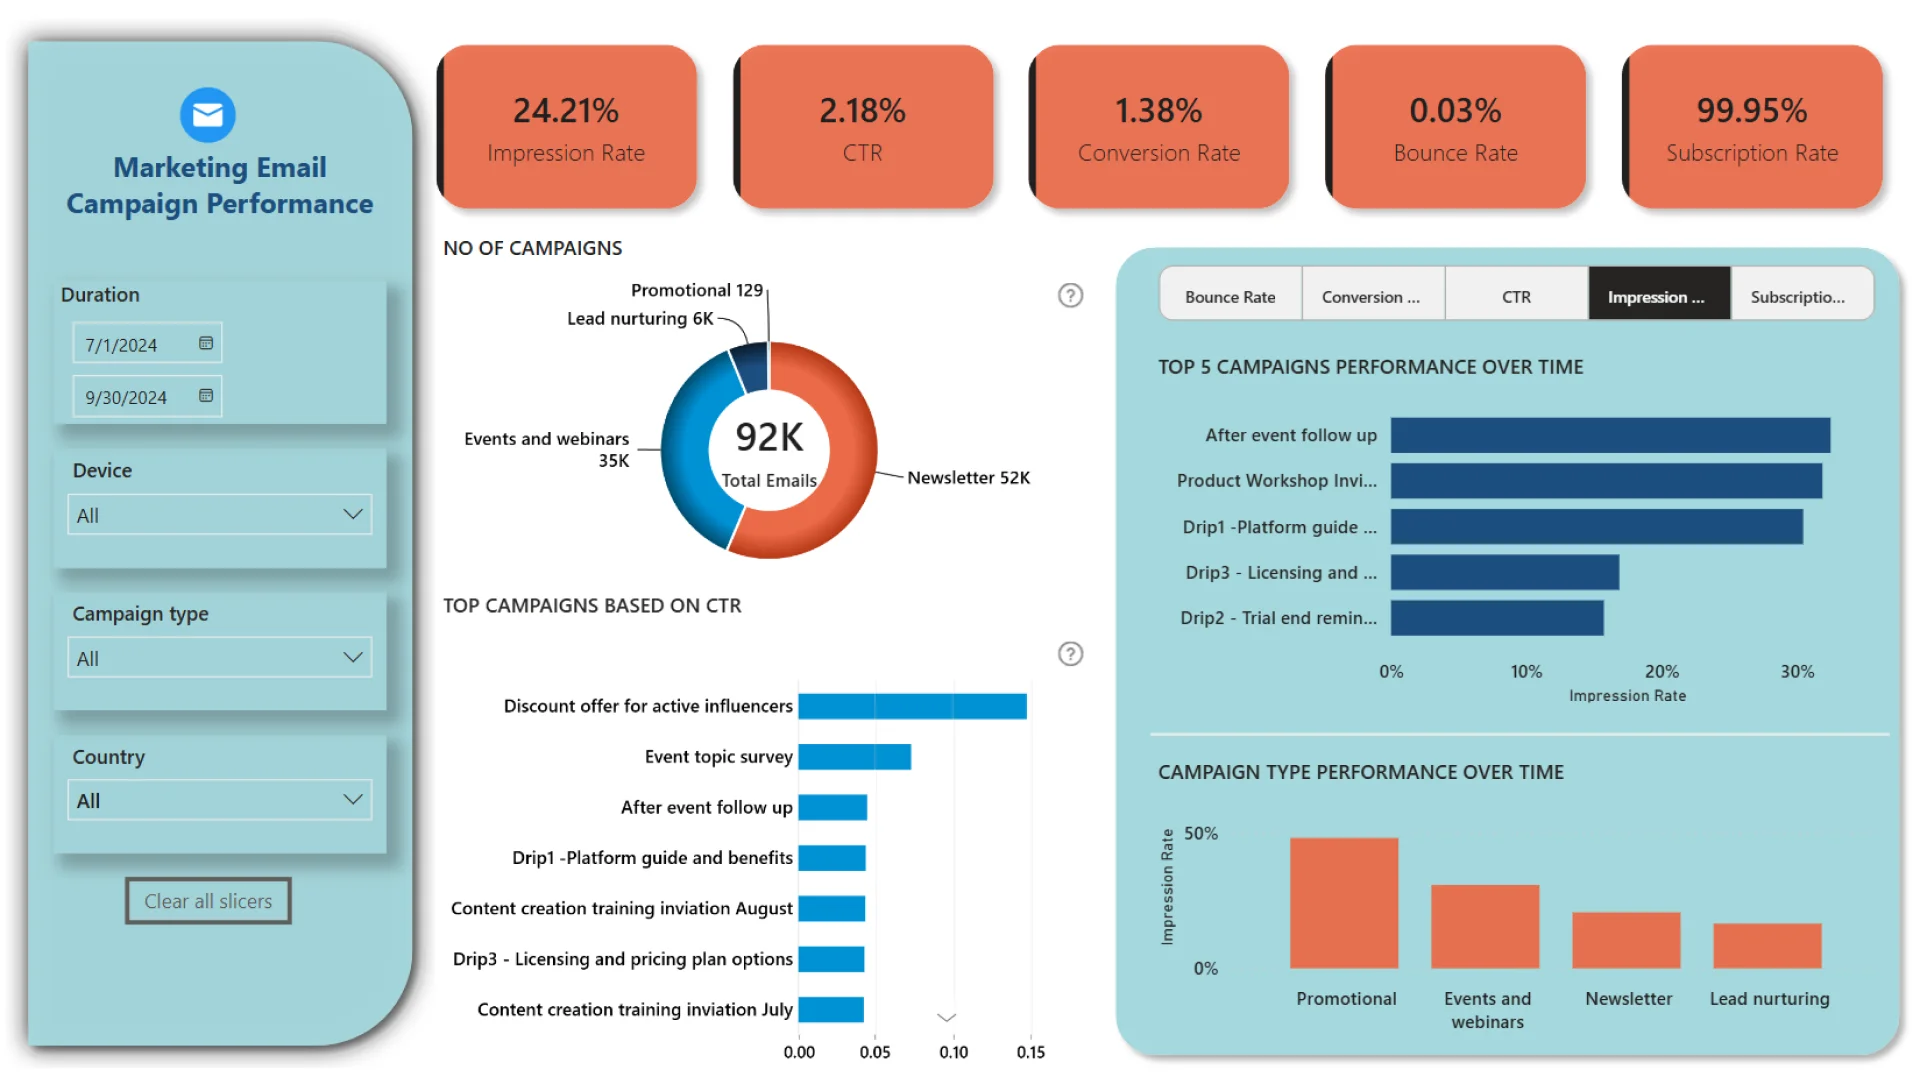
This dashboard provides an insightful overview of email marketing campaign performance, designed to help the marketing team assess and optimize the effectiveness of different campaign types. Key performance indicators (KPIs) such as Impression Rate, Click-Through Rate (CTR), Conversion Rate, Bounce Rate, and Subscription Rate offer a comprehensive view of campaign engagement and impact.
Key Metrics:
- Impression Rate - 24.21%: Measures campaign reach, indicating the percentage of emails viewed by recipients.
- Click-Through Rate (CTR) - 2.18%: Calculates the percentage of recipients who clicked on links within the emails, showing engagement levels.
- Conversion Rate - 1.38%: Reflects the success of campaigns in achieving conversion goals, such as purchases or sign-ups.
- Bounce Rate - 0.03%: Indicates email deliverability; a lower rate demonstrates effective list management.
- Subscription Rate - 99.95%: Measures the retention rate, showing the proportion of recipients who remained subscribed.
- Total Emails Sent - 92K: Represents the total number of emails sent across all campaigns during the selected period.
Campaign Types:
- Promotional: 129 campaigns
- Lead Nurturing: 6K emails
- Events and Webinars: 35K emails
- Newsletter: 52K emails
Top Campaigns by CTR:
Highlights the highest-performing campaigns based on click-through rates, including:
- "Discount Offer for Active Influencers" at 14.73%
- "Event Topic Survey" at 7.27%
Drill-Through Feature:
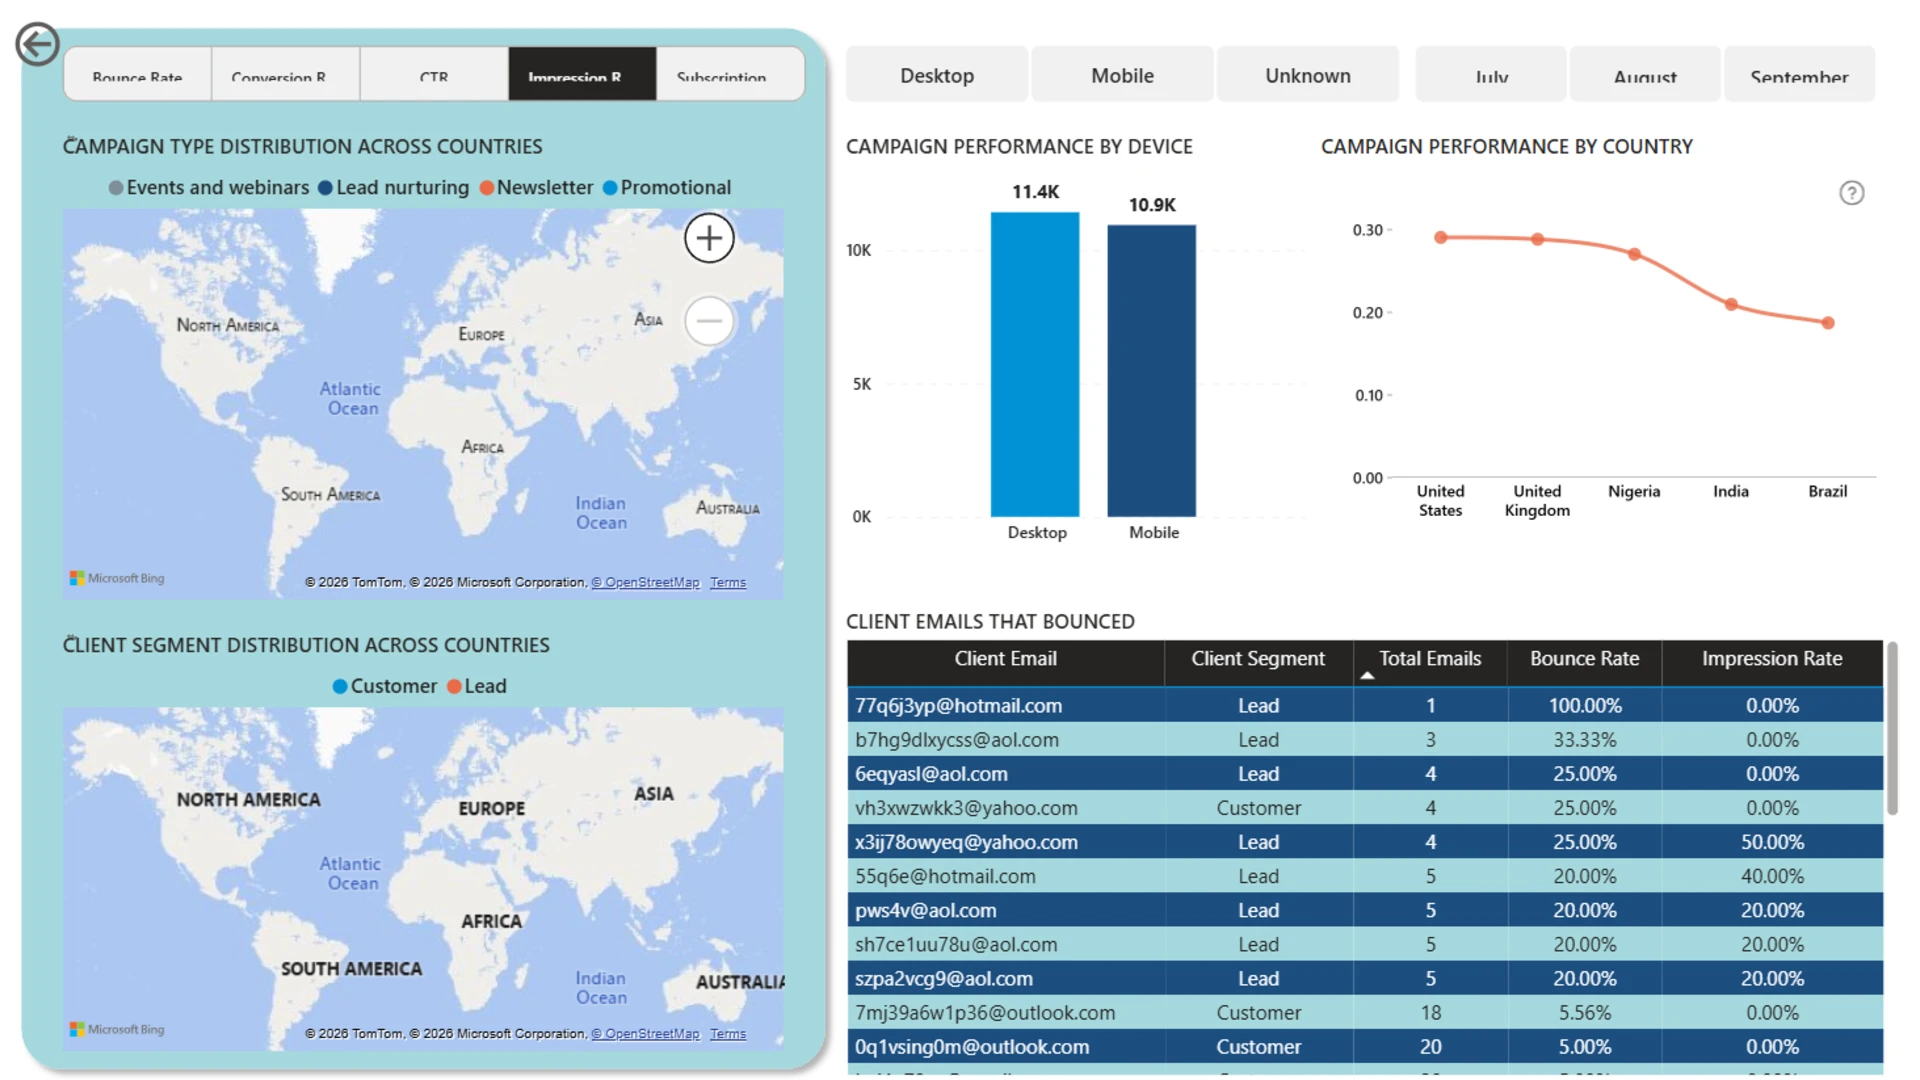
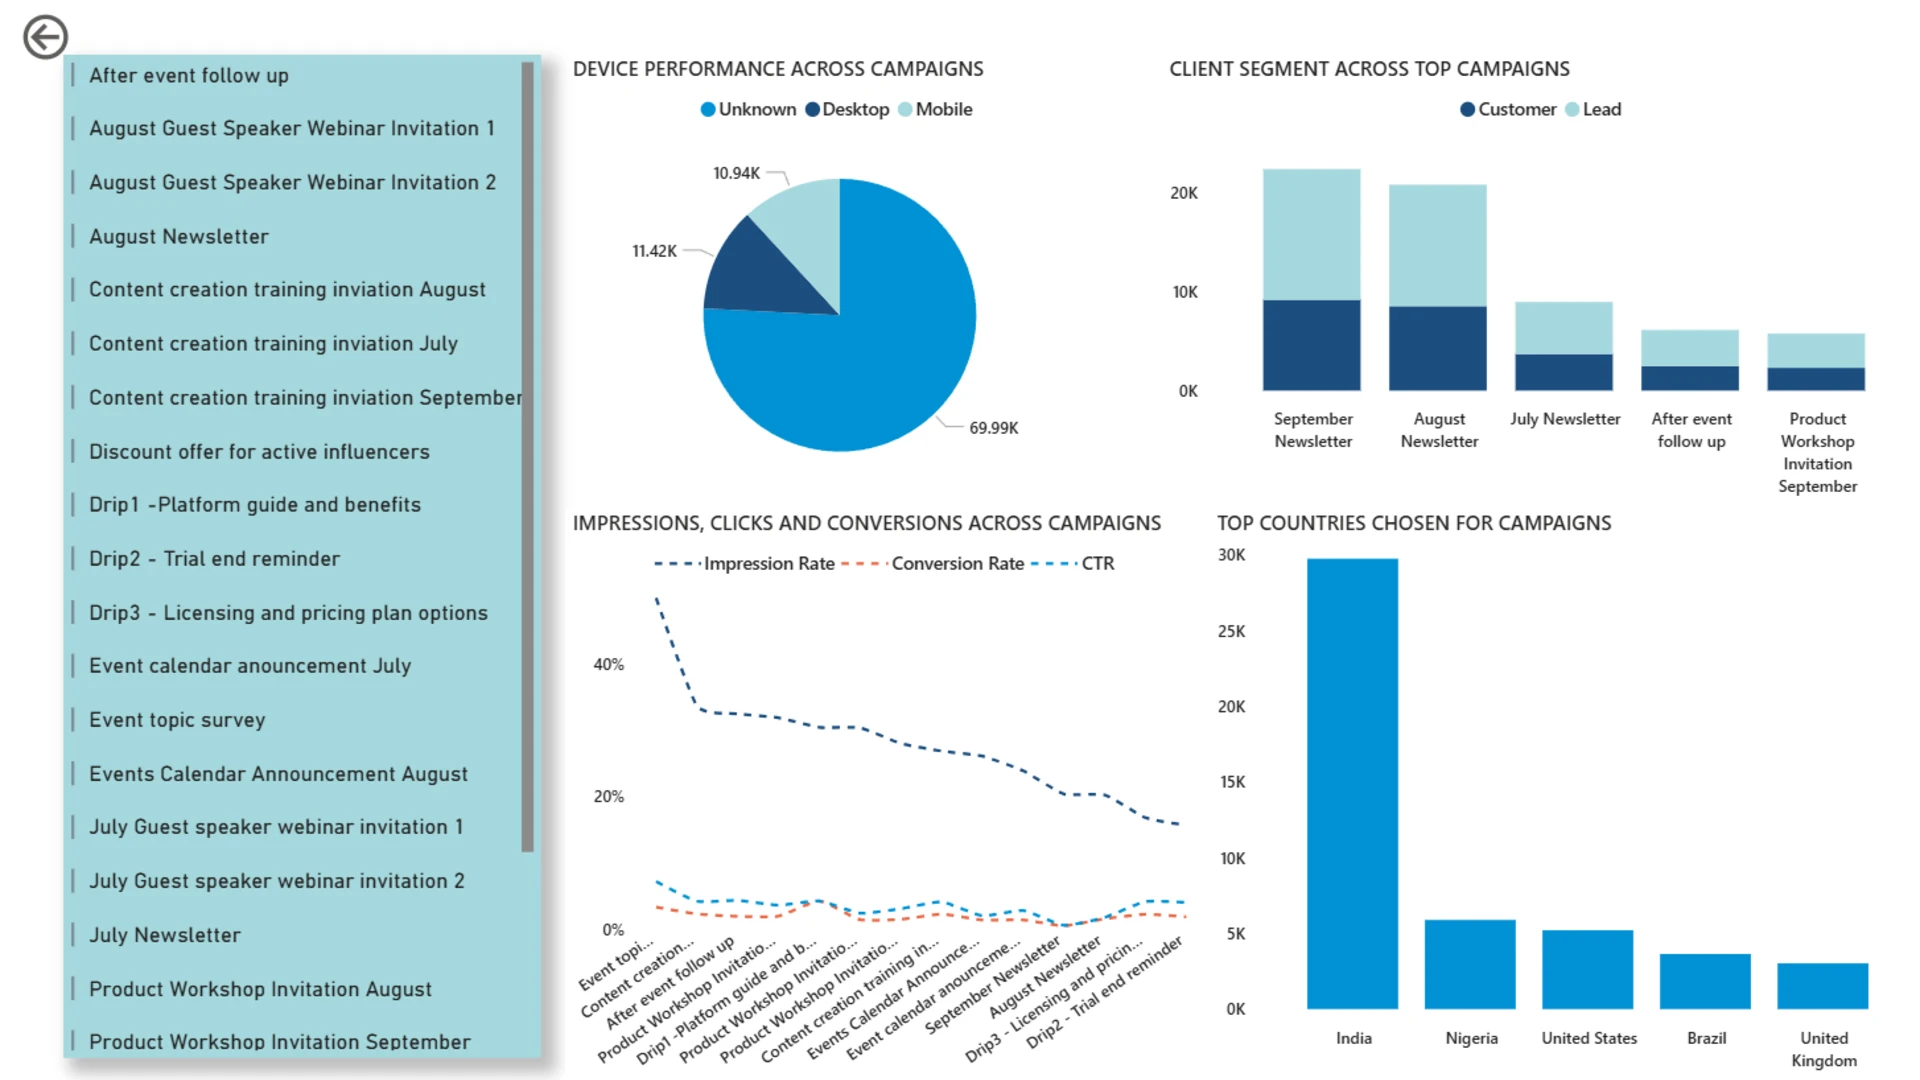
The dashboard includes a drill-through feature on campaign types, allowing users to dive deeper into the performance of individual campaigns within each category (e.g., Promotional, Events and Webinars, Newsletters, and Lead Nurturing). Users can access detailed insights such as CTR, impression rate, and conversion performance, aiding in targeted campaign analysis.
Conclusion:
This dashboard addresses ad hoc questions related to the performance of marketing emails, while providing an extensive and comprehensive analysis of campaigns across devices, countries, and client segments. It enables a deeper understanding of what resonates best with the audience, guiding data-driven decision-making for future campaigns.



4U Report Challenges
Participate in data challenges, build and submit reports to get free template downloads.
Join CommunityMobile view allows you to interact with the report. To Download the template please switch to desktop view.
How to use a PBIX template
Preview the interactive report, download the PBIX file, open it in Power BI Desktop, and replace the same data connection with your own dataset.
Preview and download
Explore the report online and download the PBIX template file.
Open in Power BI Desktop
Open the downloaded PBIX file in Power BI Desktop.
Connect your data
Replace the sample data source with your own dataset.
Refresh and adjust
Refresh the model and update fields or visual were needed.
Save and share
Save your report and publish it for your audience.


