logo
For Power BI Report Templates
  • Products

    Drill Down Visuals for Power BI

    Discover the most customizable custom visuals for Power BI.

    Pricing & licensing
    • Drill Down Donut Pro
      Drill Down Donut Category Composition
    • Drill Down Pie Pro
      Drill Down Pie Proportional Breakdown
    • Drill Down Combo Pro
      Drill Down Combo Multi-Metric Trends
    • Drill Down Combo Bar Pro
      Drill Down Combo Bar Cross-Metric Trends
    • Drill Down Line Pro
      Drill Down Line Trend Analysis
    • Drill Down Bubble Pro
      Drill Down Bubble Value Relationships
    • Drill Down Scatter Pro
      Drill Down Scatter Correlation Analysis
    • Drill Down Network Pro
      Drill Down Network Entity Connections
    • Drill Down Graph Pro
      Drill Down Graph Relationship Mapping
    • Drill Down Map Pro
      Drill Down Map Geographic Insights
    • Drill Down Waterfall Pro
      Drill Down Waterfall Change Breakdown
    • Drill Down Timeline Pro
      Drill Down Timeline Time-Based Metrics
    • Drill Down TimeSeries Pro
      Drill Down TimeSeries Temporal Patterns
    • Drill Down Line Pro
      Drill Down Line Trend Analysis

    Visuals in Planning

    Discover visuals we’re exploring, share your feedback, and help us decide what to build next.

    Browse concepts
  • Template Reports
    • Browse Report Templates
      Browse Report Templates Explore 2000+
      Power BI reports
    • Pricing Report Templates
      unlimited access

    Explore Report Templates

    Industry

    • Logistics
    • Education
    • Healthcare
    • Transportation
    • Banking
    • Ecommerce
    • Crime analytics
    • Retail
    • Manufacturing

    Business Domain

    • Sales
    • Marketing
    • Accounting & Finance
    • Human Resources
    • Research
    • Project Management
    • CRM
    • Support
    • Customer experience
  • Resources

      Learn

    • Video Tutorials Step-by-step Power BI guides
    • Webinars Live and recorded expert sessions
    • Visuals Gallery Explore all custom Power BI visuals
    • Blog Power BI tips, updates, and guides
    • Documentation Setup, features, and API reference

    Support

    • ZoomCharts Assistance Help from our product experts
    • Contact Sales Questions about pricing or licensing
    • Contact Support Technical help and troubleshooting
    • FAQ Quick answers to common questions
  • Services
    • Power BI Report Development
      Power BI Report Development End-to-end custom
      Power BI reports.
    • Custom Visual Development
      Custom Visual Development Custom visuals for
      your business needs.
  • Challenges
  • Pricing
Get started
Get started
Get it now
Go back

Contents

Dashboard and report examples Executive Dashboard Example in Power BI
Go back

1766

Executive Dashboard Example in Power BI

Executive Dashboard Example in Power BI

Report
Report
Report

More Report pages

Report
Report
Report
Report
Report
Report
Report Interact

Report Author: Sweety Antoni David

1766

Combo Combo Bar Waterfall KPI

Share template with others

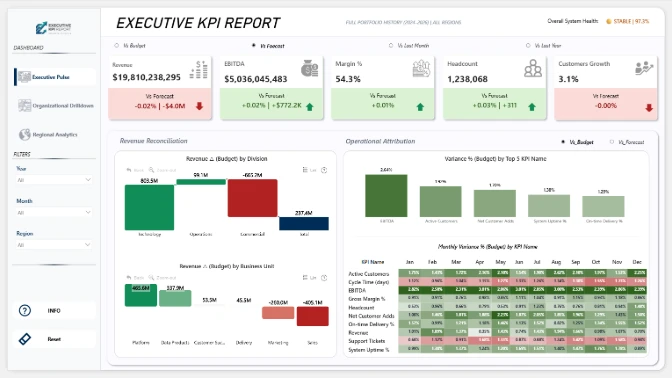
This executive dashboard example shows how Power BI can be used to monitor business performance, KPI variance, revenue trends, regional results, and organizational drivers in one interactive dashboard.

Built with ZoomCharts Drill Down custom visuals for Power BI, the dashboard highlights key executive KPIs such as revenue, EBITDA, gross margin %, net customer adds, headcount, budget variance, forecast gap, and regional performance. The report was submitted to the ZoomCharts “4U Reports Challenge” in April 2026.

The dashboard is designed for executives, finance leaders, business analysts, and regional managers who need a clear way to compare actual vs. budget vs. forecast results and understand what is driving performance across regions and business units.

What you can analyze

Use this Power BI executive dashboard to track:

  • Revenue, EBITDA, gross margin %, headcount, and net customer adds
  • Actual vs. budget vs. forecast performance
  • Budget variance and forecast gaps
  • Revenue trend analysis over time
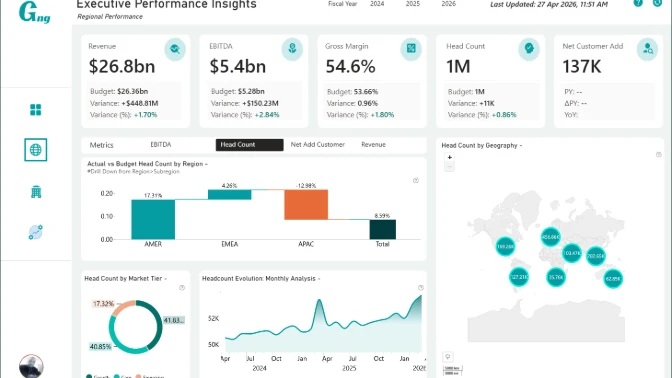
  • Regional performance across EMEA, APAC, and AMER
  • KPI variance by business unit
  • Favorable and unfavorable KPI performance
  • Country-level performance rankings
  • Executive scorecard results
  • Operational and financial performance drivers

Dashboard pages

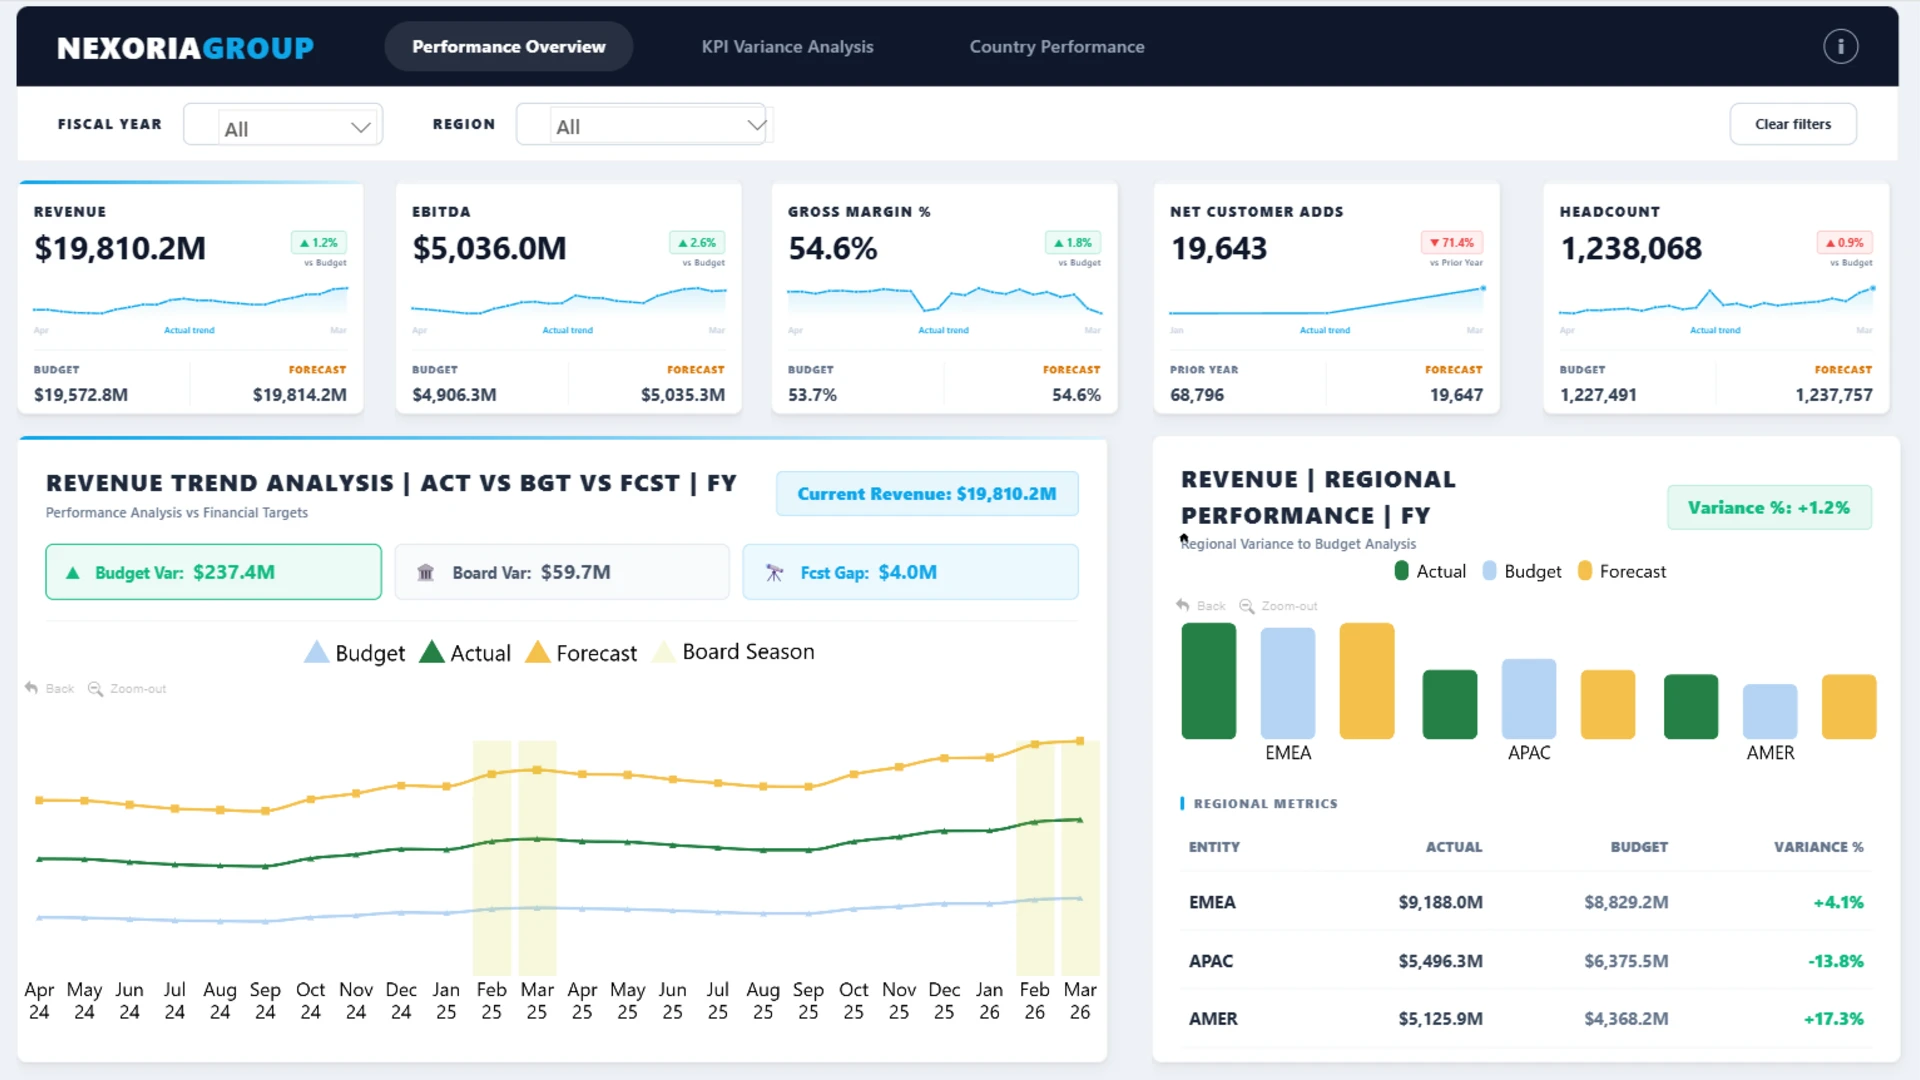
  • Performance overview: monitor top-level executive KPIs, revenue trends, budget variance, forecast gaps, and regional performance.
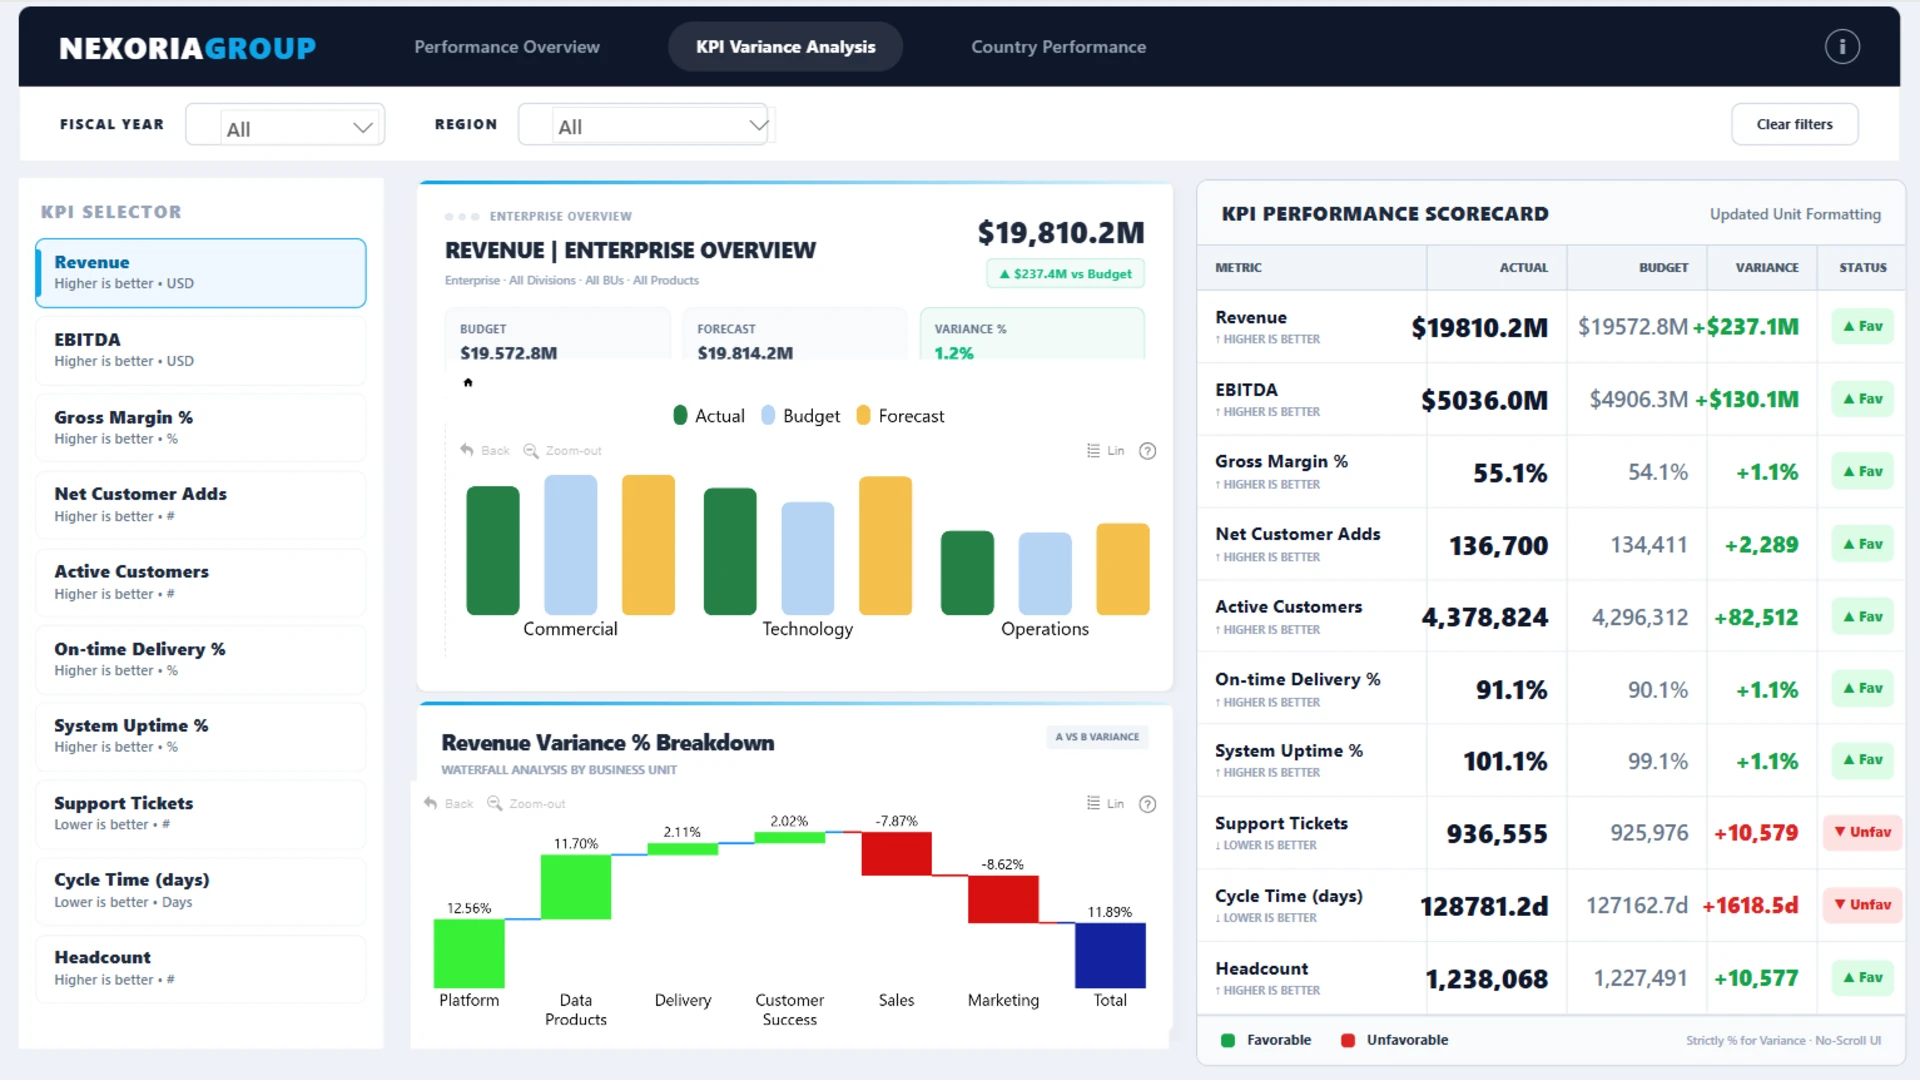
  • KPI variance analysis: compare financial and operational KPIs against budget, review the KPI performance scorecard, and analyze variance drivers by business unit.
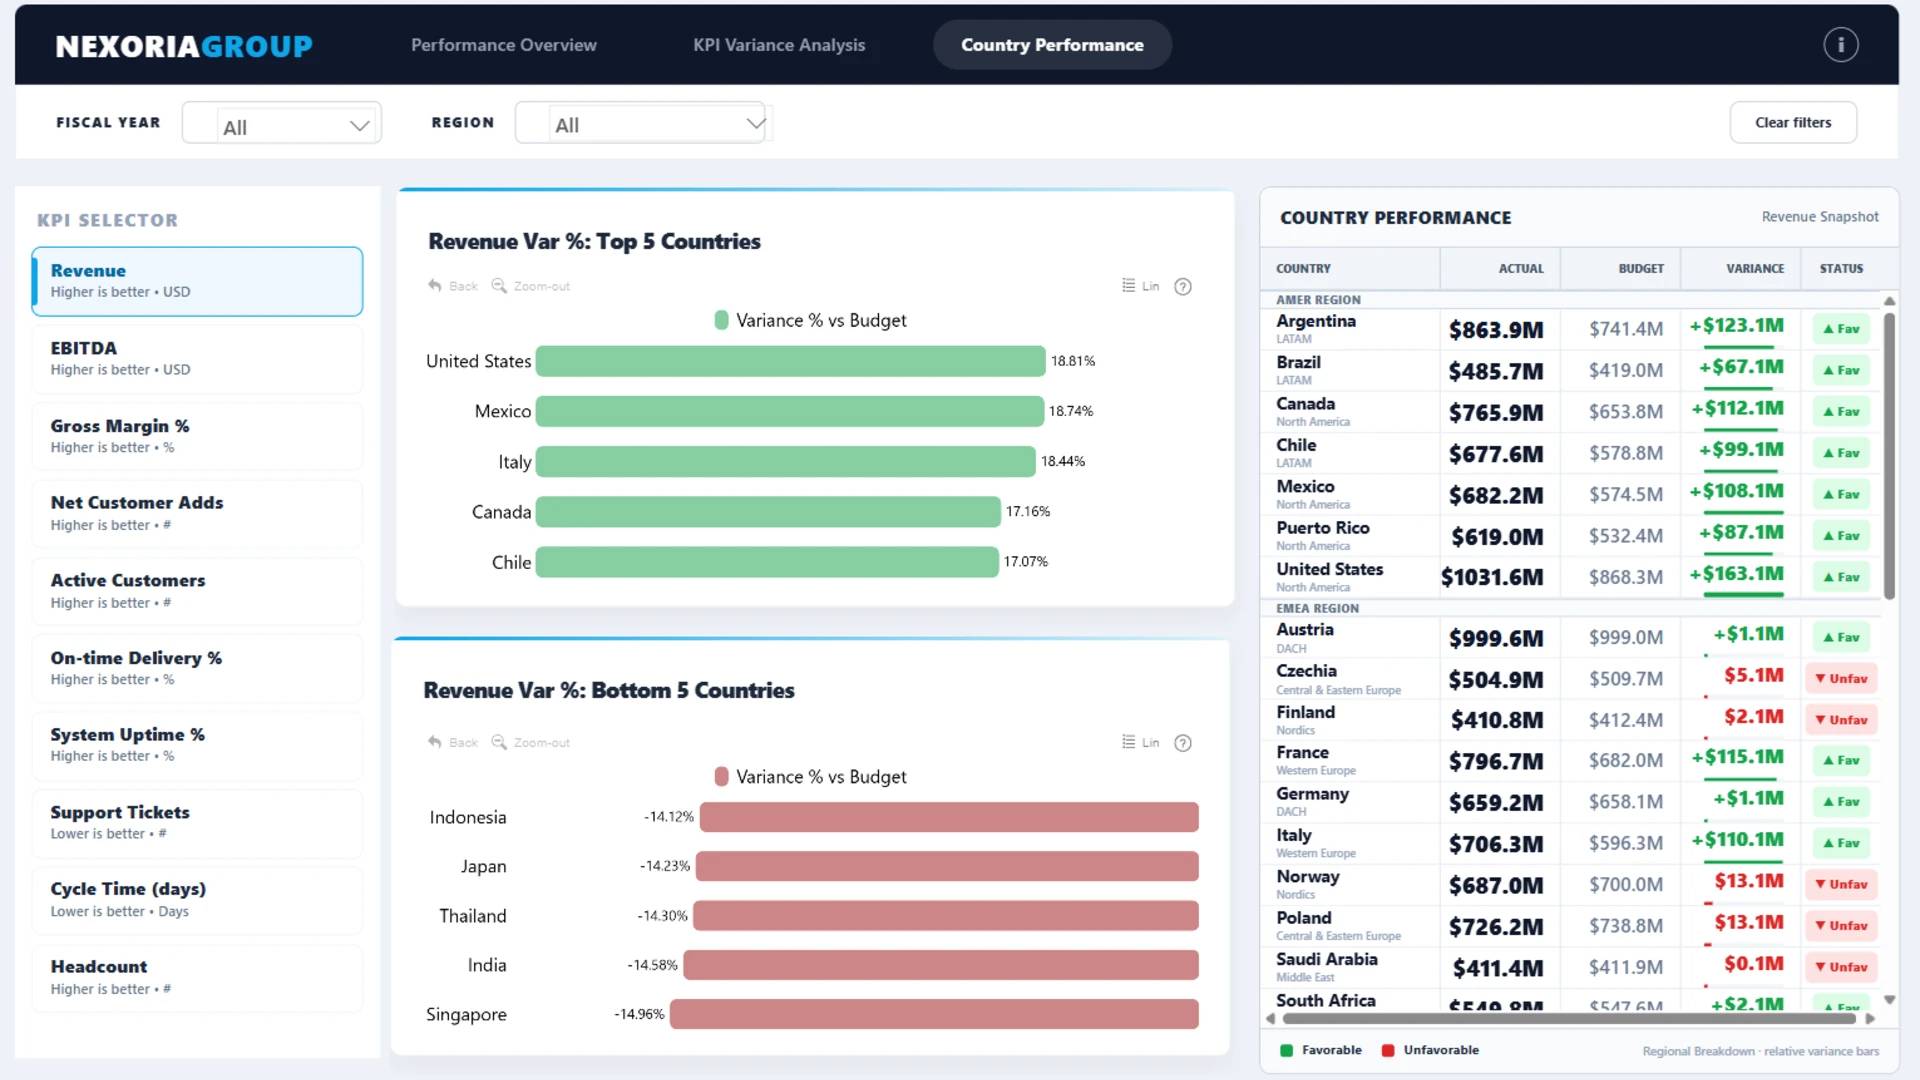
  • Country performance: explore country-level results, regional rankings, and geographic performance patterns.

Interactive features

This dashboard uses ZoomCharts Drill Down custom visuals for Power BI to support interactive executive analysis. Users can filter by fiscal year and region, switch between KPI views, compare actual results with budget and forecast, drill into regional and business-unit performance, and use the clear filter option to reset the report.

Explore this Power BI executive dashboard example to see how interactive reporting can support executive reviews, KPI variance analysis, revenue performance tracking, regional benchmarking, and data-driven decision-making.

ZoomCharts visuals used

Drill Down Combo PRO Drill Down Combo PRO
Drill Down Waterfall PRO Drill Down Waterfall PRO
Drill Down Combo Bar PRO Drill Down Combo Bar PRO

4U Report Challenges

Participate in data challenges, build and submit reports to get free template downloads.

Join Community

Mobile view allows you to interact with the report. To Download the template please switch to desktop view.

Similar reports

All Reports 5 results
New
Report Card

Power BI Business KPI Dashboard

1068

New
Report Card

Power BI Revenue Dashboard for Executive KPI Analysis

1489

New
Report Card

Power BI Operational KPI Dashboard

1858

Explore all reports

Was this helpful? Thank you for your feedback!

Sorry about that.

How can we improve it?

Executive Dashboard Example in Power BI

Report Author: Sweety Antoni David

1766

ZoomCharts

Welcome to ZoomCharts

You’re almost there! Create an account to download reports.

or
Sign up with Microsoft

Verify your email address

We have sent a code to your email address. Please input the code below.

Didn't receive code? Request again (after 30 seconds)

Already have an account? Log in

ZoomCharts

Log in to your ZoomCharts account

Log in with Microsoft
or
Forgot password?

Reset your password

We'll email you instructions on how to reset your password

Don't have an account? Sign up

Please add credits

You have 0 available downloads.
Get more credits or upgrade your plan to continue.

View pricing
logo
[email protected]
+44 204 577 3993
logo

Products

Drill Down Bubble PRO Drill Down Line PRO Drill Down Network PRO Drill Down Waterfall PRO Drill Down Graph PRO Drill Down Combo PRO Drill Down Combo Bar PRO Drill Down Donut PRO Drill Down Pie PRO Drill Down TimeSeries PRO Drill Down Timeline PRO Drill Down Map PRO Drill Down Scatter PRO All Visuals

Resources

Report Examples Webinars Blog ZoomCharts Academy Visuals Gallery Documentation Custom Visual Development Subscribe to News

Solutions

Custom Visual Development

Company

Pricing About Us Partners Leave feedback Join PowerGroup EU Funding

Help

ZoomCharts Assistance Contact Sales Contact Support FAQ AI Information

Drill Down Line PRO Drill Down Bubble PRO Drill Down Network PRO Drill Down Waterfall PRO Drill Down Graph PRO Drill Down Combo PRO Drill Down Combo Bar PRO Drill Down Donut PRO Drill Down Pie PRO Drill Down TimeSeries PRO Drill Down Timeline PRO Drill Down Map PRO Drill Down Scatter PRO All Visuals

Report Examples Webinars Blog ZoomCharts Academy Visuals Gallery Documentation Custom Visual Development Subscribe to News

Custom Visual Development

Pricing About Us Partners Leave feedback Join PowerGroup EU Funding

ZoomCharts Assistance Contact Sales Contact Support FAQ AI Information
+44 204 577 3993
[email protected]

Ready to get in touch?

Contact our experts with any question about Power BI and ZoomCharts for Free!

Contact us

© 2026, Data Visualization Software Lab

U.S. Patents No. 11,645,343; 11,921,804; 12,346,389

Cookies
Privacy Policy
Global
Legal
Patent
warning

Error message

success

Success info: Done!

ZoomCharts AI Assistant

We noticed you're using an old OS version.

For the best experience, we recommend upgrading to ensure that all website features display correctly.

Cookie settings

We use necessary cookies for site functionality, as well as statistic, marketing, and preference cookies to enhance your experience. For more information and to manage your preferences, please visit our Cookie policy