3073
Power BI Revenue Dashboard for Executive KPI Analysis
Power BI Revenue Dashboard for Executive KPI Analysis
More Report pages
Report Author: Mohamed Elbushra
3073
Share template with others
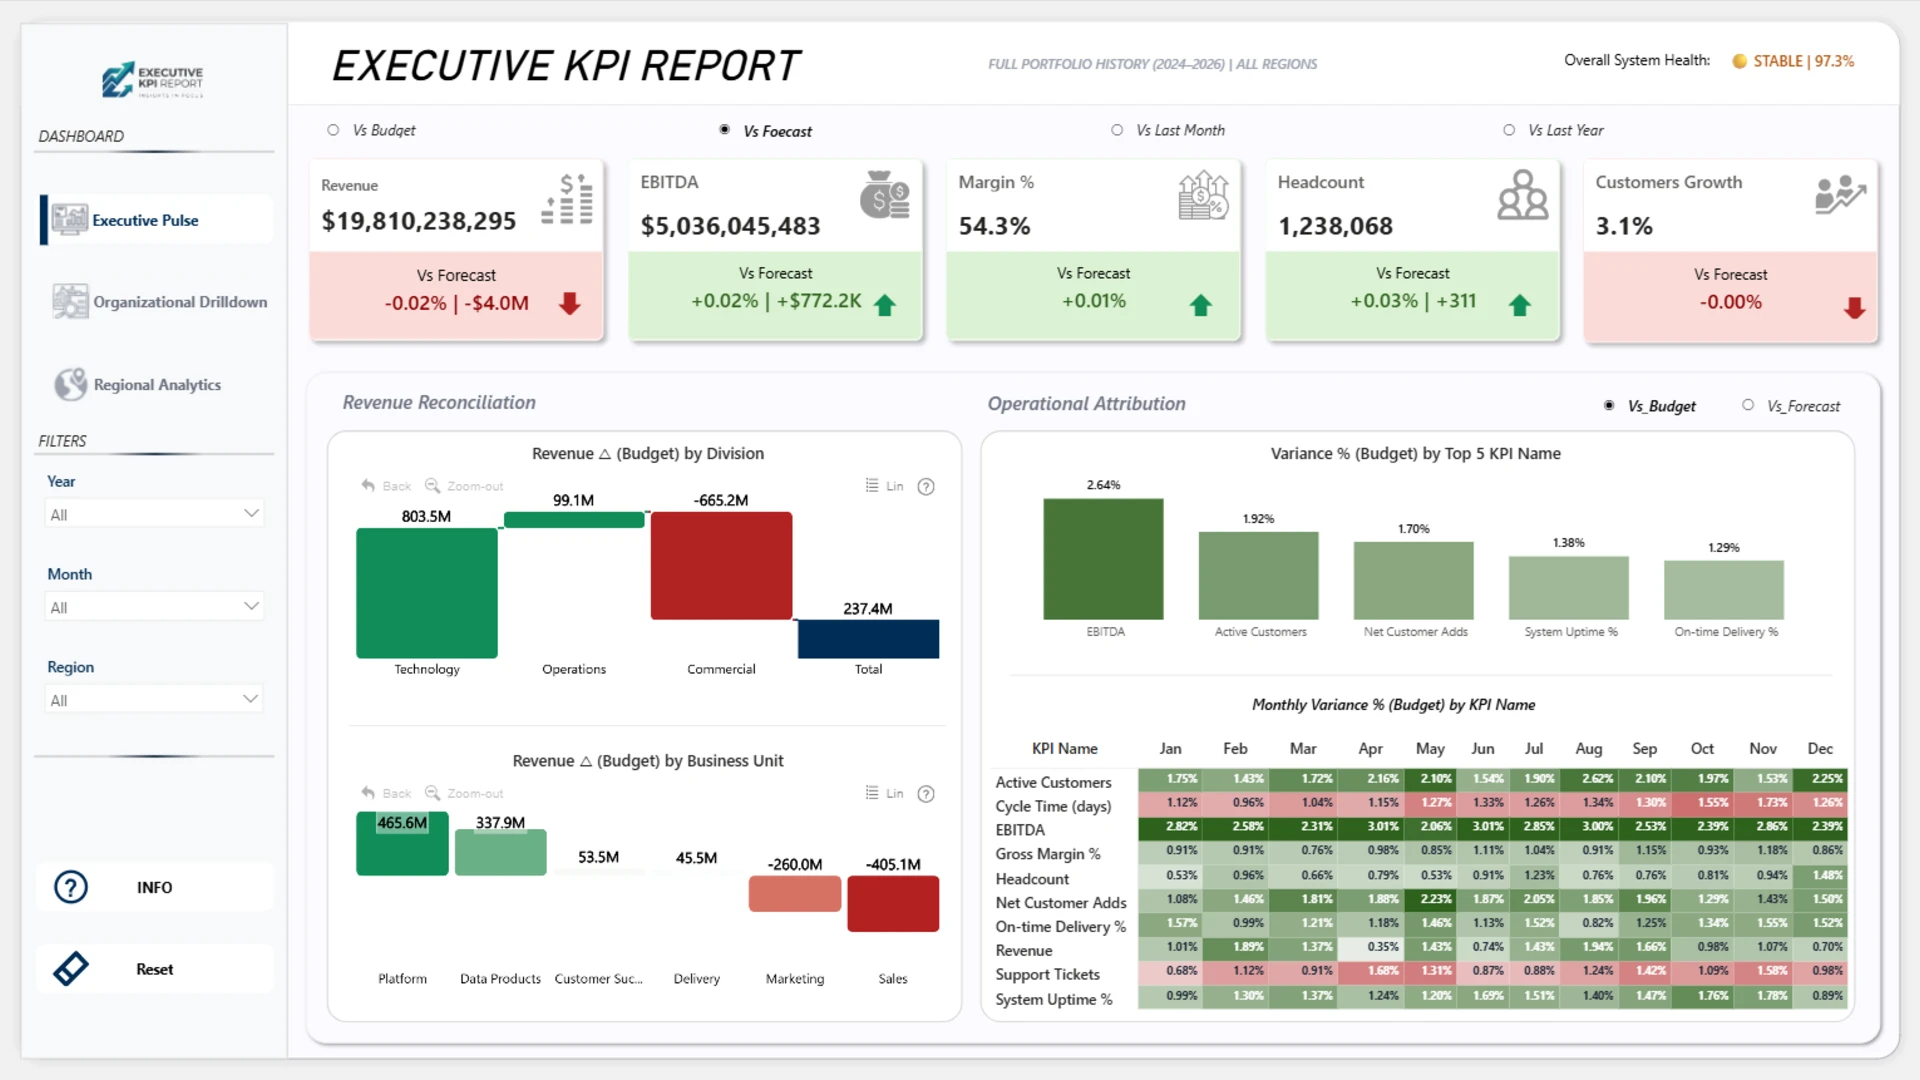
This revenue dashboard example shows how Power BI can help executives analyze revenue performance, forecast accuracy, budget variance, operational accountability, and regional efficiency in one interactive dashboard.
Built with ZoomCharts Drill Down custom visuals for Power BI, the dashboard highlights key business KPIs such as revenue, EBITDA, margin %, headcount, customer growth, budget variance, forecast variance, and year-over-year change. The dashboard was submitted to the ZoomCharts “4U Reports Challenge” in April 2026.
Designed to solve the “data-noise” problem for C-suite executives, this dashboard connects high-level revenue performance with detailed operational and regional insights.
What you can analyze
Use this Power BI revenue dashboard to track:
- Revenue, EBITDA, margin %, headcount, and customer growth
- Actual vs. budget, forecast, last month, and last year performance
- Revenue reconciliation by division and business unit
- Monthly KPI variance by metric
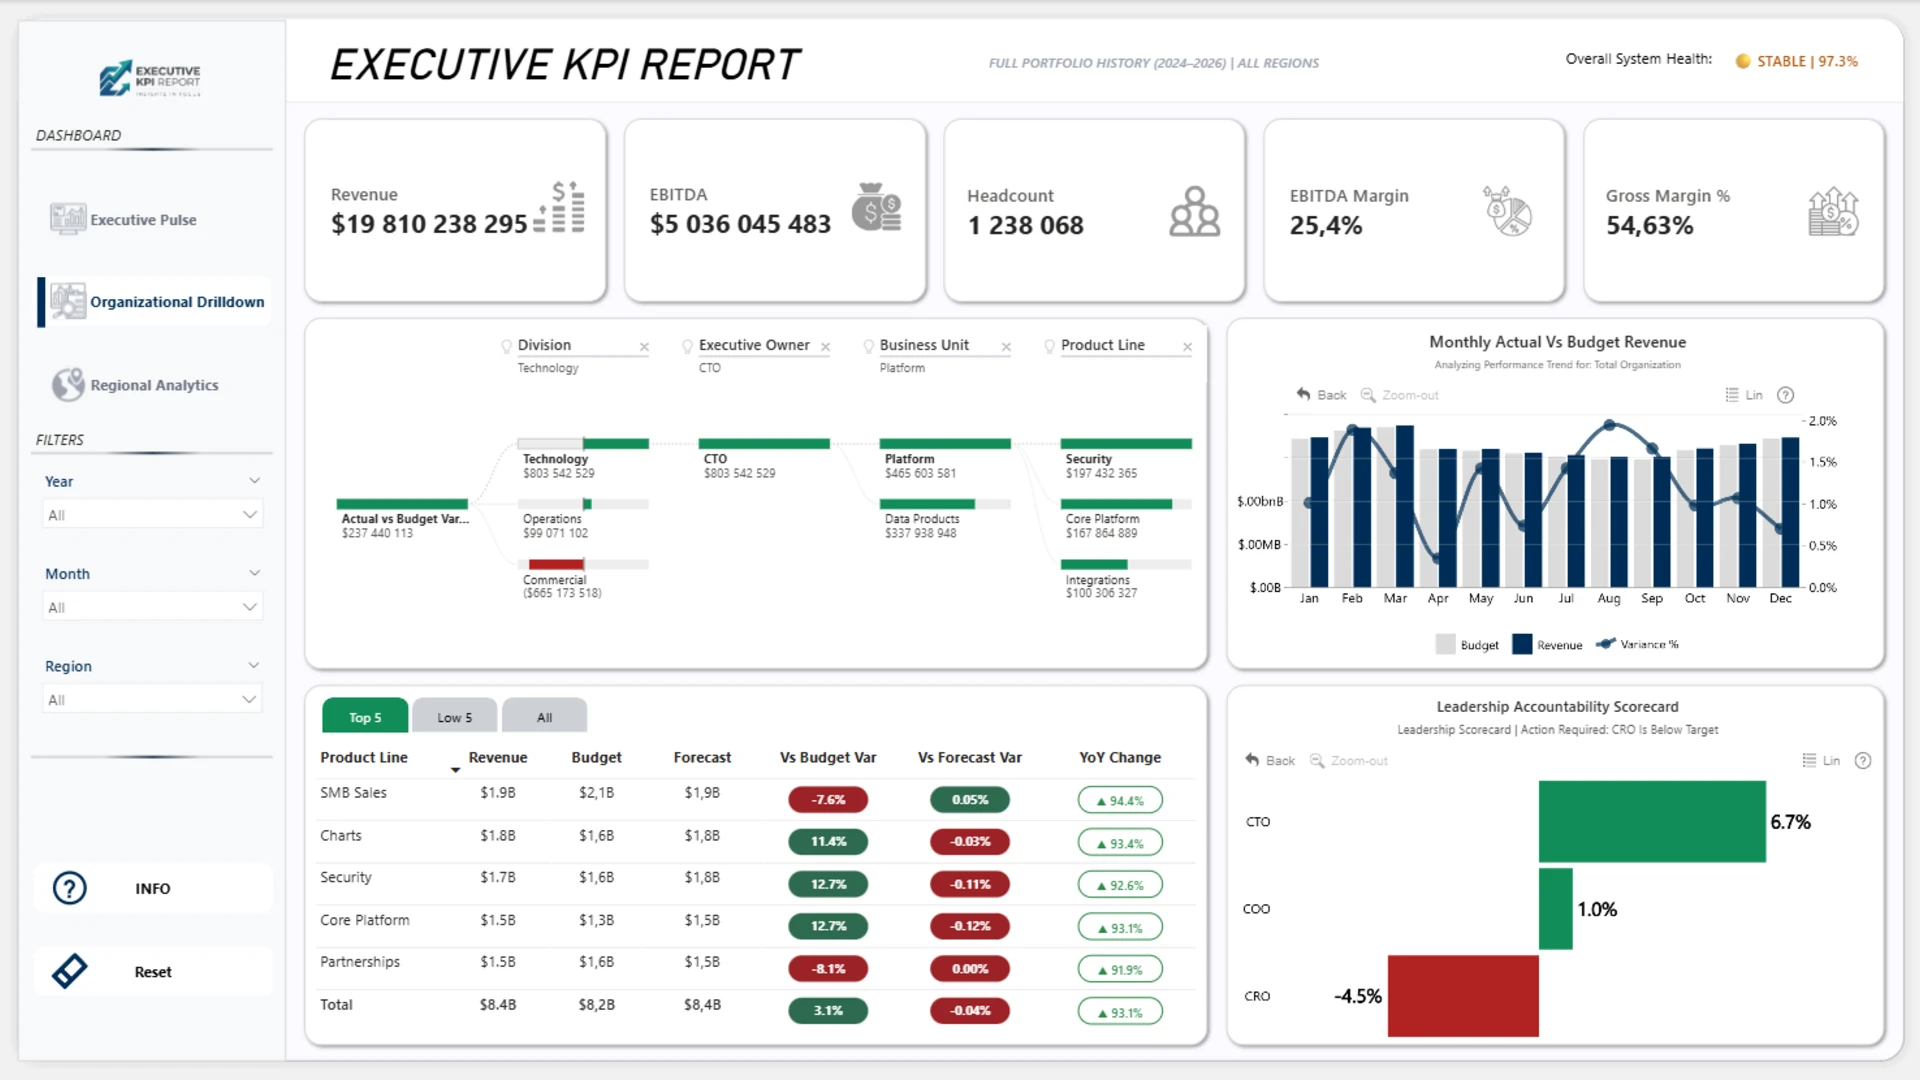
- Revenue, budget, and forecast by product line
- Leadership accountability by role
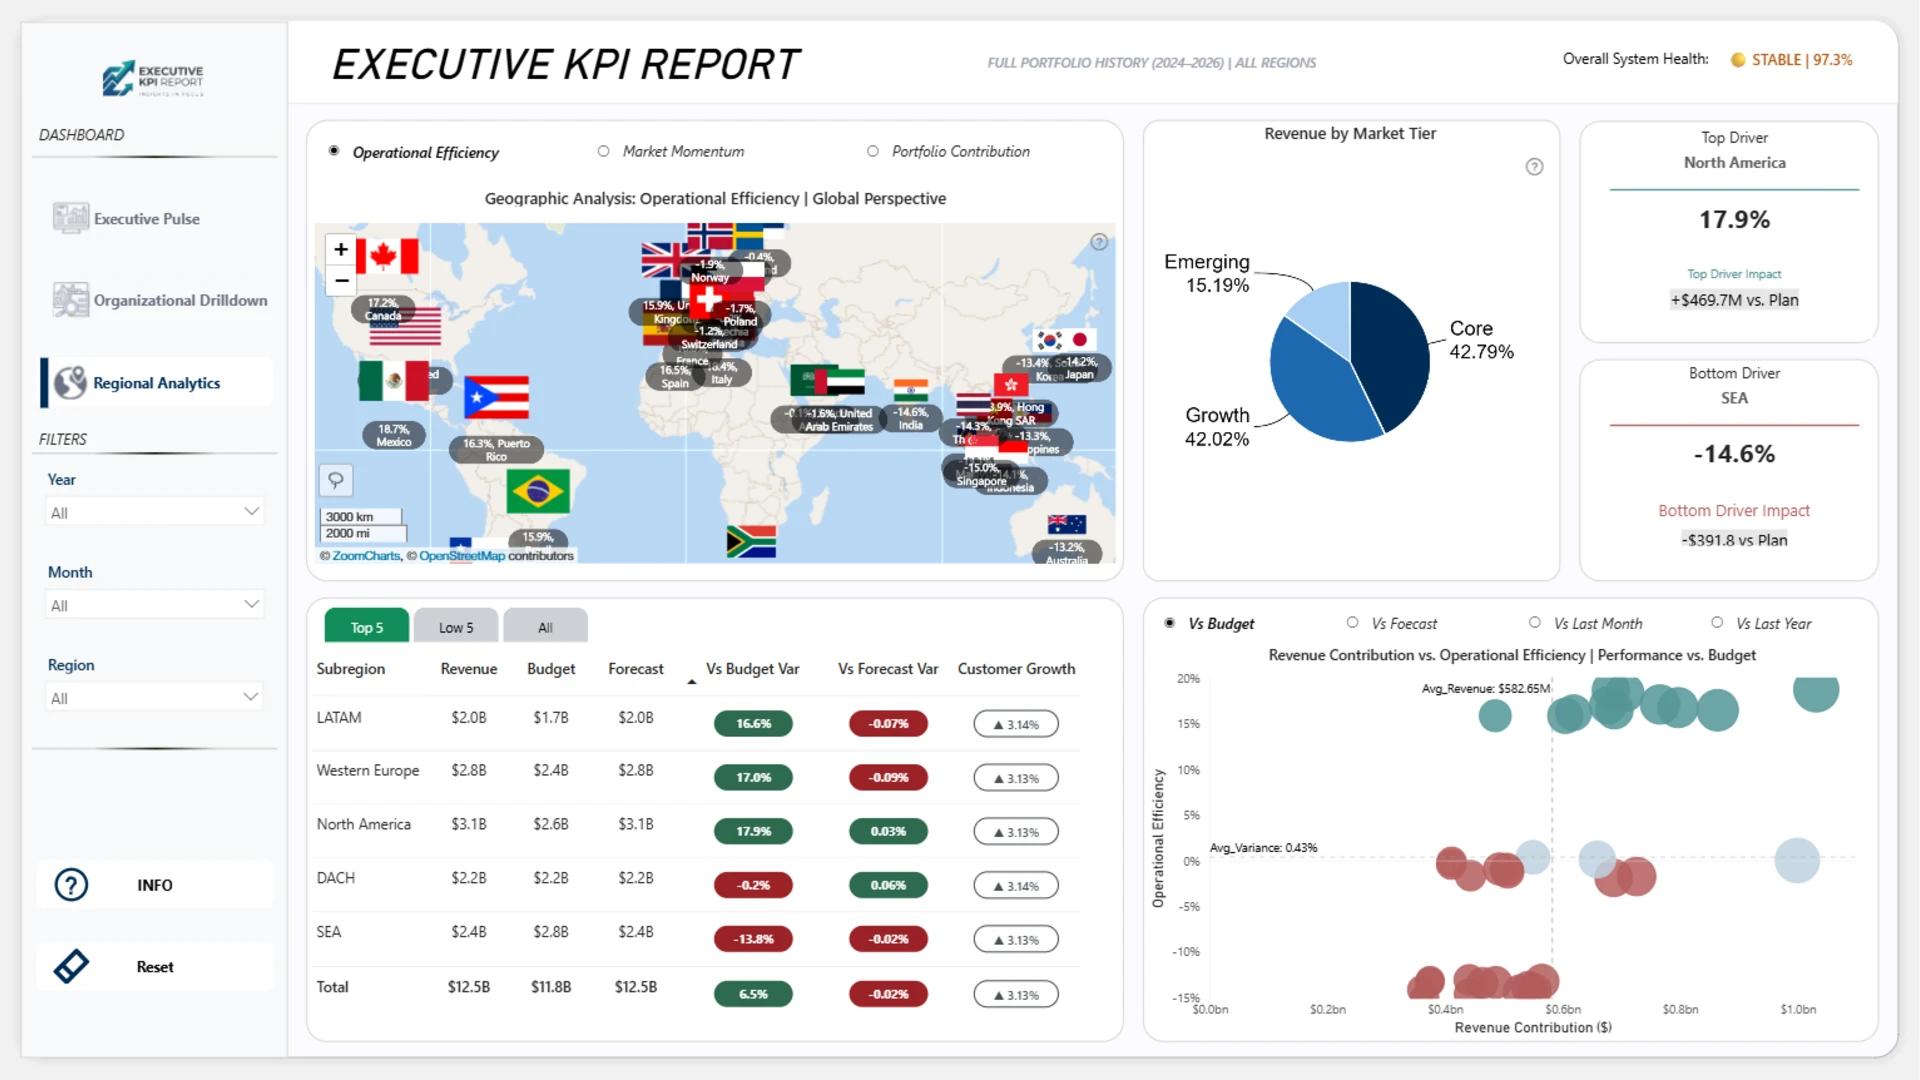
- Revenue by market tier and subregion
- Regional drivers and underperforming markets
- Operational efficiency and portfolio contribution
Dashboard pages
- Executive pulse: monitor revenue KPIs, budget and forecast variance, revenue reconciliation, operational attribution, and monthly variance patterns.
- Organizational drilldown: analyze revenue, EBITDA, headcount, margin, product lines, budget variance, forecast variance, and leadership accountability.
- Regional analytics: explore geographic revenue performance, revenue by market tier, top and bottom regional drivers, and revenue contribution vs. operational efficiency.
Interactive features
This dashboard uses ZoomCharts Drill Down custom visuals for Power BI to support interactive revenue analysis. Users can filter by year, month, and region, switch between comparison views such as vs. budget, vs. forecast, vs. last month, and vs. last year, and drill down into divisions, business units, product lines, regions, and market tiers.
Explore this Power BI revenue dashboard example to see how interactive reporting can support executive reviews, revenue planning, budget tracking, forecast analysis, and strategic decision-making.
ZoomCharts visuals used





4U Report Challenges
Participate in data challenges, build and submit reports to get free template downloads.
Join CommunityMobile view allows you to interact with the report. To Download the template please switch to desktop view.



How to use a PBIX template
Preview the interactive report, download the PBIX file, open it in Power BI Desktop, and replace the same data connection with your own dataset.
Preview and download
Explore the report online and download the PBIX template file.
Open in Power BI Desktop
Open the downloaded PBIX file in Power BI Desktop.
Connect your data
Replace the sample data source with your own dataset.
Refresh and adjust
Refresh the model and update fields or visual were needed.
Save and share
Save your report and publish it for your audience.


