970
CRM Dashboard Analytics
CRM Dashboard Analytics
More Report pages
Report Author: Faheedah Bukola Bello
970
Share template with others
Report submitted for FP20 Analytics ZoomCharts Challenge 17 (July 2024). The report was built with the CRM & Sales Pipeline Analysis dataset and includes ZoomCharts custom Drill Down PRO visuals for Power BI.
Author's description:
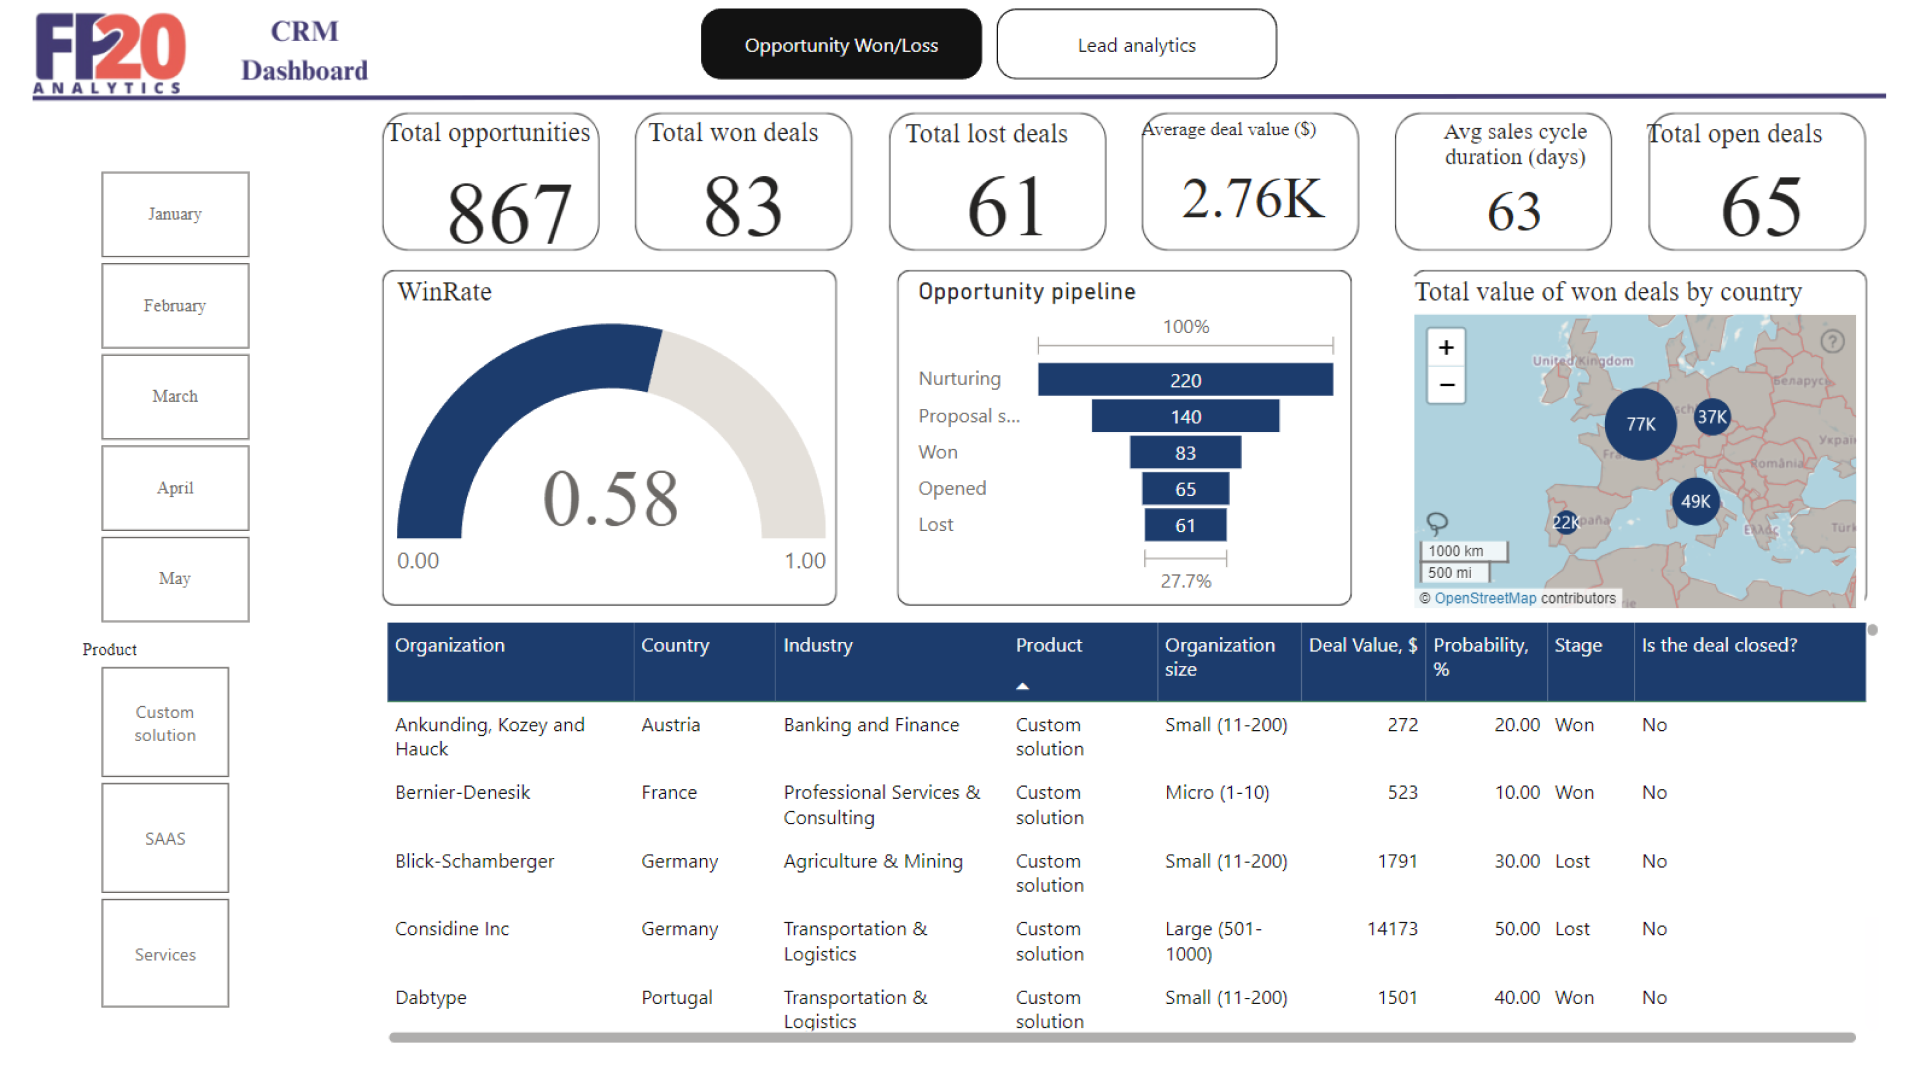
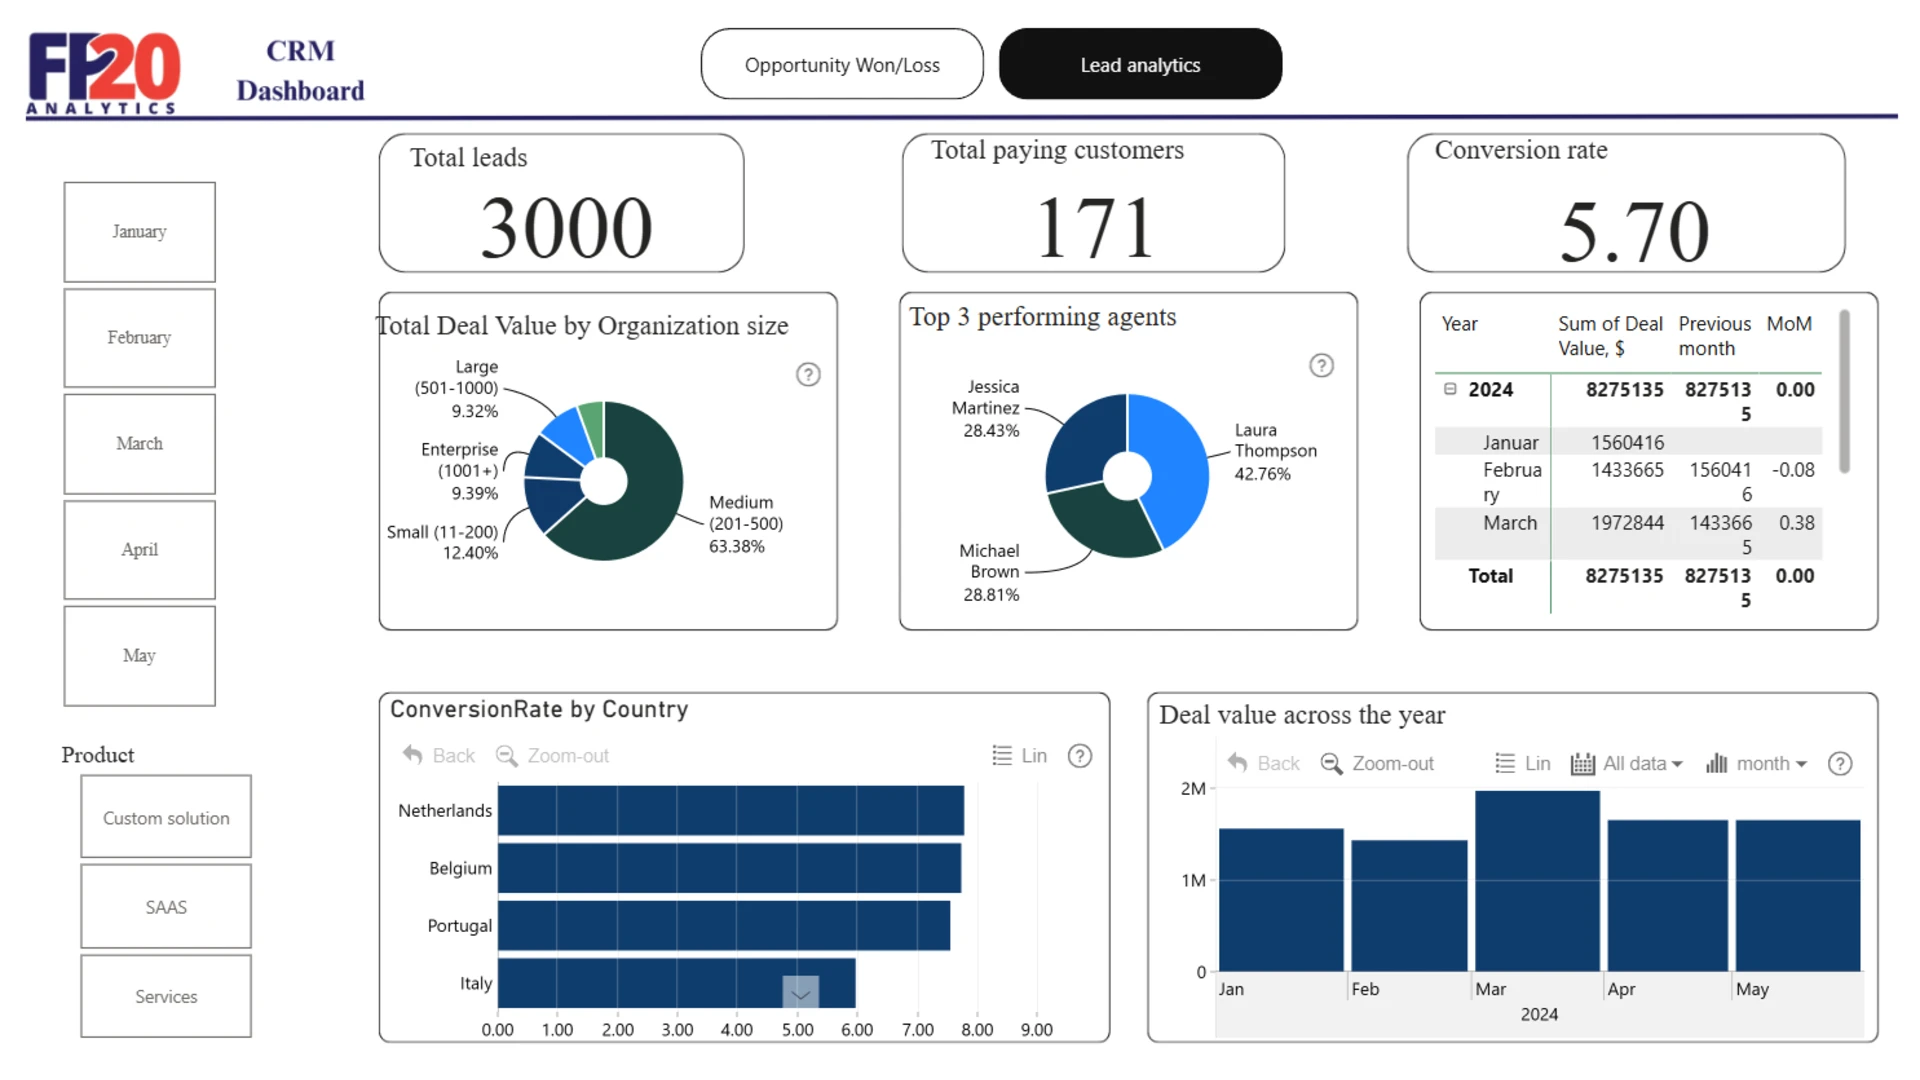
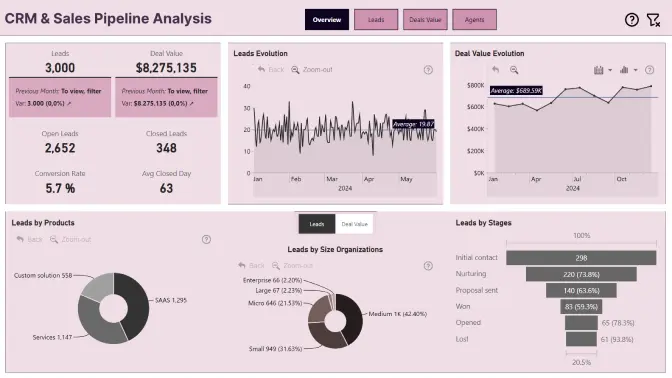
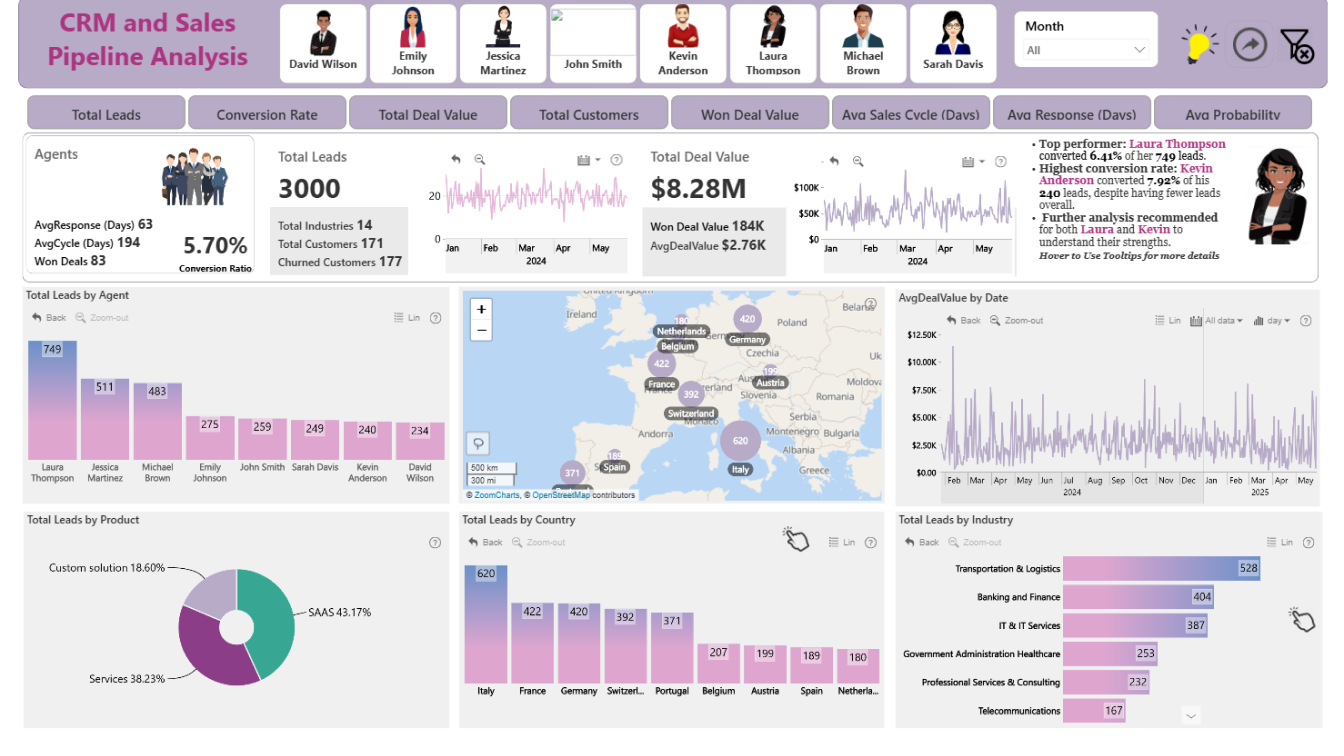
This Power BI report includes two main pages: "Lead Analytics" and "Opportunities Won/Loss." The visuals provide insights into key metrics such as conversion rates, sales performance by industry, win ratios, deal values, and sales cycle duration, helping stakeholders understand and optimize the sales process effectively.
ZoomCharts visuals used
4U Report Challenges
Participate in data challenges, build and submit reports to get free template downloads.
Join CommunityMobile view allows you to interact with the report. To Download the template please switch to desktop view.
Was this helpful? Thank you for your feedback!
Sorry about that.
How can we improve it?