1342
Sales Pipeline Dashboard Template for Power BI
Sales Pipeline Dashboard Template for Power BI
More Report pages
Report Author: Ugochukwu Nwasuruba
1342
Share template with others
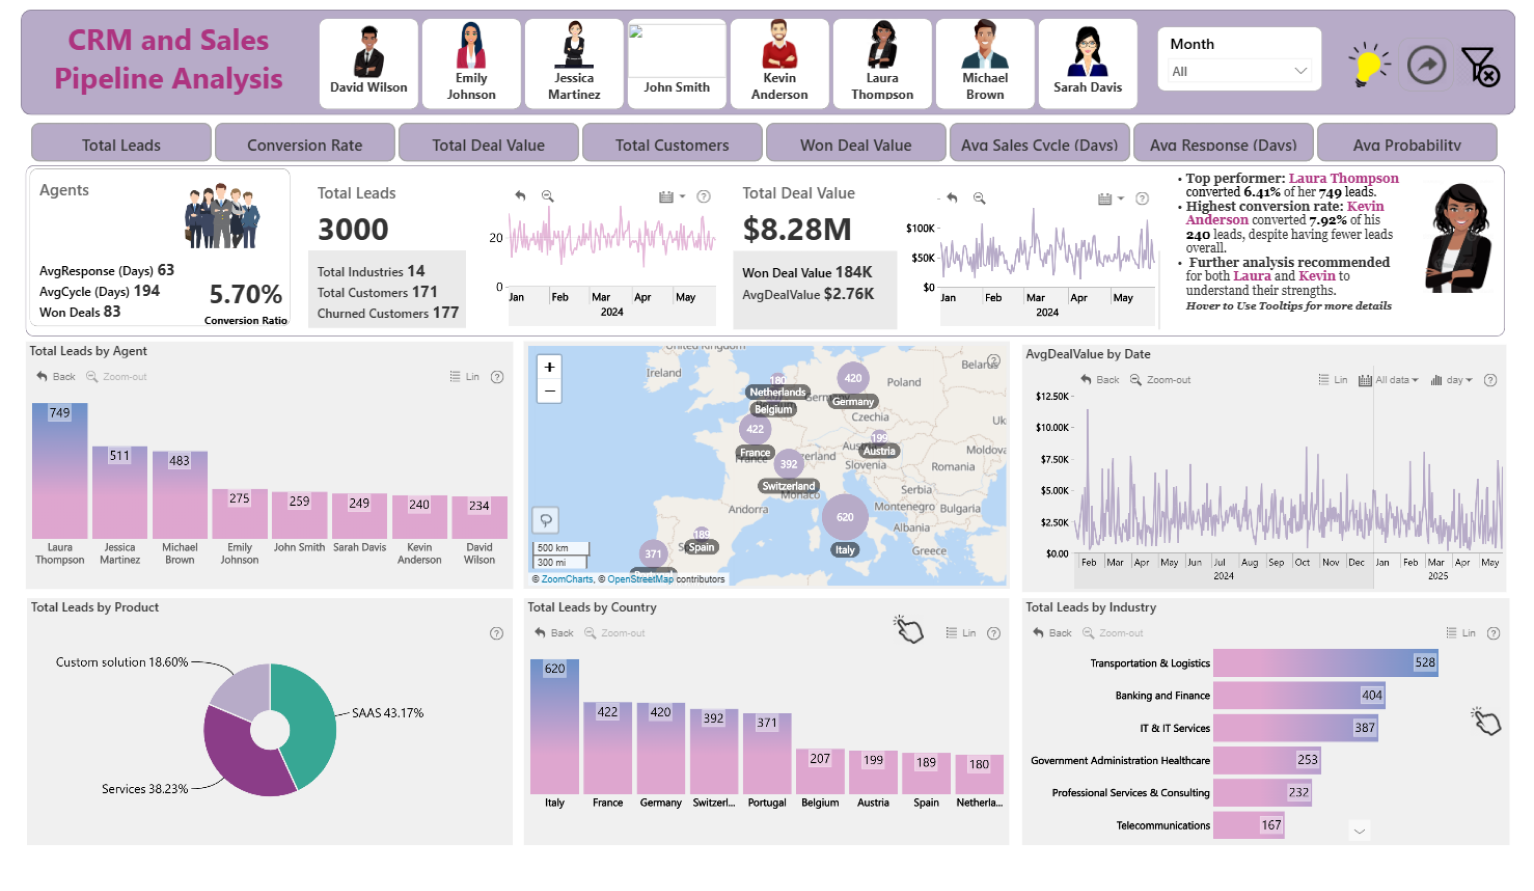
This Sales Pipeline Dashboard Template for Power BI helps users visualize sales opportunities, monitor pipeline stages, track conversion metrics, and improve sales management processes.
Report submitted for FP20 Analytics ZoomCharts Challenge 17 (July 2024). The report was built with the CRM & Sales Pipeline Analysis dataset and includes ZoomCharts custom Drill Down PRO visuals for Power BI.
Author's description:
This project delves into company's CRM data and sales pipeline to unlock valuable insights for optimizing sales strategies.
Key Features:
Humanized Data Visualization: Clip art visuals for sales agents add a touch of personality, making data more engaging and relatable.
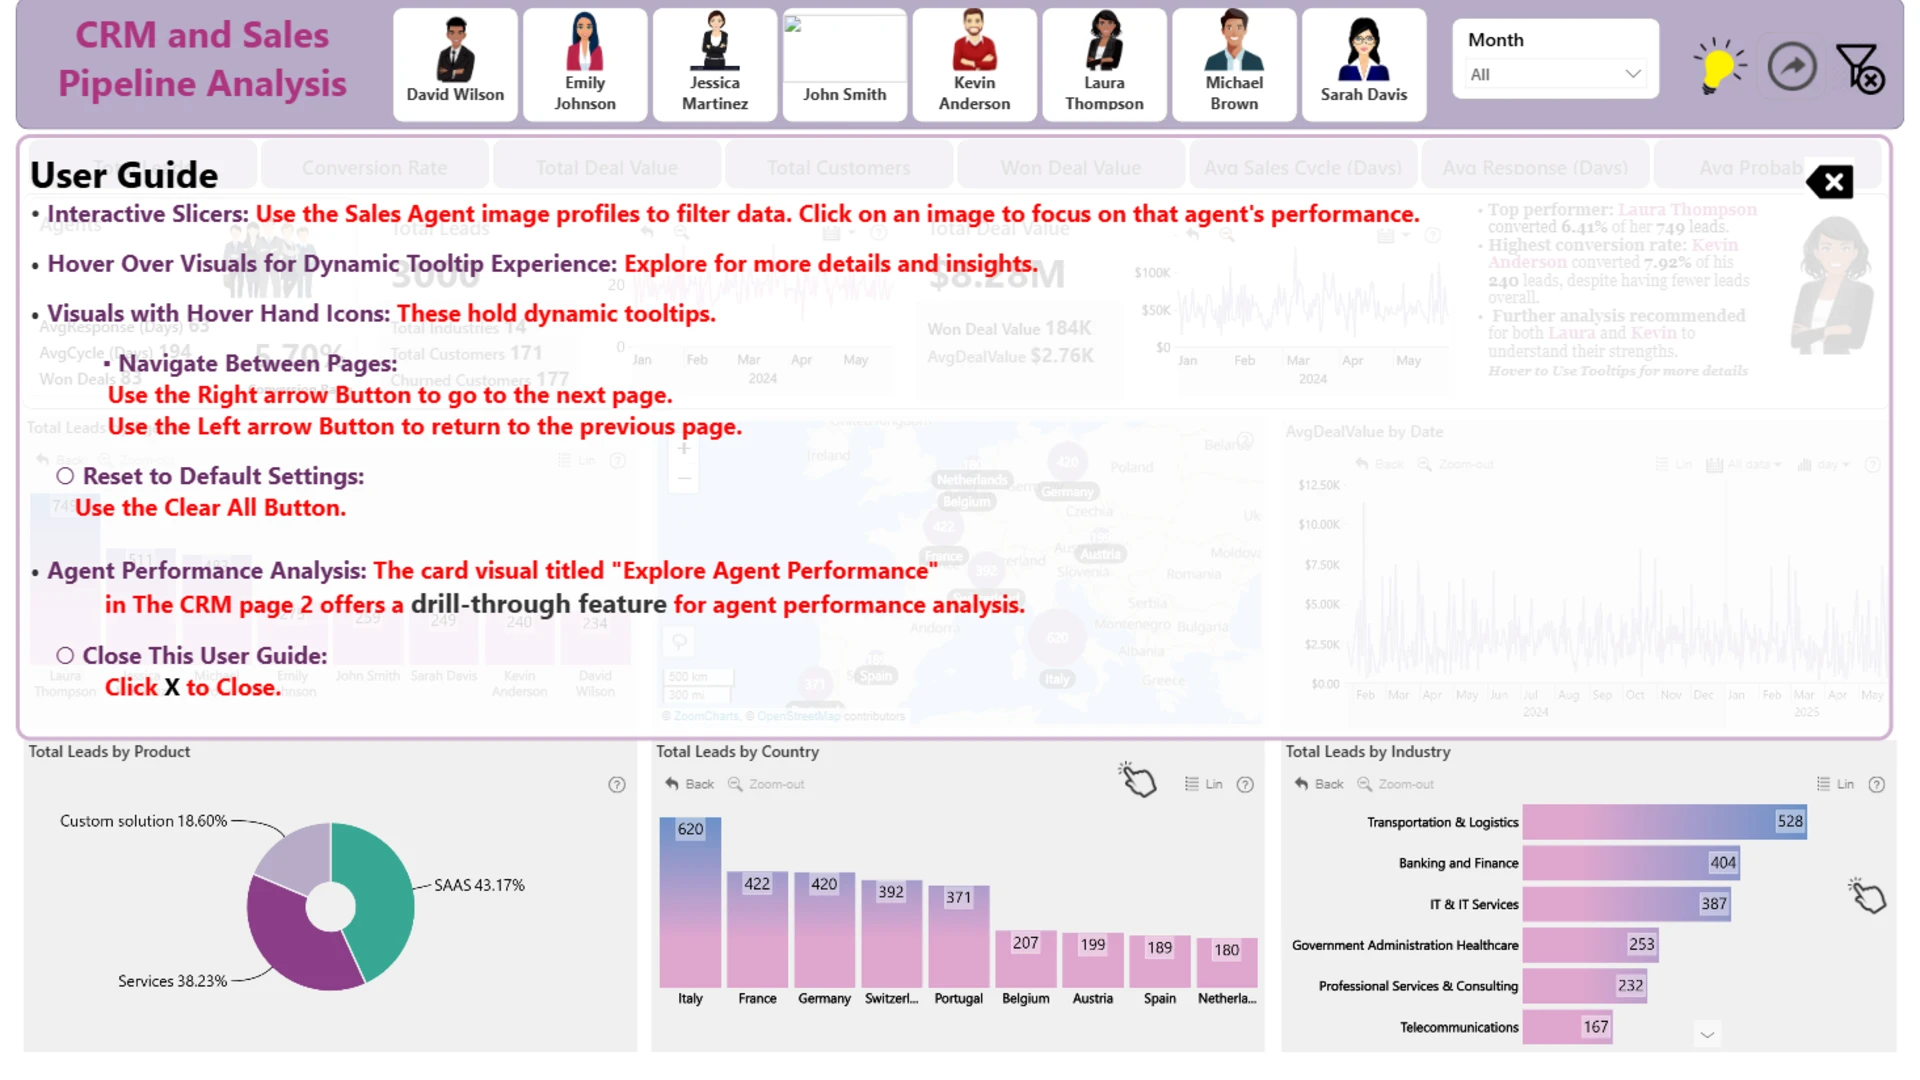
Actionable Insights: Users can explore data further using field parameters to gain targeted insights based on specific countries, industries, or agents.
Data-Driven Decision Making: By analyzing conversion rates, pipeline health, lead response times, and deal values, the project aims to identify top performers, optimize lead distribution, and improve overall sales effectiveness.
Benefits:
Enhanced Sales Strategy Development: Data-driven insights guide targeted sales strategies for improved lead conversion and revenue growth.
Improved Sales Agent Performance: Identification of top performers and trends can inform training programs and empower agents to achieve better results.
ZoomCharts visuals used





4U Report Challenges
Participate in data challenges, build and submit reports to get free template downloads.
Join CommunityMobile view allows you to interact with the report. To Download the template please switch to desktop view.
How to use a PBIX template
Preview the interactive report, download the PBIX file, open it in Power BI Desktop, and replace the same data connection with your own dataset.
Preview and download
Explore the report online and download the PBIX template file.
Open in Power BI Desktop
Open the downloaded PBIX file in Power BI Desktop.
Connect your data
Replace the sample data source with your own dataset.
Refresh and adjust
Refresh the model and update fields or visual were needed.
Save and share
Save your report and publish it for your audience.


