Showing:
4U Reports
Reports that earn attention, built on four user-centered qualities: Unique, User-friendly, Uncovering, and Understandable.
Designed to be opened, explored, understood, and acted upon.

120+ New Power BI Reports
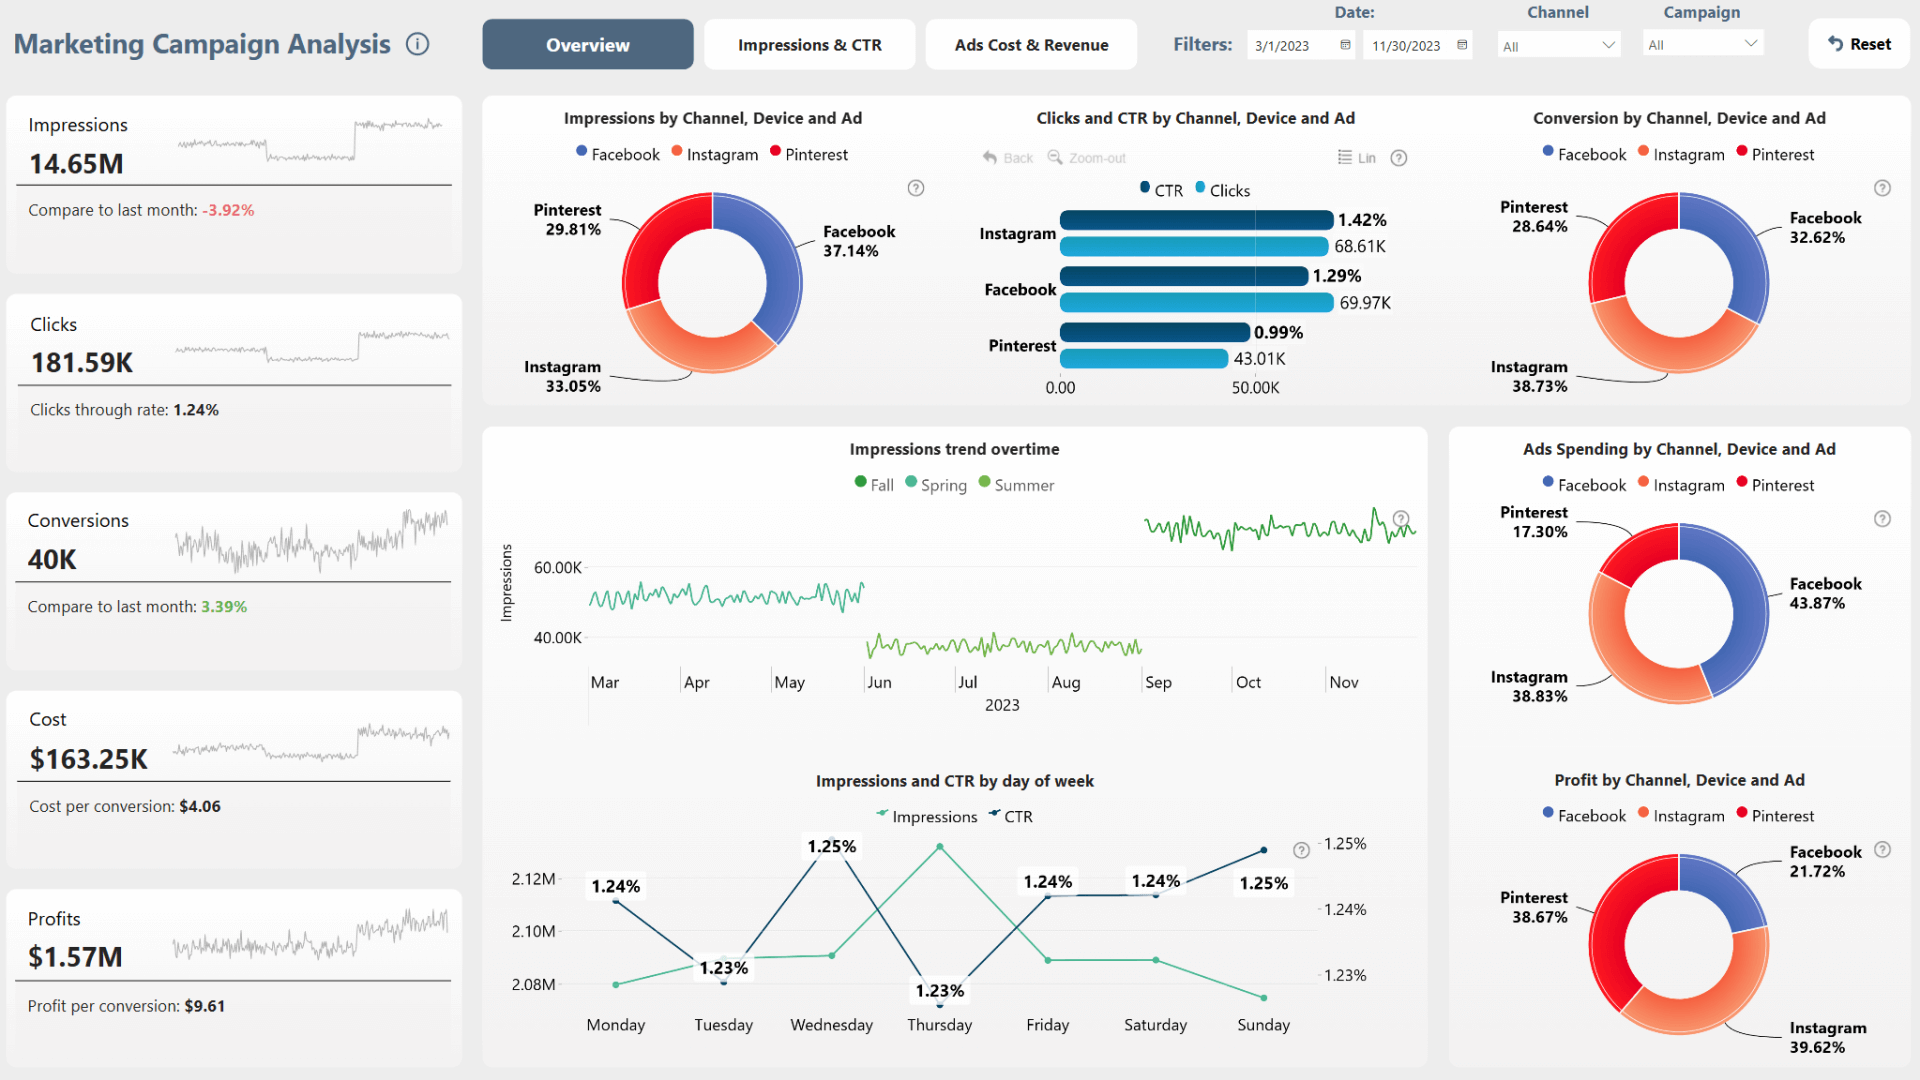
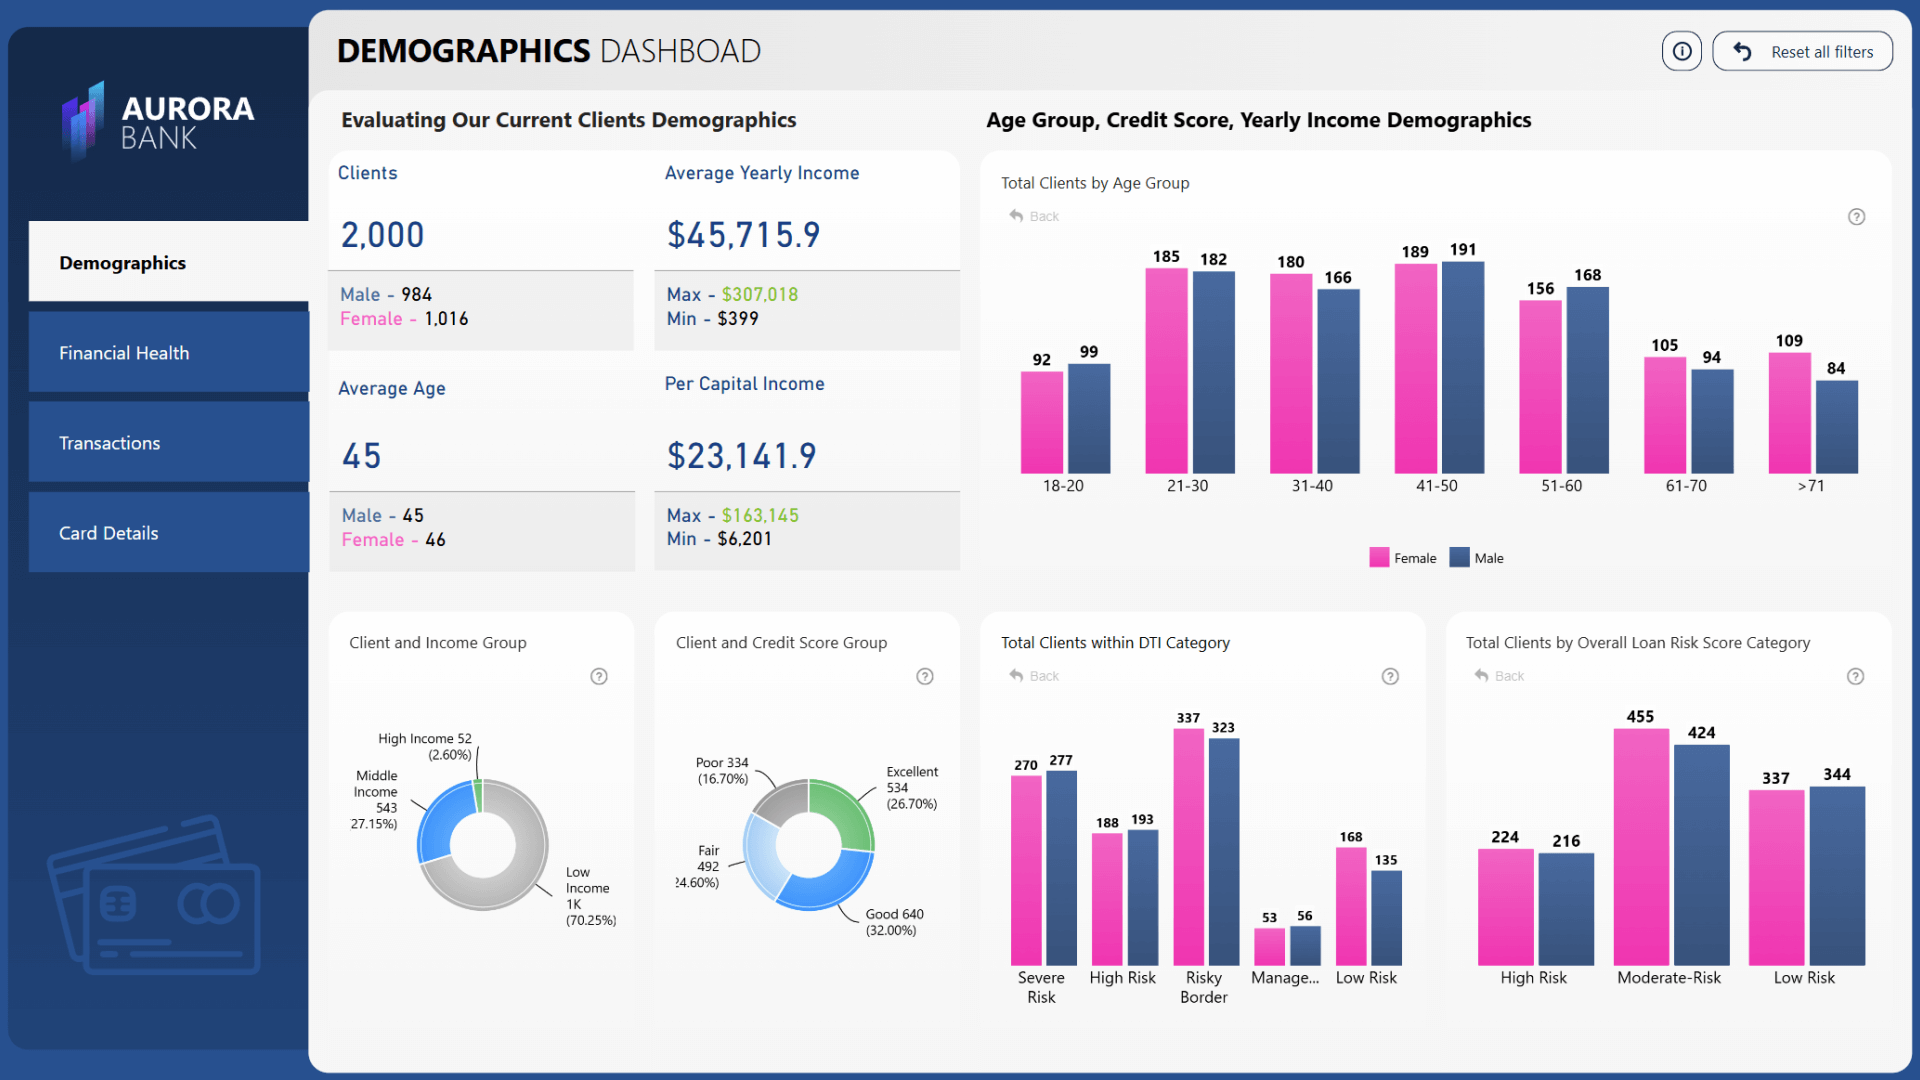
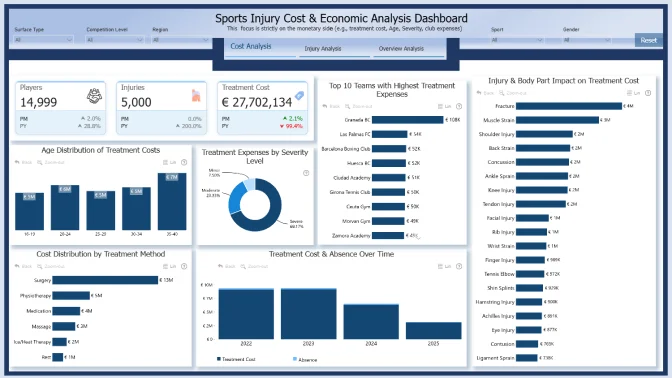
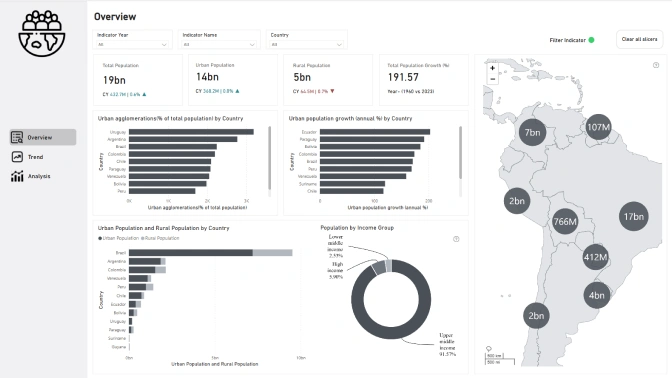
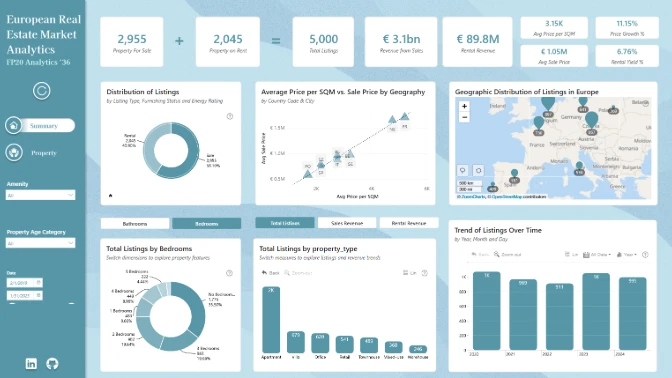
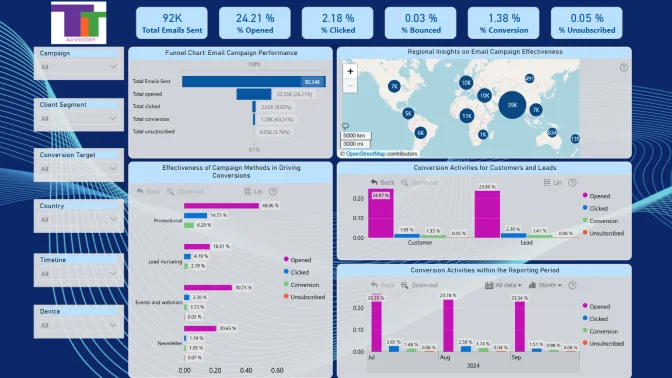
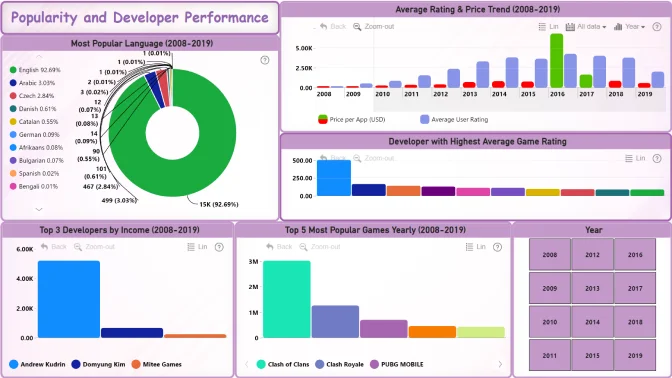
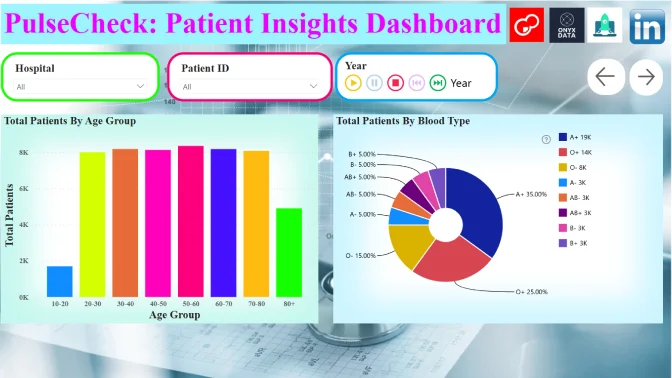
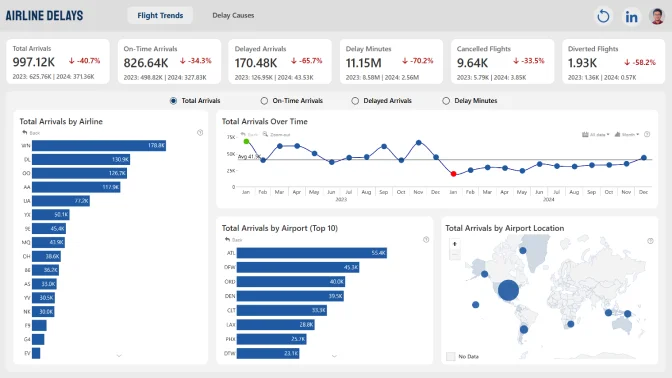
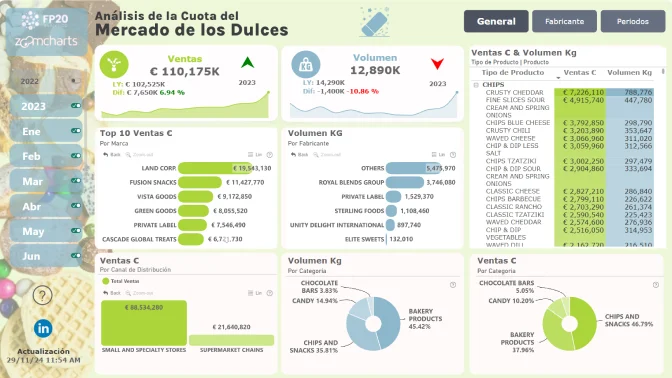
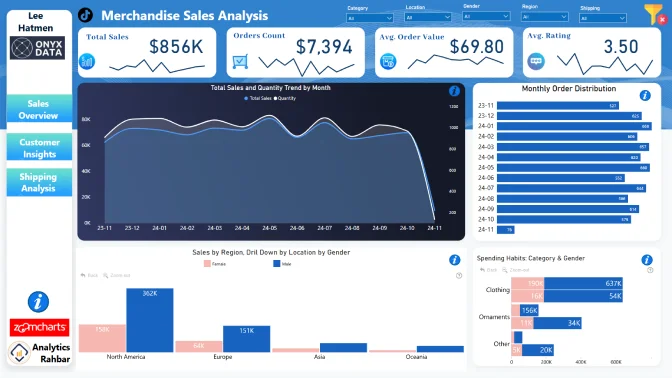
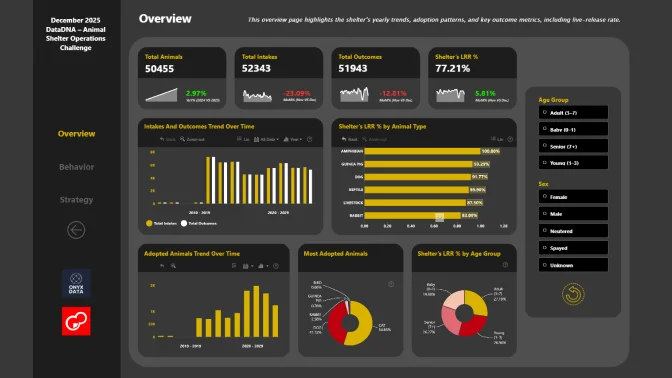
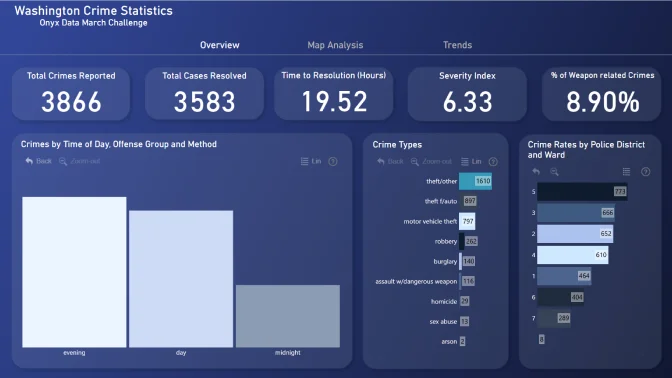
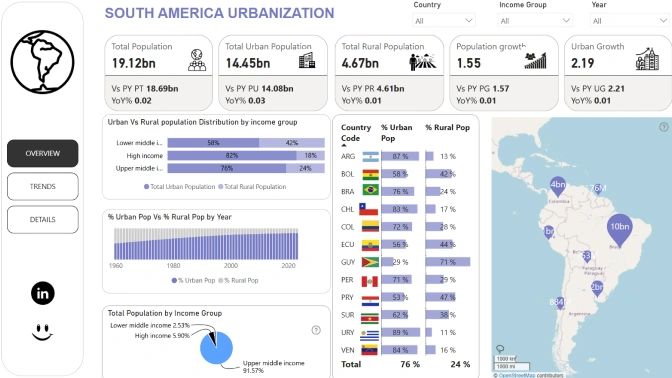
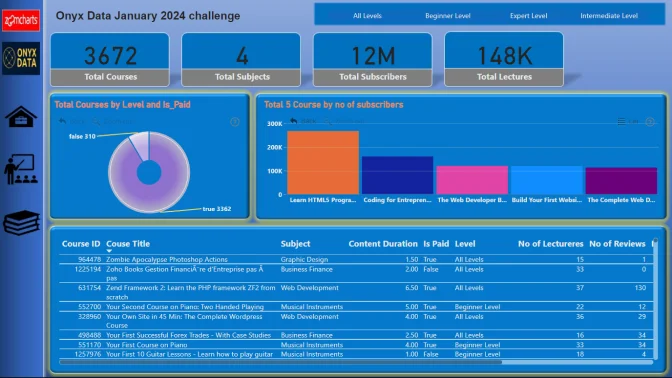
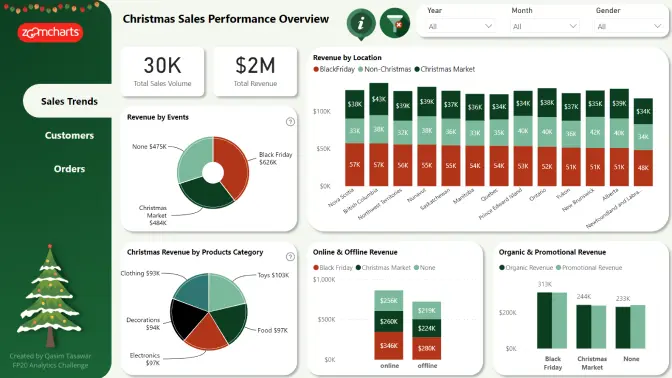
Executive KPI reports, budget and revenue, real estate analytics, and more.

120+ New Power BI Reports
Executive KPI reports, budget and revenue, real estate analytics, and more.
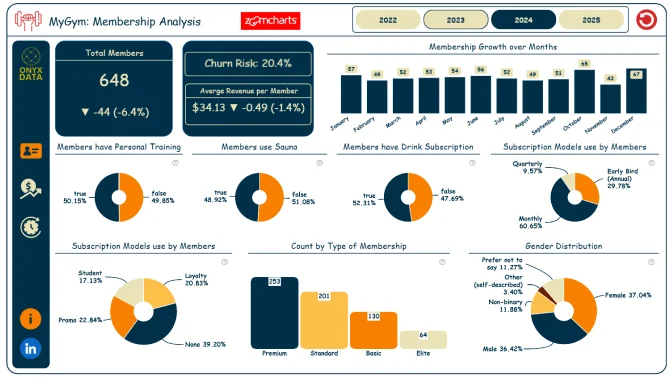
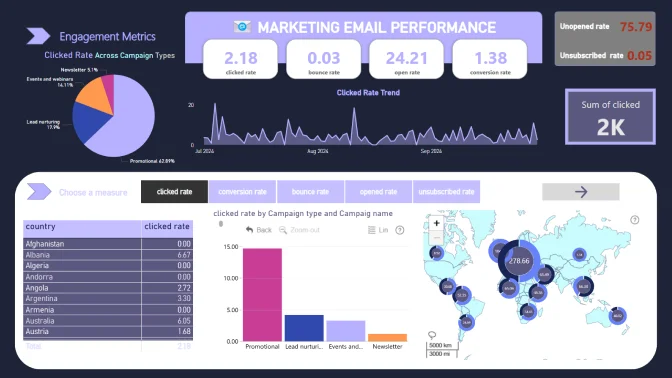
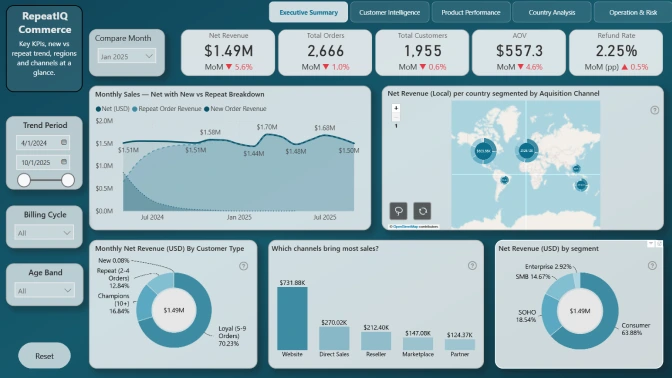
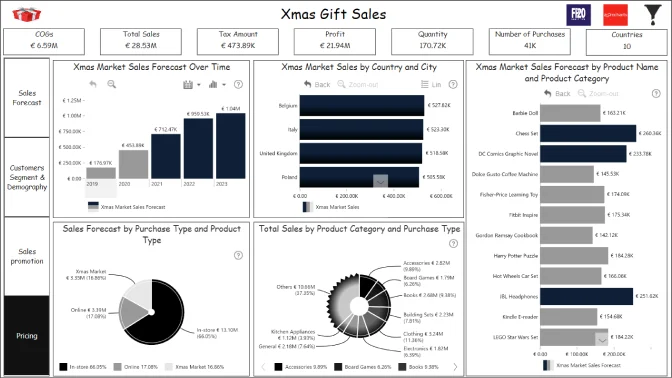
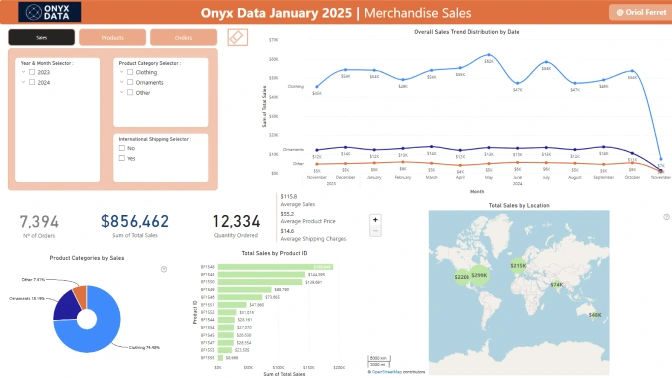
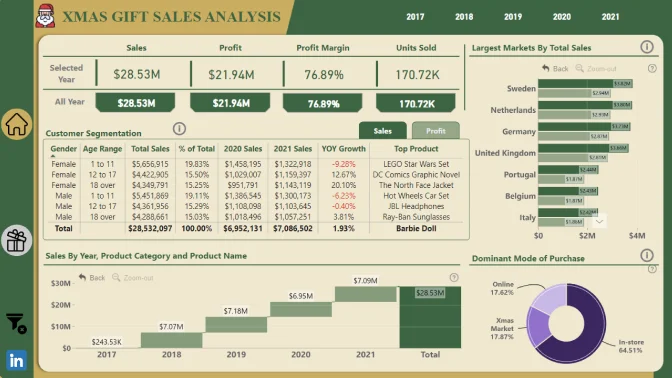
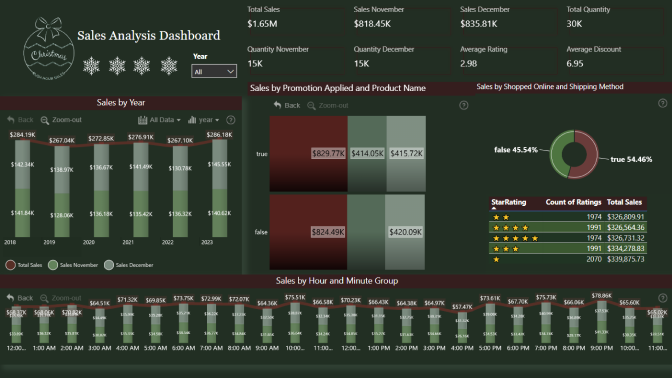
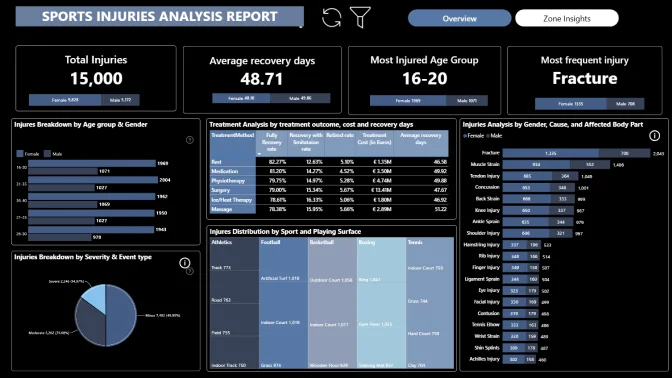
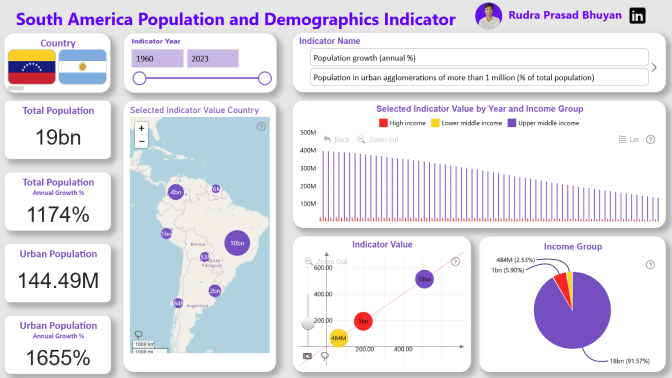
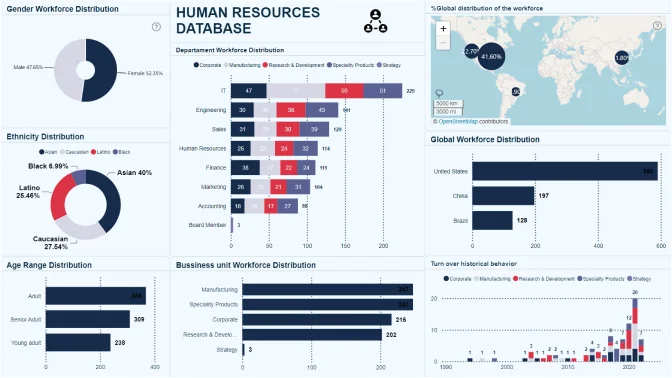
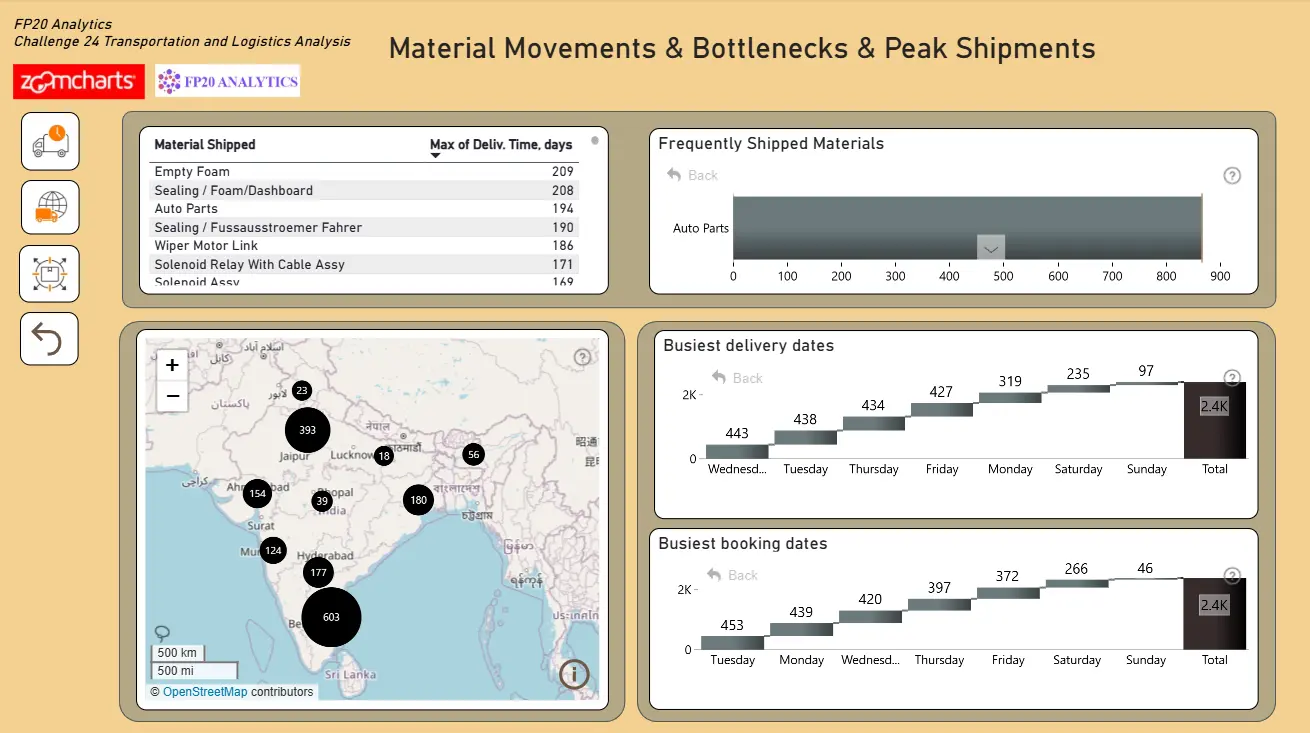
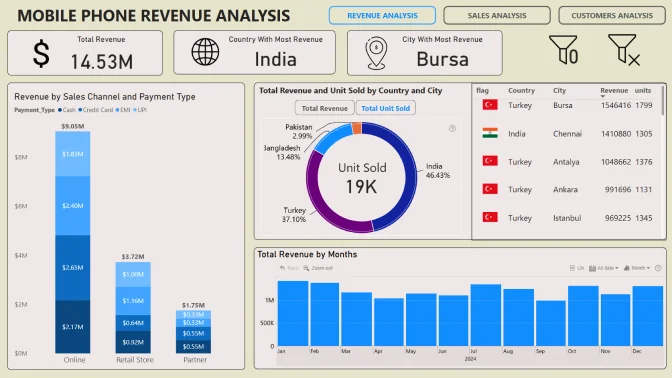
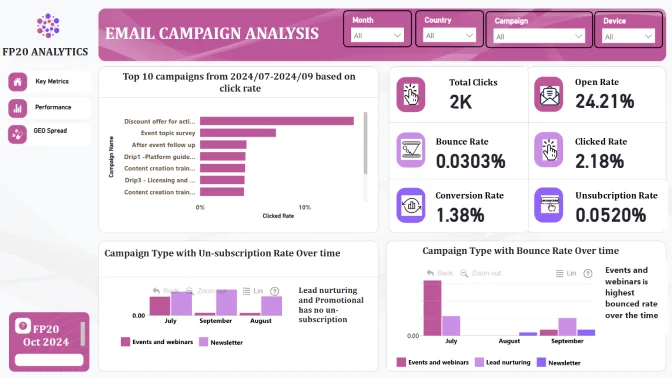
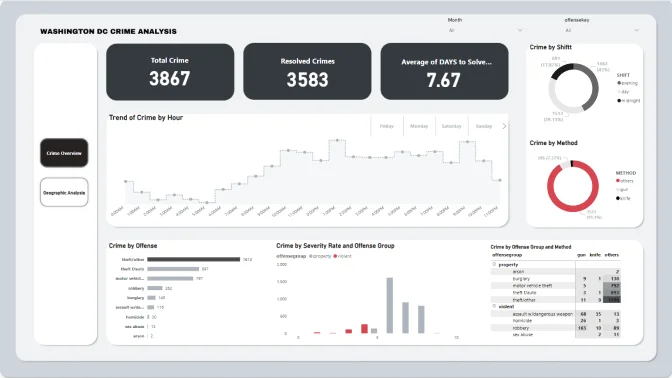
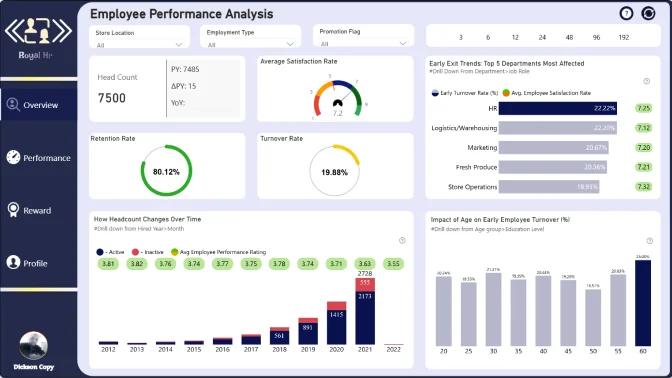
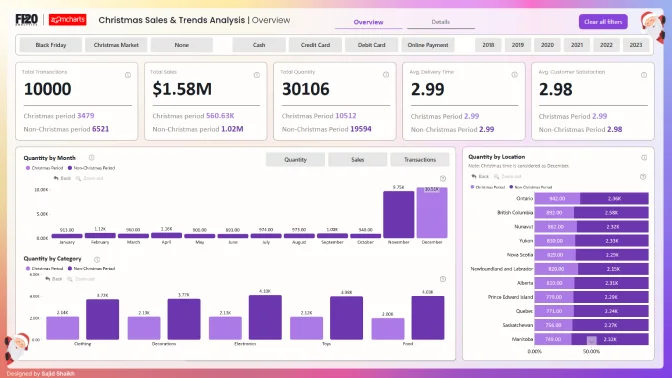
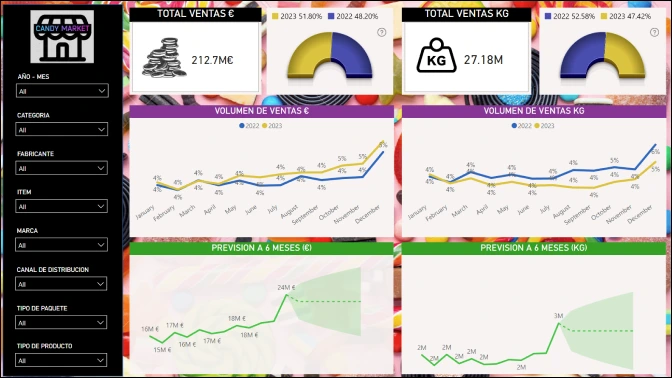
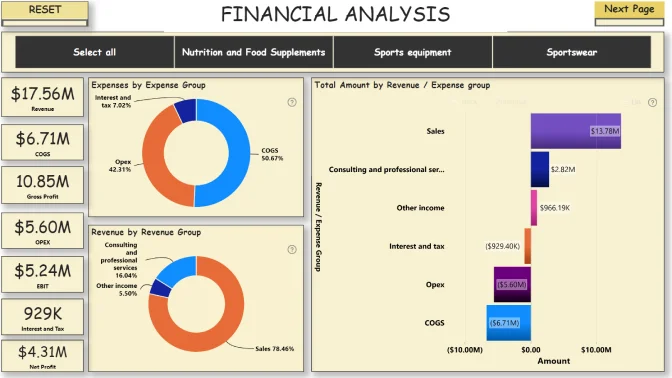
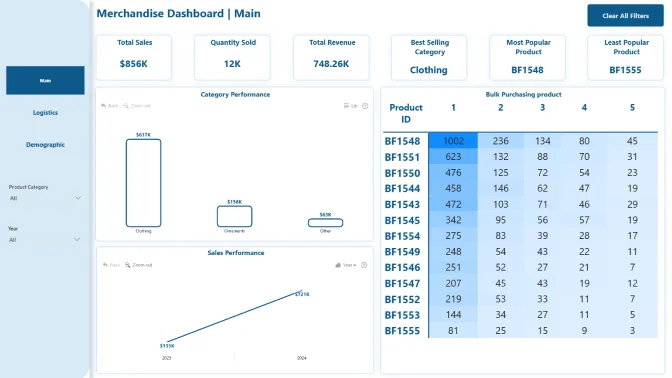
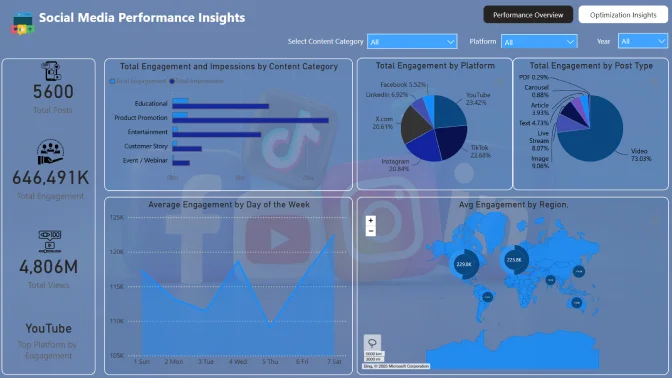
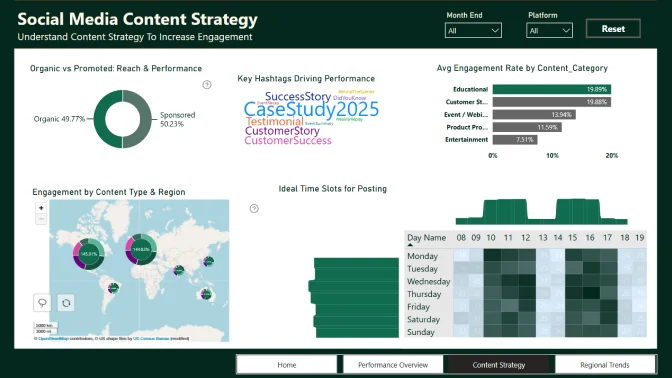
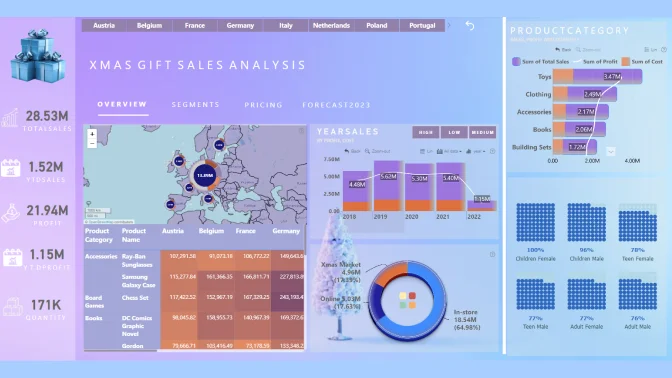
See our Power BI templates for new ideas to implement within your own reports. Explore interactive report examples of sales, banking, HR and other kinds of data. Click on each template to view in more detail. Download pbix and start interacting.
2400+
Power BI Templates
1000+
Report creators
100+
New monthly reports
1M+
Report views
Free to preview & interact
Showing:
4U Reports
Reports that earn attention, built on four user-centered qualities: Unique, User-friendly, Uncovering, and Understandable.
Designed to be opened, explored, understood, and acted upon.