Feel free to leave your vote:
1
Share template with others
Summary
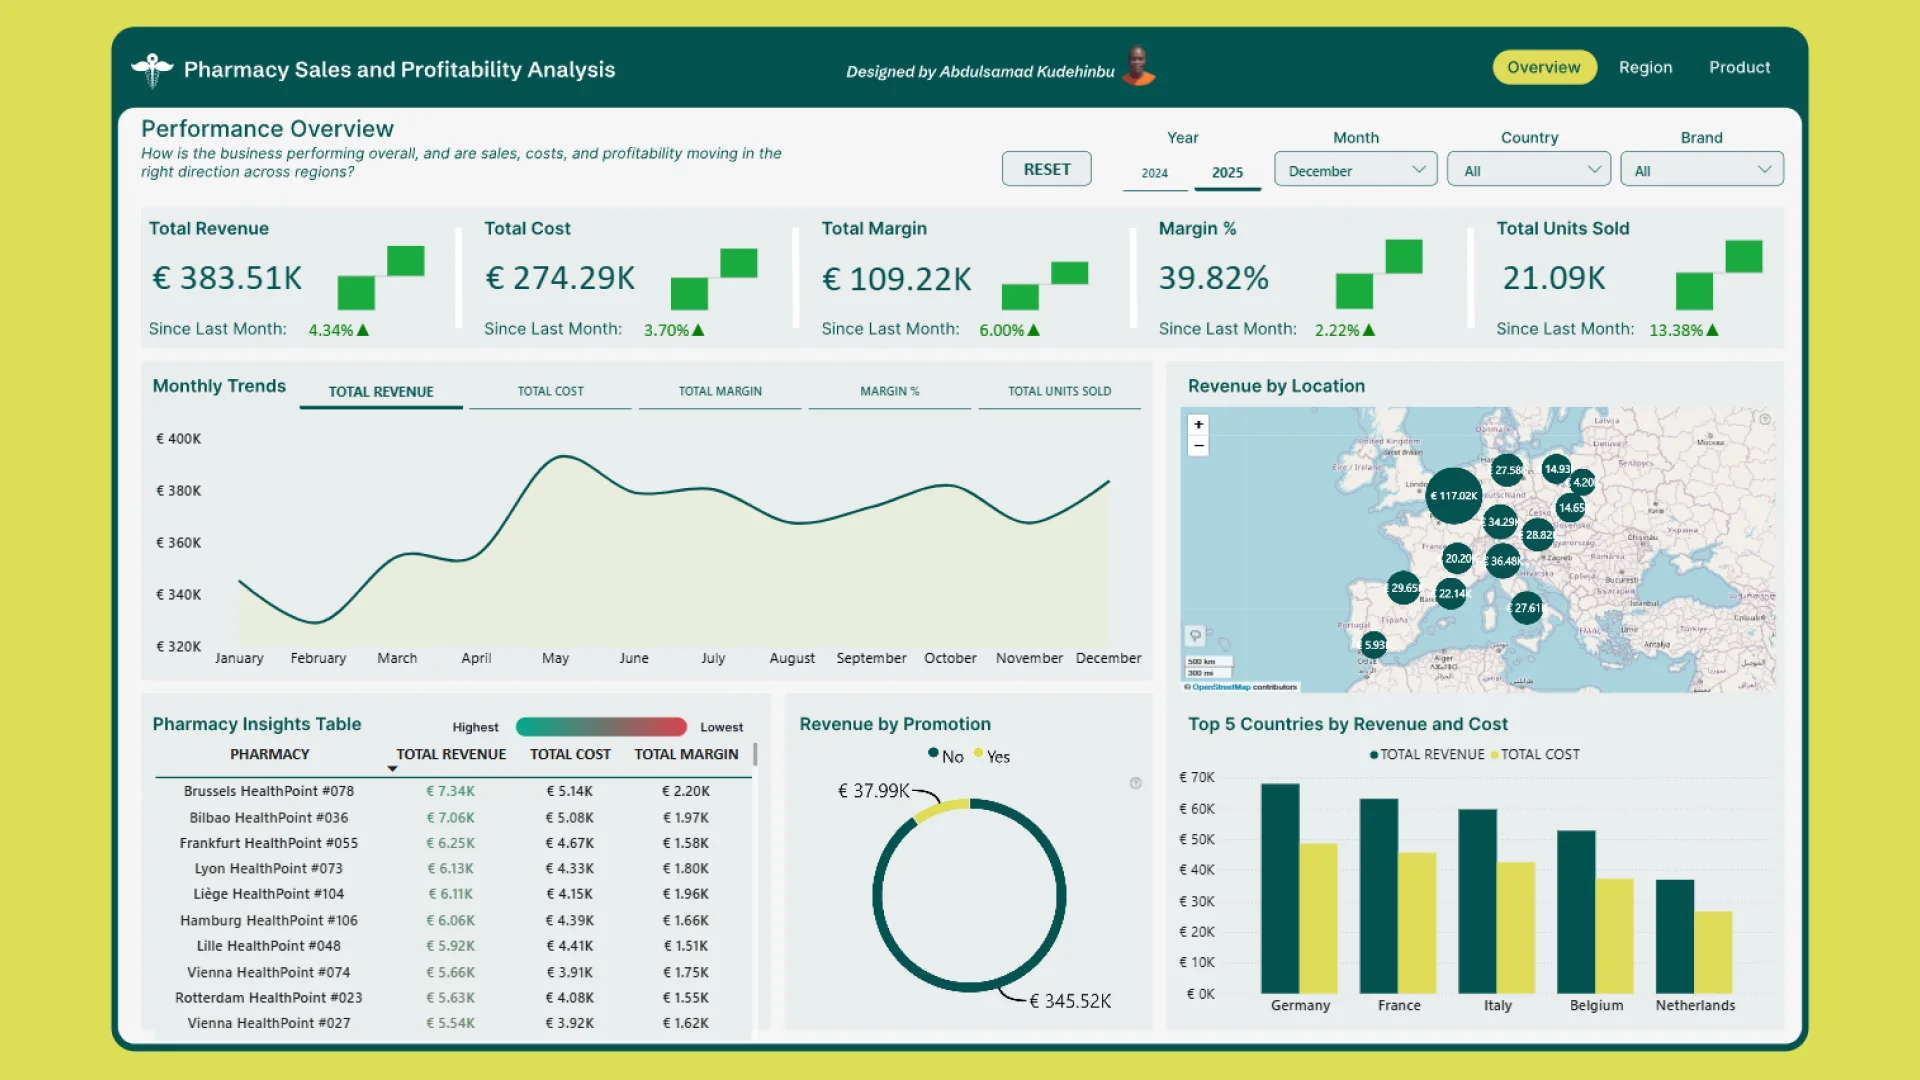
This Power BI report uses the Pharmacy Sales and Profitability dataset. The report features ZoomCharts Drill Down PRO custom visuals for Power BI. It was submitted to the Onyx Data DataDNA ZoomCharts Mini Challenge in January - February 2026.
Author’s Description:
In this project I built a 3-page Power BI Pharmacy Sales & Profitability report that helps regional and country managers track revenue, costs, margins, regional performance, and product profitability in one view using DAX-driven KPIs, clear storytelling, and decision-focused insights.
Mobile view allows you to interact with the report. To Download the template please switch to desktop view.