logo
For Power BI
  • Products
    • Drill Down Donut Pro Drill Down Donut PRO
    • Drill Down Pie Pro Drill Down Pie PRO
    • Drill TimeSeries Pro Drill Down TimeSeries PRO
    • Drill Combo Pro Drill Down Combo PRO
    • Drill Map Pro Drill Down Map PRO
    • Drill Scatter Pro Drill Down Scatter PRO
    • Drill Down Network Pro Drill Down Network PRO
    • Drill Down Waterfall Pro Drill Down Waterfall PRO
    • Drill Down Graph Pro Drill Down Graph PRO
    • Drill Down Timeline Pro Drill Down Timeline PRO
    • Drill Down Combo Bar PRO Drill Down Combo Bar PRO

    Video tutorials

    Watch Now

    More than 90 videos on how to enhance Power BI with ZoomCharts

    Learn more
    All visuals
  • Resources

      Resources

    • Documentation
    • Report Examples
    • Blog
    • Webinars
    • Video Tutorials
    • Visuals Gallery

    Support

    • ZoomCharts Assistance
    • Contact Sales
    • Contact Support
    • FAQ

    Challenges

    Challenges

    Improve your report creation skills by participating in free challenges for report creators.

    Learn more
    Start trial
  • Services
    • Power BI Report Development
    • Custom Visual Development
  • Challenges
  • Pricing
Request a quote Start Free Book a Demo Sign in
Get it now
Go back

Contents

Go back

FP20 Analytics Challenge 13: EDUCATION MANAGEMENT DASHBOARD

Report Author: Moronkola Roseline

Report
Report Interact

Feel free to leave your vote:

0

Share template with others

Summary

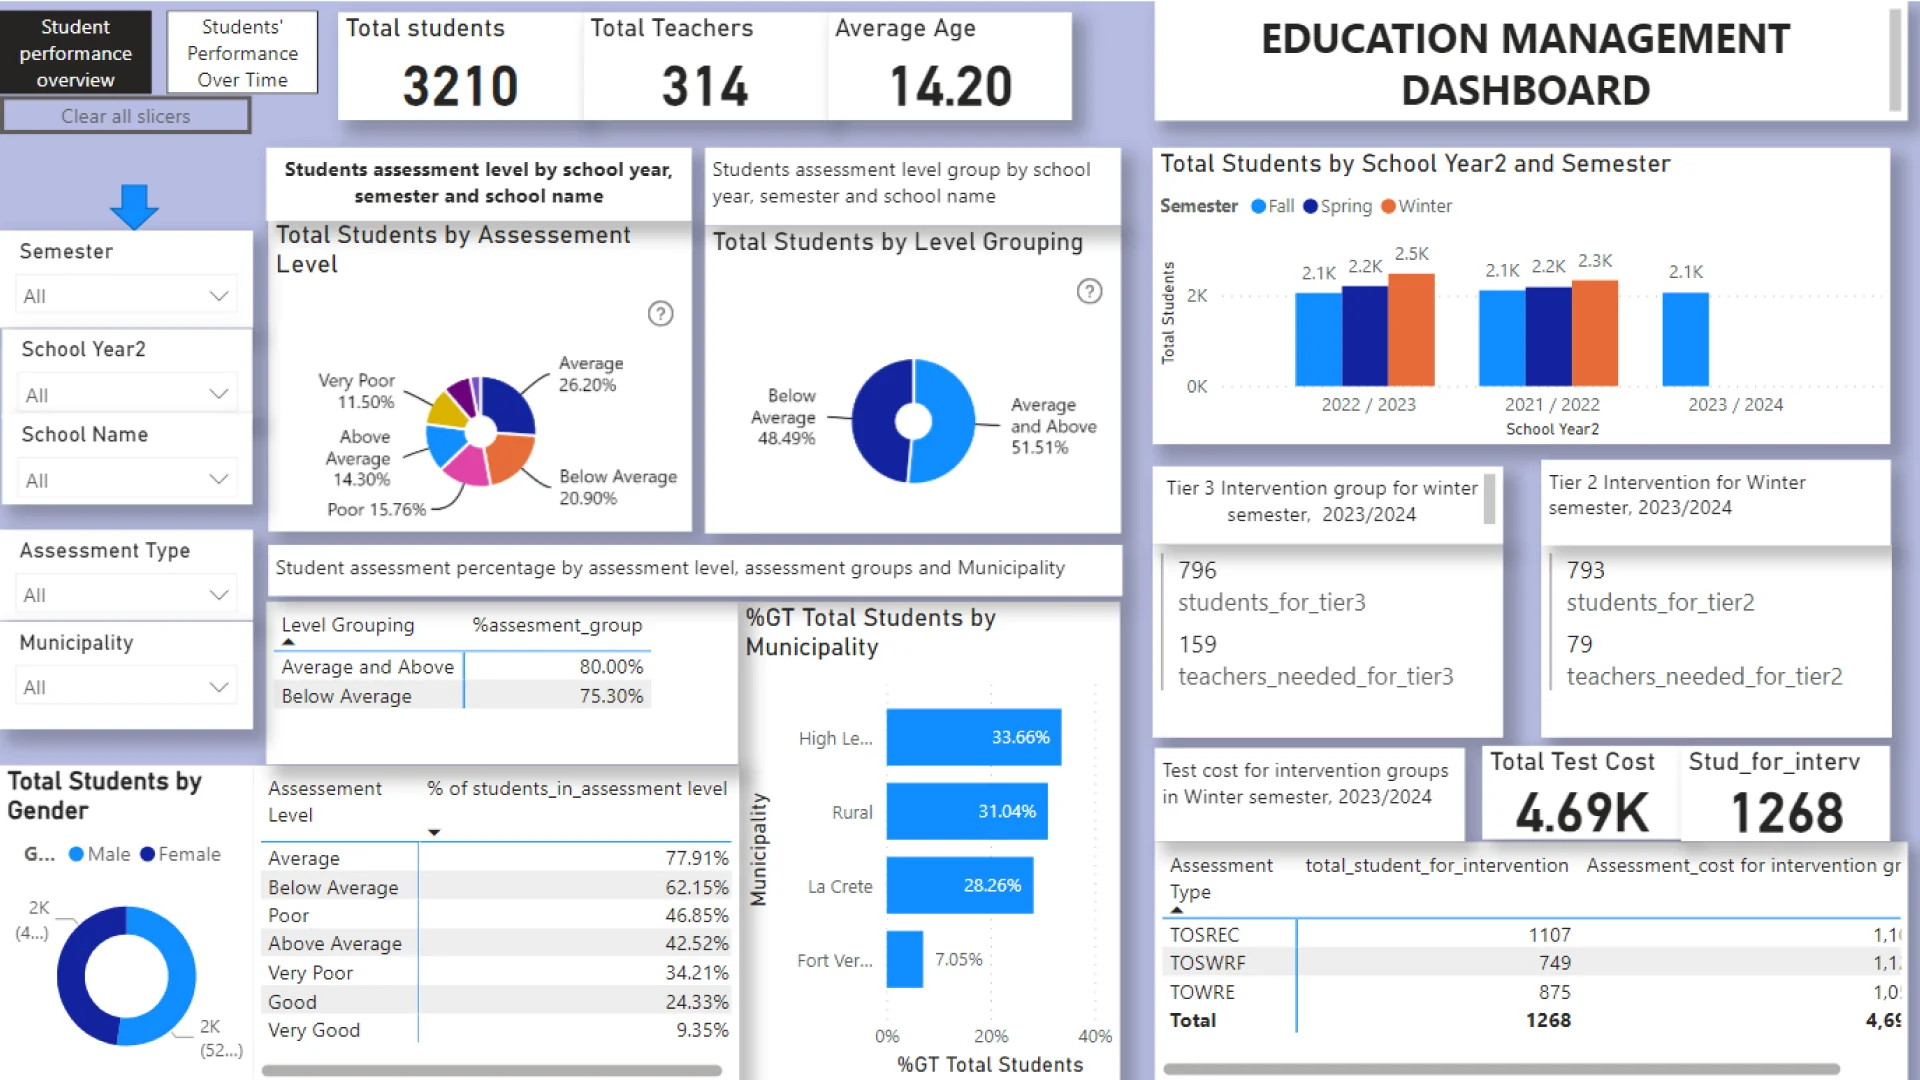
Report submitted for FP20 Analytics ZoomCharts Challenge 13 (Jan 17 – Feb 15, 2024). The report was built with Education Management dataset and includes ZoomCharts custom Drill Down PRO visuals for Power BI. 

Author's description:
INSIGHTS
Students' gender: There are 52% male and 48% female
Assessment level: 3.14% were very good, 8.18% were good, 14.30% were above average while others were either below average, poor, or very poor. However, students with assessment levels of average and below (below average, poor, very poor) are considered to have poor results and will fall into the intervention groups tier 2 or tier3

Intervention groups:
tier 3 intervention group has 796 students and 159 teachers, with 5 students per teacher
tier 2 intervention group has 793 students and 59 teachers, with 10 students per teacher
The Intervention group classes start in the winter semester of the 2023/2024 school year and the students involved are determined based on student's performance in the fall semester of the 2022/2023 school year
The cost of organizing intervention groups for students is $4.69k

Comparing semesters among the school years:
fall 2021/2022 There is a general decrease in student performance across all assessment level
fall 2022/2023 There is an increase in students with below-average and poor assessment levels indicating poor performance in other assessment levels
spring_2021/2022-2022/2023 There is a positive increase in student performance, however, there was a decrease in the number of students with average assessment level
winter 2021/2022-2022/2023There is a general increase in students performance across all assessment levels

change in students' assessment level comparing semesters:
students tend to perform better in winter and spring than in fall
Average standard score: 93.5
Average grade during assessment:5
Students' average age:14 years

ZoomCharts visuals used

Drill Down Pie PRO Drill Down Pie PRO
Drill Down Donut PRO Drill Down Donut PRO

Mobile view allows you to interact with the report. To Download the template please switch to desktop view.

Try it in your Power BI!

New here? Fill up the form below and download!

Enjoy!

Success

Thank you for downloading the template!
We have sent a download link to your email.

For any questions, please contact us at ZoomCharts Assistance

Log in

Forgot password

Reset Password

FP20 Analytics Challenge 13: EDUCATION MANAGEMENT DASHBOARD

Share

Unfortunately this report file could not be downloaded. Please try again later.

You can contact support using chat or via email [email protected]

logo
[email protected]
+44 204 577 3993
logo

Products

Drill Down Network PRO Drill Down Waterfall PRO Drill Down Graph PRO Drill Down Combo PRO Drill Down Combo Bar PRO Drill Down Donut PRO Drill Down Pie PRO Drill Down TimeSeries PRO Drill Down Timeline PRO Drill Down Map PRO Drill Down Scatter PRO All Visuals

Resources

Report Examples Webinars Blog ZoomCharts Academy Visuals Gallery Documentation Custom Visual Development Subscribe to News

Solutions

Custom Visual Development

Company

Pricing About Us Partners Leave feedback Join PowerGroup EU Funding

Help

ZoomCharts Assistance Contact Sales Contact Support FAQ

Drill Down Network PRO Drill Down Waterfall PRO Drill Down Graph PRO Drill Down Combo PRO Drill Down Combo Bar PRO Drill Down Donut PRO Drill Down Pie PRO Drill Down TimeSeries PRO Drill Down Timeline PRO Drill Down Map PRO Drill Down Scatter PRO All Visuals

Report Examples Webinars Blog ZoomCharts Academy Visuals Gallery Documentation Custom Visual Development Subscribe to News

Custom Visual Development

Pricing About Us Partners Leave feedback Join PowerGroup EU Funding

ZoomCharts Assistance Contact Sales Contact Support FAQ
+44 204 577 3993
[email protected]

Ready to get in touch?

Contact our experts with any question about Power BI and ZoomCharts for Free!

Contact us

© 2025, Data Visualization Software Lab

U.S. Patents No. 11,645,343; 11,921,804

Cookies Policy
Manage cookies
Privacy Policy
Global
EULA
Patent
warning

Error message

success

Success info: Done!

ZoomCharts AI Assistant

We noticed you're using an old OS version.

For the best experience, we recommend upgrading to ensure that all website features display correctly.

Cookie settings

We use necessary cookies for site functionality, as well as statistic, marketing, and preference cookies to enhance your experience. For more information and to manage your preferences, please visit our Cookie policy