logo
For Power BI
  • Products
    • Drill Down Donut Pro Drill Down Donut PRO
    • Drill Down Pie Pro Drill Down Pie PRO
    • Drill TimeSeries Pro Drill Down TimeSeries PRO
    • Drill Combo Pro Drill Down Combo PRO
    • Drill Map Pro Drill Down Map PRO
    • Drill Scatter Pro Drill Down Scatter PRO
    • Drill Down Network Pro Drill Down Network PRO
    • Drill Down Waterfall Pro Drill Down Waterfall PRO
    • Drill Down Graph Pro Drill Down Graph PRO
    • Drill Down Timeline Pro Drill Down Timeline PRO
    • Drill Down Combo Bar PRO Drill Down Combo Bar PRO

    Video tutorials

    Watch Now

    More than 90 videos on how to enhance Power BI with ZoomCharts

    Learn more
    All visuals
  • Resources

      Resources

    • Documentation
    • Report Examples
    • Blog
    • Webinars
    • Video Tutorials
    • Visuals Gallery

    Support

    • ZoomCharts Assistance
    • Contact Sales
    • Contact Support
    • FAQ

    Challenges

    Challenges

    Improve your report creation skills by participating in free challenges for report creators.

    Learn more
    Start trial
  • Services
    • Power BI Report Development
    • Custom Visual Development
  • Challenges
  • Pricing
Request a quote Start Free Book a Demo Sign in
Get it now
Go back

Contents

Go back

Share

Logo

Welcome to the FP20 Analytics January 2024 Challenge!

Jan 16 - Feb 20, 2024 | EST

Try your hand at strategic planning in education with a real-life data use case.

Timeline

Registration Open

Registration Open

16 January | 19:00

-

Submissions Open

Submissions Open

16 January | 19:00

-

Workshop | FP20 Analytics Challenge 13: Education Management with ZoomCharts

Workshop | FP20 Analytics Challenge 13: Education Management with ZoomCharts

06 February | 09:00

-

1:1 Mentoring Sessions

1:1 Mentoring Sessions

06 February | 09:00

16 January - 14 February

Entry Submission Deadline

Entry Submission Deadline

14 February | 19:00

16 January - 14 February

Webinar | FP20 Analytics Challenge 13: ZoomCharts Award Winner

Webinar | FP20 Analytics Challenge 13: ZoomCharts Award Winner

21 February | 11:00

16 January - 14 February

Winner Announced

Winner Announced

21 February | 11:00

16 January - 14 February

Dataset

Get the dataset

See past FP20 Analytics challenges

See past challenges

Share the challenge

Submitted Reports
About challenge
How to participate
The Brief
Judging criteria
Timeline
Dataset
Past challenges

Winner of the challenge

Report Card

Analysis of the Evaluation Level

Author: Norman Reynaldo Sabillon Castro

15

View Report

All Submissions

Report Card

Data-driven Insights for Educational Planning

Author: Prathamesh Sawant

4

View Report
Report Card

FP20 Analytics Data-Driven Education Management Ajay Singh

Author: Ajay Singh

4

View Report
Report Card

Education Management Isabelle Bittar

Author: Isabelle Bittar

6

View Report
Report Card

FP20 Analytics Challenge 13: Data-Driven Education Management

Author: Lashmi Dissanayake

6

View Report
Report Card

Education Management

Author: Eszter Kovacs

0

View Report
Report Card

Adrián Alvarez FP20 Data driven education

Author: Adrián Álvarez Molina

0

View Report
Report Card

FP20 Data-Driven Education Management Challenege by Arun

Author: Arun Goyal

0

View Report
Report Card

Education Report FP20 Analytics ZoomCharts Challenge

Author: Roberto Vallejos

0

View Report
Report Card

FP20 Challenge Fort Vermilion School Division analysis

Author: Praise (Temi) Olawoyin

1

View Report
Report Card

FVSD Data Analysis Toyin Taiwo

Author: Toyin Taiwo

0

View Report
Report Card

Education Management System

Author: Oluwatoyin Senu

0

View Report
Report Card

Fort Vermilion School Division Summary

Author: Minh Đặng

0

View Report
Report Card

FP20 Analytics Challenge 13: EDUCATION MANAGEMENT DASHBOARD

Author: Moronkola Roseline

0

View Report
Report Card

FP20 Analytics January 2024 report

Author: Floris Moest

6

View Report
Report Card

FP20 Analytics Challenge 13 - Data-Driven Education Management

Author: King Joseph

0

View Report

About FP20 Analytics ZoomCharts Challenge

The ZoomCharts challenge is hosted in partnership with FP20 Analytics – a group that unites passionate and inspiring data enthusiasts, and helps new data analysts improve their skills and build a competitive portfolio. Join in and sharpen your skills together with this open and friendly data community. Read more about the challenges on the FP20 Analytics website. Join the community on LinkedIn.

Participate in FP20 Analytics ZoomCharts Challenge to enrich your skill in creating excellent Power BI reports that help business users explore data quickly and intuitively. 

  1. Free License: All participants receive a free ZoomCharts Developer License that gives access to the full Drill Down PRO visuals library. License will remain active for 1 year after the challenge.
  2. Learn from Experienced Professionals: As part of the challenge, we host live workshops on report building and visualizing the challenge’s dataset in Power BI. Challenge participants can also book an individual consultation with an experienced Power BI mentor to ask questions and get personalized tips.
  3. Tailored Feedback: Every challenge submission will receive personalized feedback, giving participants the chance to hone their skills and improve their reports.

Prizes

The best report’s creator will receive a $300 Amazon gift card from ZoomCharts. The winner will be announced in a special live webinar session on February 21, where we will review the top entries from the challenge. 

Webinar recordings

Recording thumbnail

FP20 Analytics Challenge 13: Education Management with ZoomCharts

ZoomCharts workshop for FP20 Analytics Challenge 13 participants

Watch the recording
Recording thumbnail

FP20 Analytics Challenge 13: ZoomCharts Award Winner

Analyzing TOP 5 submissions and revealing the ZoomCharts winner

Watch the recording

How to participate?

  1. Register and receive a Drill Down Visuals Developer License for Power BI.
  2. Download the challenge dataset.
  3. Use the dataset to build a Power BI report with ZoomCharts Drill Down Visuals.
  4. Submit your entry to be verified.
    (If your submission doesn’t match the challenge criteria, you will be notified by email, so make sure you will have time for revision and resubmission if needed. Feel free to resubmit the entry as many times as necessary before the deadline)
  5. Upload your publish to web link on NovyPro. 

    Note: If you opt to post your report on NovyPro, for instructions on how to do this, refer to the provided video link. 
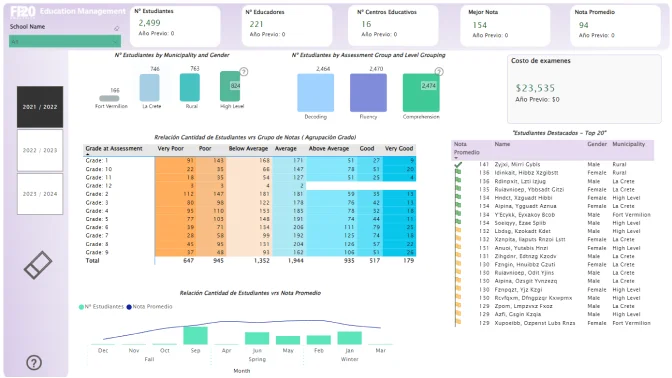
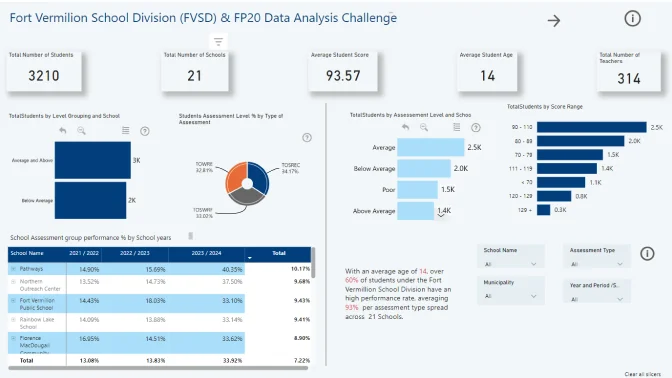
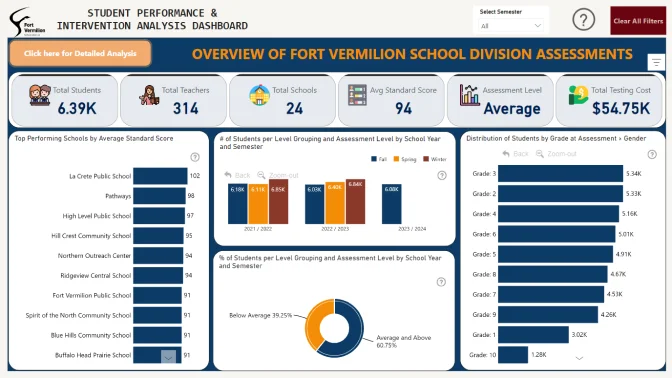
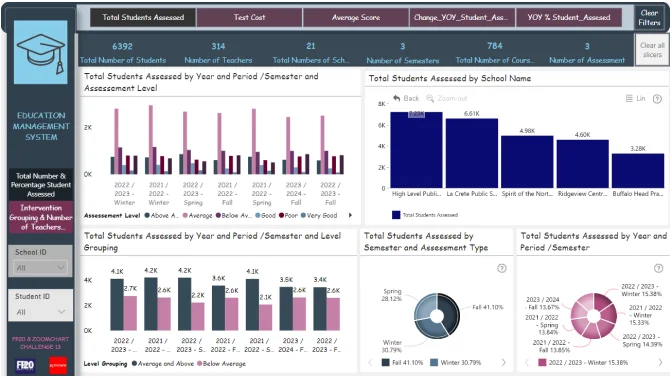
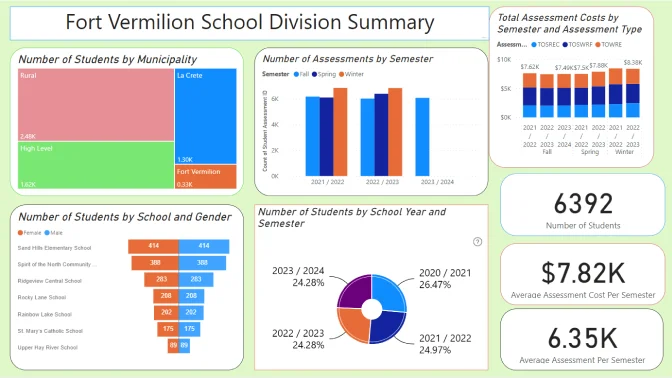
    NovyPro: https://www.novypro.com/
    Instruction Video: https://www.youtube.com/watch?v=jkcAYgFGWUY 
  6. Post your submission on LinkedIn:
    • Upload the report as a PDF document on your LinkedIn feed.
    • Use the caption, “I am participating in FP20 Analytics Challenge 13”, along with screenshots from your report.
    • Include a brief summary about your report's key insights and publish to web or NovyPro link.
    • Use the hashtags #FP20Analytics, #FP20AnalyticsEducationAnalysis, #builtwithzoomcharts, tag @Federico Pastor and @Zoomcharts.
    • Additionally, post your report in the FP20 Analytics LinkedIn Community Group.
  7. Follow ZoomCharts on LinkedIn

About the dataset

The Fort Vermilion School Division (FVSD) is a governmental organization responsible for overseeing schools in the northwestern corner of Alberta, Canada. FVSD is renowned for their commitment to data-driven planning and decision-making to empower every student with equal opportunities and care in education. For this challenge, FVSD have contributed their data so you can practice your skills with a real-world use case.

Background information to help you understand the data

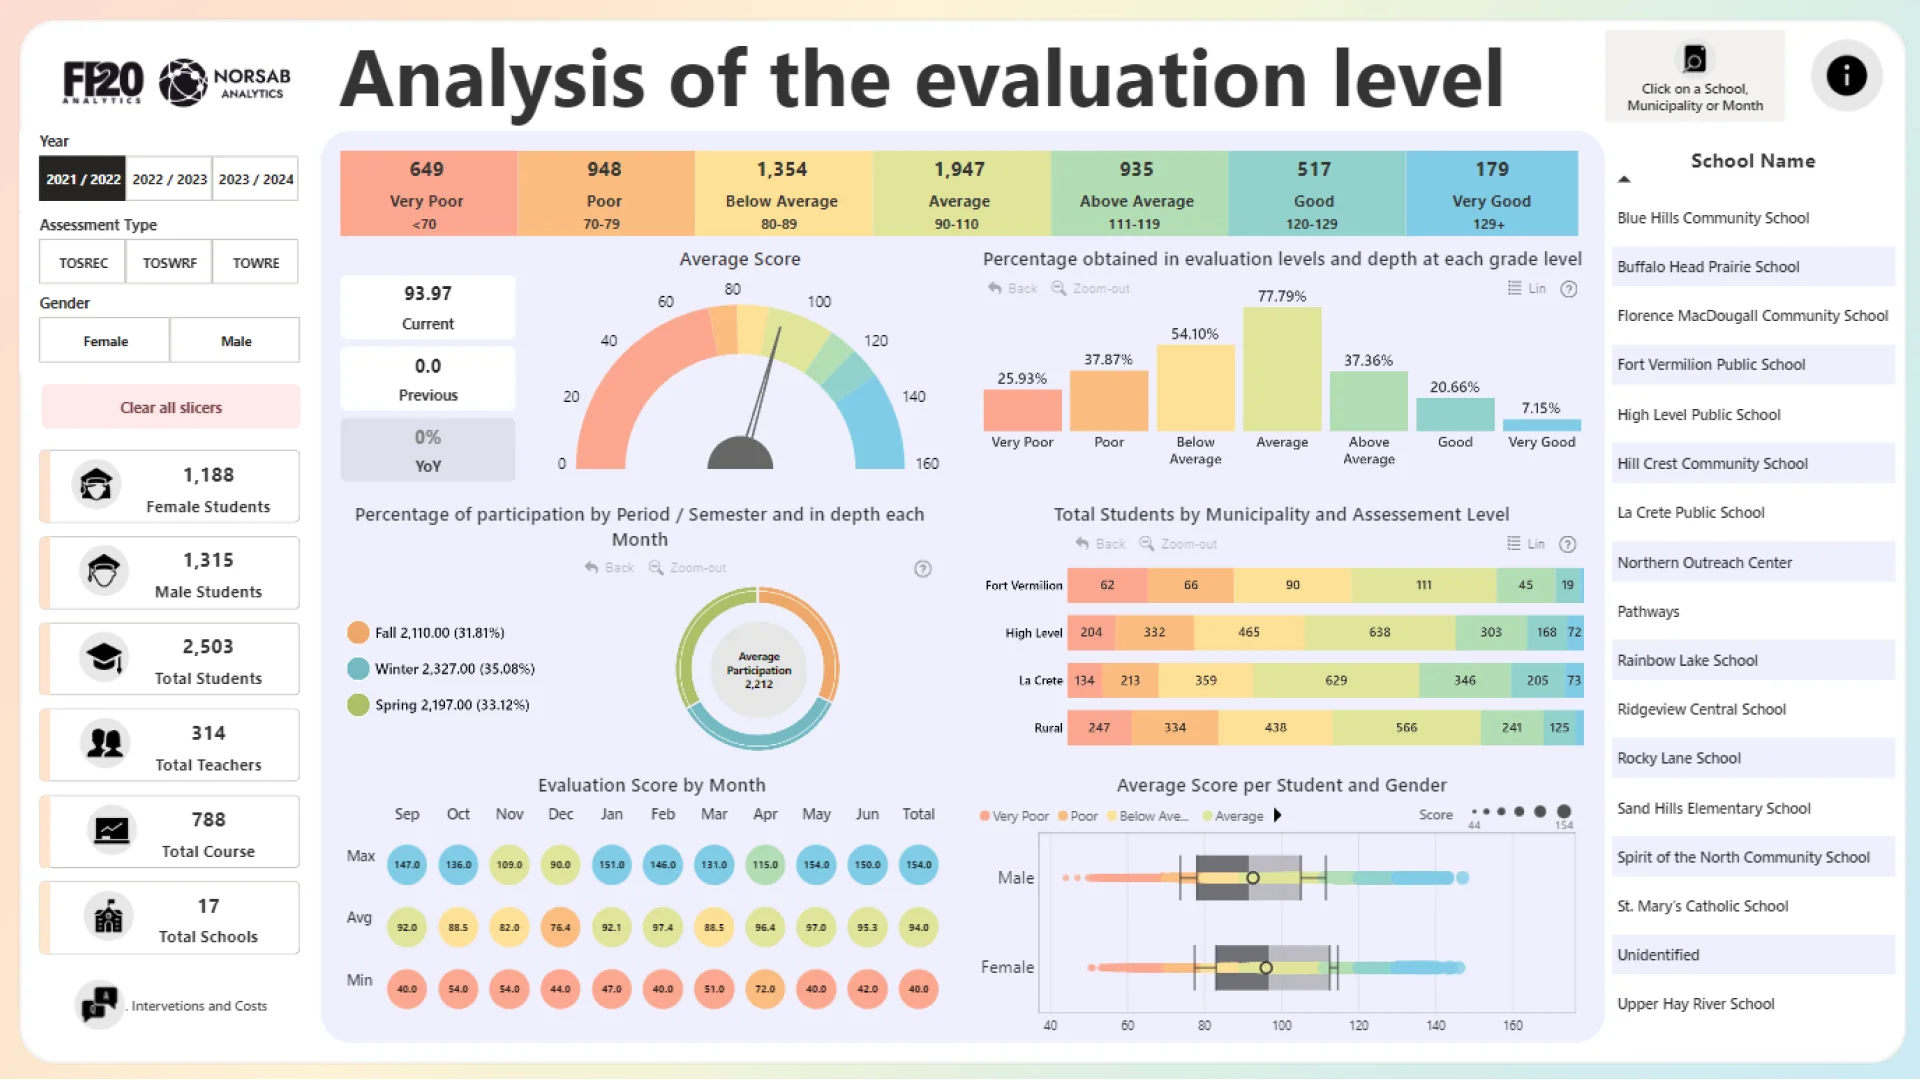
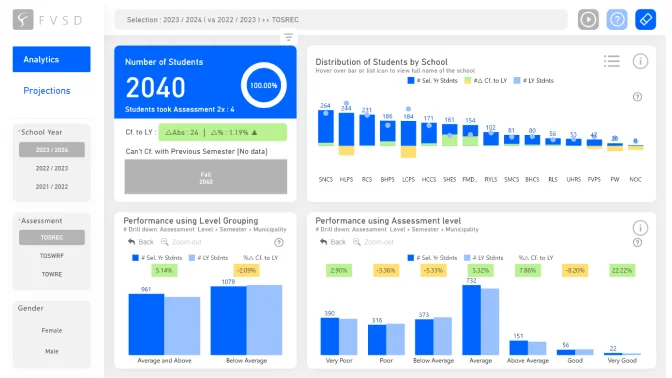
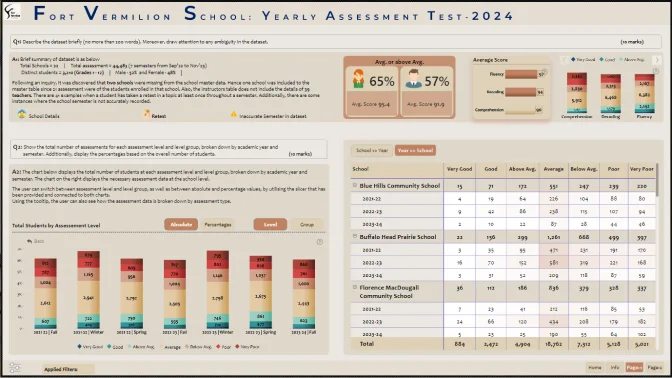
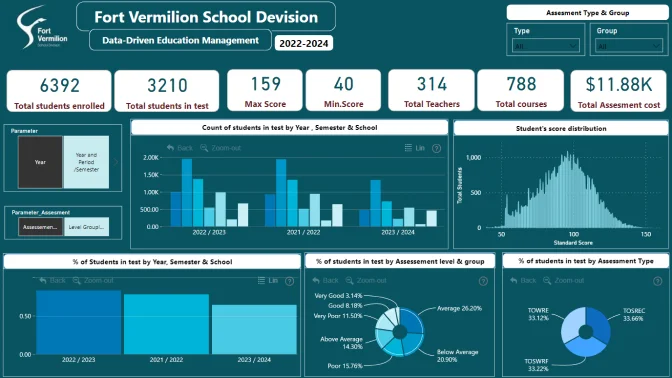
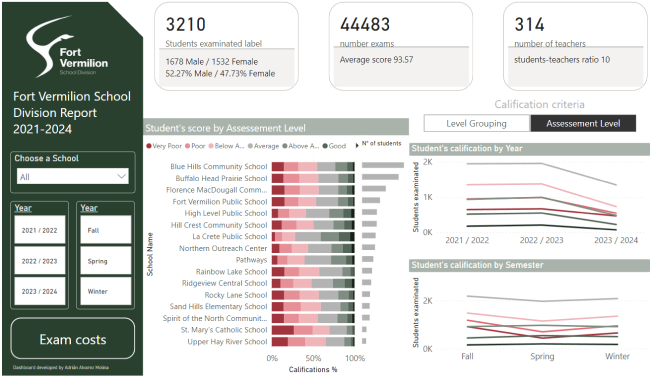
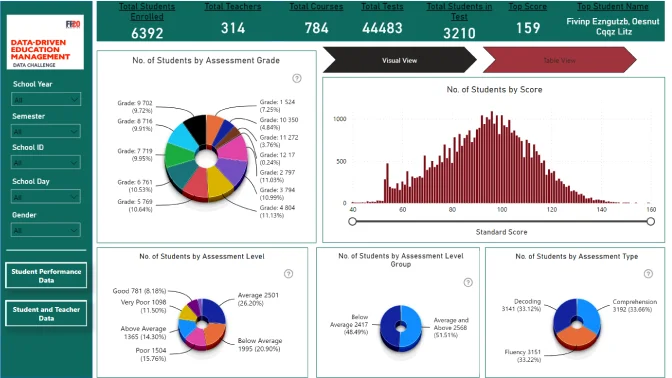
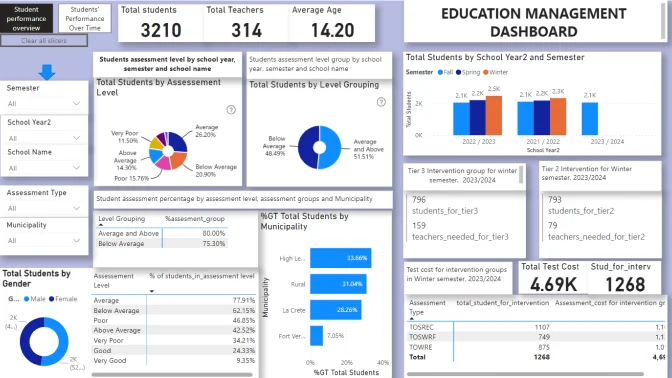
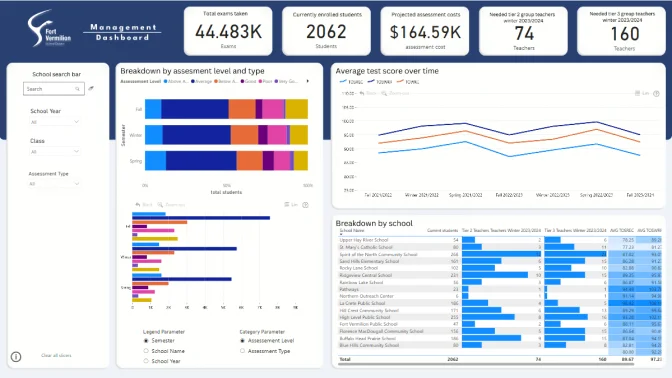
The school year is split into 3 semesters (Fall, Winter, and Spring). Each student is assessed each semester using three test (assessment) types — TOSREC, TOWRE and TOSWRF — using a standard score system. For each test, there is a known associated cost per student.  

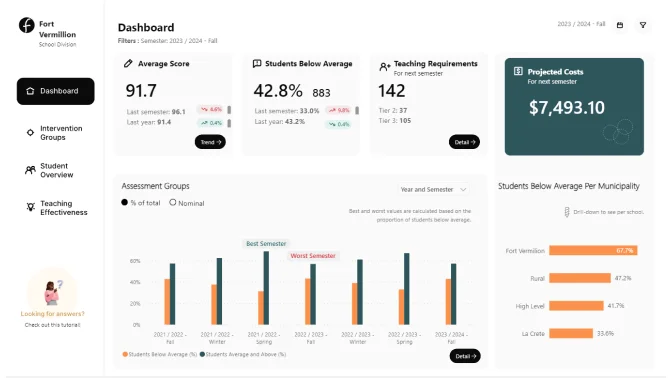
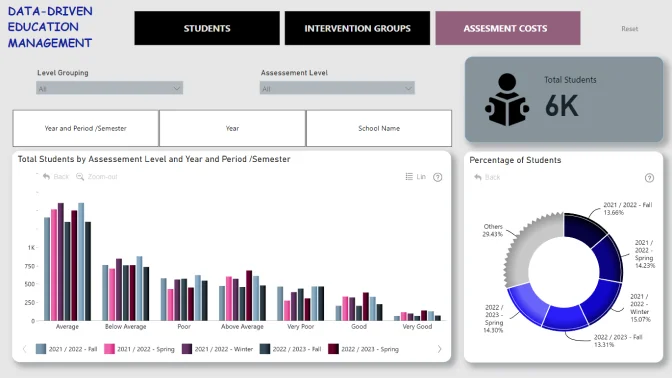
Based on the received score, students are split into groups indicating their performance level. Two types of grouping are used: 1) assessment level (very poor, at risk, good etc.), and 2) assessment level grouping (below average or average and above). Students with poor test results are required to take additional classes (Intervention groups), where each group contains 5 or 10 students depending on the test score, and require additional teacher resources. 


What should your report include?

Create a report that allows end users to easily find answers to the following questions: 

1. Total number of students per each assessment level broken down by: 

  • Semester (Fall, Winter, & Spring) 
  • School Year 
  • School 

2. Total number of students per each assessment type broken down by 

  • Semester (Fall, Winter, & Spring) 
  • School Year 
  • School 

3. % of students (calculated from the total number of students) per each assessment level broken down by: 

  • Semester (Fall, Winter, & Spring) 
  • School Year 
  • School 

4. % of students (calculated from the total number of students) per each assessment level group broken down by 

  • Semester (Fall, Winter, & Spring) 
  • School Year 
  • School 

5. Students Assessments between 80 and 90 Standard Score in each period go into an Intervention Group (Tier 2). This Group contains 10 Students that requires one Teacher. How Many teachers will we require for these Intervention Groups in Winter of 2023 / 2024 based on 2023 / 2024 Fall Results. 

6. Students Assessments below 80 Standard Score in each period go into an Intervention Group (Tier 3). This Group contains 5 Students that requires one Teacher. How Many teachers will we require for these Intervention Groups in Winter of 2023 / 2024 based on 2023 / 2024 Fall Results. 

7. What are projected testing costs for Winter of 2023 / 2024 based on 2023 / 2024 Fall results? 


Optional: (Division of school years and semesters doesn't follow the traditional logic of Calendar year, and Same Period Last year calculations, and can be very complex to solve. Therefore, for these exercises, we have prepared a date calendar in the model that takes into account the semesters and the yearly split of school years. So please pay attention to the values that are provided) 

  1. Change in the total number of students per each assessment level when compared to previous semester (fall, winter, or spring)
  2. Change in the total number of students per each assessment level when compared to the same semester in the previous school year (e.g., fall 2023 and fall 2022)
  3. % change in number of students per each assessment level when compared to previous semester (fall, winter, or spring)
  4. % change in number of students per each assessment level when compared to the same semester in the previous school year (e.g., fall 2023 and fall 2022)
  5. Showcase the average score trend throughout the years / semesters 

Tip:  This information can be displayed in separate charts or in drill down levels. 

Technical requirements

  • Build your report using only Power BI 
  • Reports are restricted to a maximum of 2 pages 
  • Canvas size is 16:9 (Default Power BI size) or Full HD size = w:1920 - h:1080 
  • The report should contain at least 2 ZoomCharts Drill Down visuals within a single page. See a practical guide for using Drill Down visuals here

Judging criteria

Business users use reports to make data-driven decisions. That’s why reports are called effective if they enable users to drill down and filter data quickly and intuitively to find answers to any question they might have and analyse data in all possible directions and dimensions. We will evaluate:

  1. How easy is it to understand the data? (max 10 points)
    • Is too much text used for explanation?
    • Are the indicative colors in charts instinctually understandable?
    • Does it tell a story?
  2. How easy-to-use is the report? (max 14 points)
    • Cross-chart filtering implementation across the report. Can other visuals provide relevant data as the user explores the report?
    • Response time
    • Drill Down: multi-layer data exploration. Can the user drill down and gain additional insights within the report?
    • Use of tutorial overlays and other elements to assist new users. Can a new user start using this report straight away with just the guidance provided within the report itself?
  3. How good is the report design and is it suitable for its purpose? (max 10 points)
    • Visual design: is the overall look consistent, no empty spaces, no overcrowding?
    • Interface design: are there unnecessary visualisations/buttons/complexity in use?
    • UX design: is the produced report usable?
    • Report design: is the main challenge answered?
    • Technical: are all the fonts used the same, are the sizes readable?

You are encouraged to use various techniques at your disposal, such as tooltips, drill-throughs, drill-downs, cross-chart filtering and page navigation features, to enhance your analysis.

Timeline

Registration Open

Registration Open

16 January | 19:00

-

Submissions Open

Submissions Open

16 January | 19:00

-

Workshop | FP20 Analytics Challenge 13: Education Management with ZoomCharts

Workshop | FP20 Analytics Challenge 13: Education Management with ZoomCharts

06 February | 09:00

-

1:1 Mentoring Sessions

1:1 Mentoring Sessions

06 February | 09:00

16 January - 14 February

Entry Submission Deadline

Entry Submission Deadline

14 February | 19:00

16 January - 14 February

Webinar | FP20 Analytics Challenge 13: ZoomCharts Award Winner

Webinar | FP20 Analytics Challenge 13: ZoomCharts Award Winner

21 February | 11:00

16 January - 14 February

Winner Announced

Winner Announced

21 February | 11:00

16 January - 14 February

Dataset

Get the dataset

See past FP20 Analytics January 2024 challenges

See past challenges

Your Drill Down Visuals Developers License

Use the email and password provided below to log in Power BI Desktop and access an account with a license to use all ZoomCharts Drill Down Visuals.

Upon logging in, you will need to change your password and enable two-factor authentication. If you encounter any problems, feel free to reach out to us via chat.

*This Developer License can be used to create a report for this ZoomCharts Mini Challenge or for your personal training purposes. Commercial use of this license is prohibited.

Upload failed
Attach file
File requirements: 16MB

Any questions? Feel free to use chat!

Are you sure you want to delete the report?

Activate your Drill Down visuals Developer License!

You can use these credential to access ZoomCharts visuals and create your report for this ZoomCharts Mini Challenge, or for your personal training purposes.


logo
[email protected]
+44 204 577 3993
logo

Products

Drill Down Network PRO Drill Down Waterfall PRO Drill Down Graph PRO Drill Down Combo PRO Drill Down Combo Bar PRO Drill Down Donut PRO Drill Down Pie PRO Drill Down TimeSeries PRO Drill Down Timeline PRO Drill Down Map PRO Drill Down Scatter PRO All Visuals

Resources

Report Examples Webinars Blog ZoomCharts Academy Visuals Gallery Documentation Custom Visual Development Subscribe to News

Solutions

Custom Visual Development

Company

Pricing About Us Partners Leave feedback Join PowerGroup EU Funding

Help

ZoomCharts Assistance Contact Sales Contact Support FAQ

Drill Down Network PRO Drill Down Waterfall PRO Drill Down Graph PRO Drill Down Combo PRO Drill Down Combo Bar PRO Drill Down Donut PRO Drill Down Pie PRO Drill Down TimeSeries PRO Drill Down Timeline PRO Drill Down Map PRO Drill Down Scatter PRO All Visuals

Report Examples Webinars Blog ZoomCharts Academy Visuals Gallery Documentation Custom Visual Development Subscribe to News

Custom Visual Development

Pricing About Us Partners Leave feedback Join PowerGroup EU Funding

ZoomCharts Assistance Contact Sales Contact Support FAQ
+44 204 577 3993
[email protected]

Ready to get in touch?

Contact our experts with any question about Power BI and ZoomCharts for Free!

Contact us

© 2025, Data Visualization Software Lab

U.S. Patents No. 11,645,343; 11,921,804

Cookies Policy
Manage cookies
Privacy Policy
Global
EULA
Patent
warning

Error message

success

Success info: Done!

ZoomCharts AI Assistant

We noticed you're using an old OS version.

For the best experience, we recommend upgrading to ensure that all website features display correctly.

Cookie settings

We use necessary cookies for site functionality, as well as statistic, marketing, and preference cookies to enhance your experience. For more information and to manage your preferences, please visit our Cookie policy