Feel free to leave your vote:
0
Share template with others
Summary
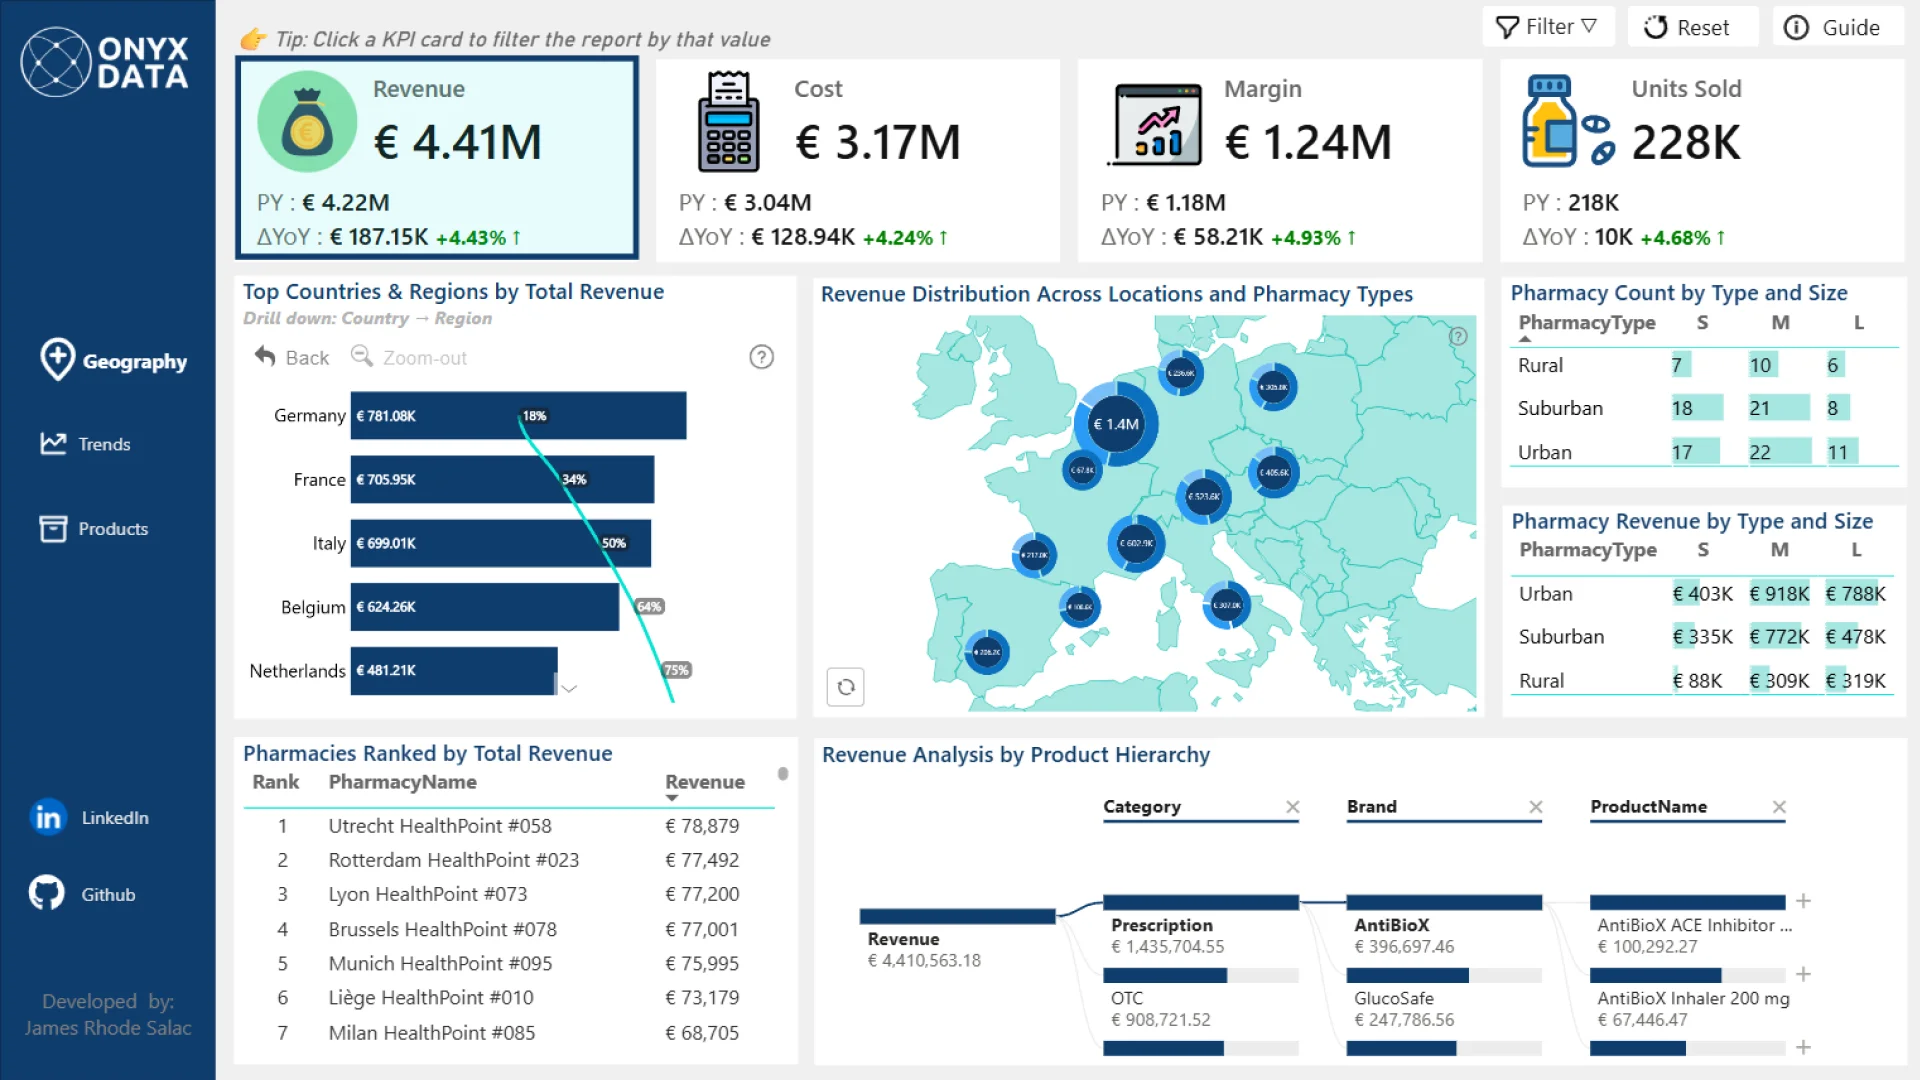
This Power BI report uses the Pharmacy Sales and Profitability dataset. The report features ZoomCharts Drill Down PRO custom visuals for Power BI. It was submitted to the Onyx Data DataDNA ZoomCharts Mini Challenge in January - February 2026.
Author’s Description:
Power BI dashboard for a European pharmacy chain analyzing sales, profitability, and product performance across countries, regions, and individual pharmacies with interactive KPIs, drill-downs, maps, decomposition trees, time series comparisons, and quadrant analysis to support data-driven decisions.
Mobile view allows you to interact with the report. To Download the template please switch to desktop view.