Feel free to leave your vote:
0
Share template with others
Summary
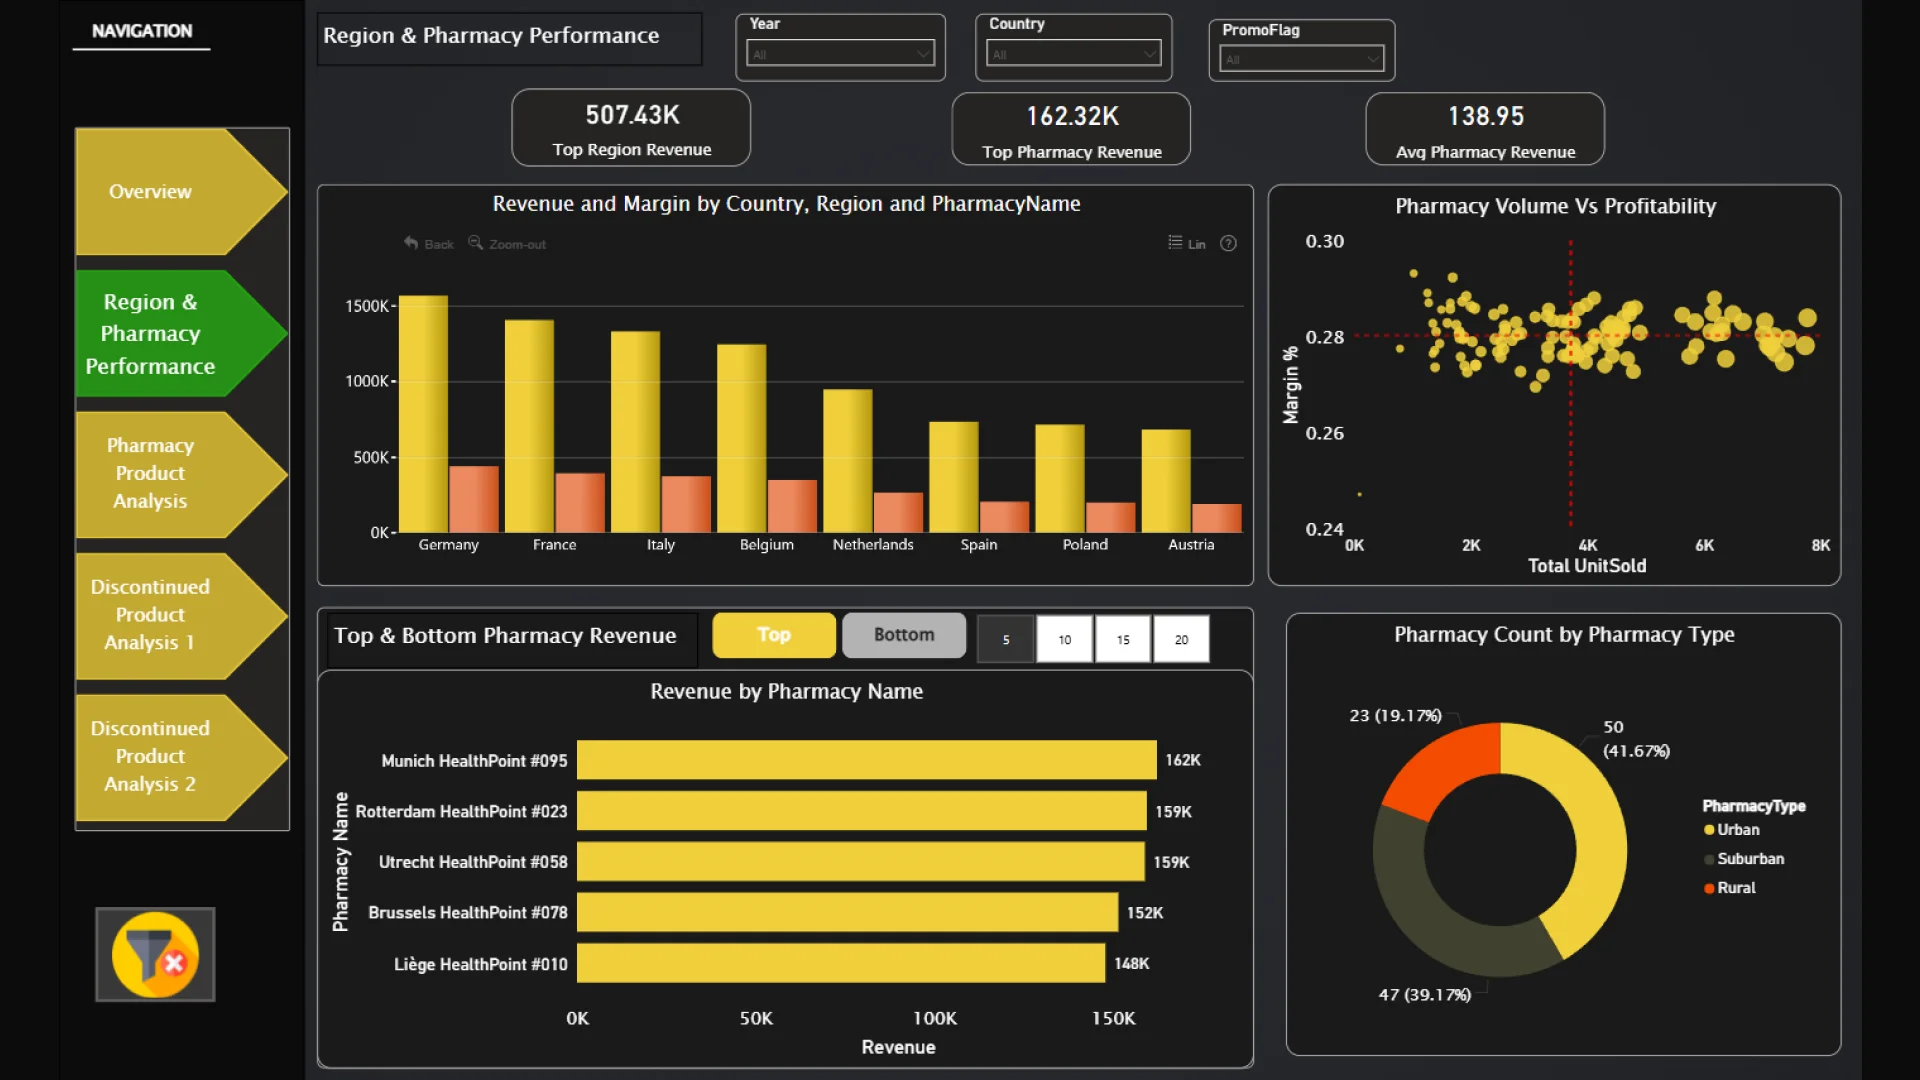
This Power BI report uses the Pharmacy Sales and Profitability dataset. The report features ZoomCharts Drill Down PRO custom visuals for Power BI. It was submitted to the Onyx Data DataDNA ZoomCharts Mini Challenge in January - February 2026.
Author’s Description:
Pharmacy Analytics Dashboard: An interactive Power BI dashboard that transforms pharmacy sales data into actionable insights across revenue, margin, promotions, regions, and product lifecycle, enabling smarter, data-driven business decisions.
Mobile view allows you to interact with the report. To Download the template please switch to desktop view.