logo
For Power BI
  • Products
    • Drill Down Donut Pro Drill Down Donut PRO
    • Drill Down Pie Pro Drill Down Pie PRO
    • Drill TimeSeries Pro Drill Down TimeSeries PRO
    • Drill Combo Pro Drill Down Combo PRO
    • Drill Map Pro Drill Down Map PRO
    • Drill Scatter Pro Drill Down Scatter PRO
    • Drill Down Network Pro Drill Down Network PRO
    • Drill Down Waterfall Pro Drill Down Waterfall PRO
    • Drill Down Graph Pro Drill Down Graph PRO
    • Drill Down Timeline Pro Drill Down Timeline PRO
    • Drill Down Combo Bar PRO Drill Down Combo Bar PRO

    Video tutorials

    Watch Now

    More than 90 videos on how to enhance Power BI with ZoomCharts

    Learn more
    All visuals
  • Resources

      Resources

    • Documentation
    • Report Examples
    • Blog
    • Webinars
    • Video Tutorials
    • Visuals Gallery

    Support

    • ZoomCharts Assistance
    • Contact Sales
    • Contact Support
    • FAQ

    Challenges

    Challenges

    Improve your report creation skills by participating in free challenges for report creators.

    Learn more
    Start trial
  • Services
    • Power BI Report Development
    • Custom Visual Development
  • Challenges
  • Pricing
Request a quote Start Free Book a Demo Sign in
Get it now
Go back

Contents

Go back

Tactical Crime Analysis

Report Author: Goutham Rajasekaran

Report
Report Interact

Feel free to leave your vote:

2

Share template with others

Summary

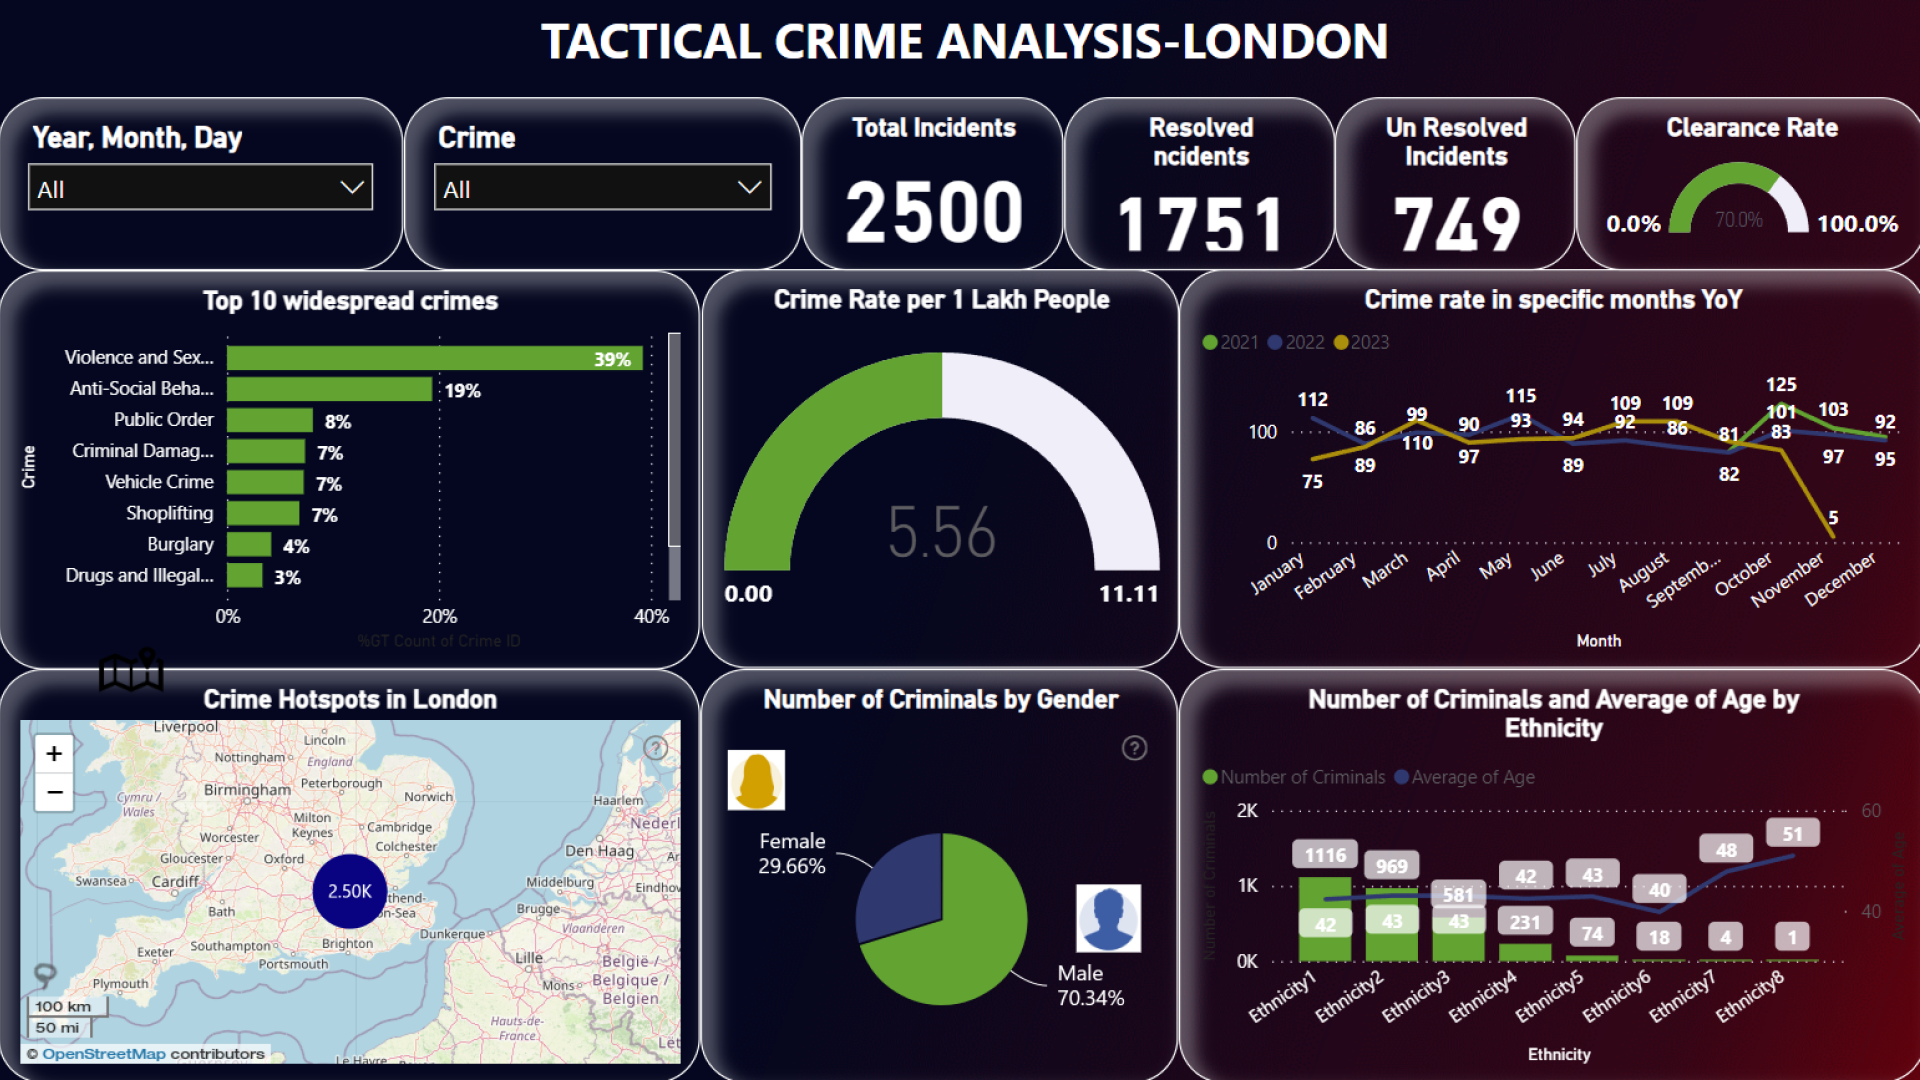
Report submitted for FP20 Analytics ZoomCharts Challenge, November 2023. The report was built with Tactical Crime Analysis dataset and includes ZoomCharts custom Drill Down PRO visuals for Power BI. 

Author's description:
The Tactical Crime Analysis Dashboard in Power BI is a comprehensive solution designed to empower law enforcement agencies and security professionals with actionable insights for effective crime management and response strategies. This project aims to leverage the capabilities of Power BI to provide a user-friendly, visually appealing, and data-driven platform for analyzing and understanding crime patterns at a tactical level.
Key Features: Interactive Crime Maps: Utilize geospatial visualizations to represent crime incidents on an interactive map. Enable users to filter and drill down into specific geographic regions, providing a granular view of crime hotspots.
2. Temporal Analysis: Incorporate time-based analysis to identify patterns and trends in crime over different time intervals (daily, weekly, monthly). Implement sliders and date pickers for users to dynamically adjust the time frame and focus on specific periods.
3. Crime Type Classification: Categorize and classify different types of crimes for a more detailed analysis. Create visuals and charts that highlight the prevalence of specific crime categories in different areas.
4. User-Friendly Interface: Design an intuitive and user-friendly interface with interactive elements for easy exploration. Provide tooltips and instructional elements to guide users in utilizing the various features of the dashboard. By developing the Tactical Crime Analysis Dashboard in Power BI, this project aims to empower law enforcement agencies with a powerful tool to make informed decisions, allocate resources efficiently, and enhance overall public safety.

ZoomCharts visuals used

Drill Down Pie PRO Drill Down Pie PRO
Drill Down Map PRO Drill Down Map PRO

Mobile view allows you to interact with the report. To Download the template please switch to desktop view.

Try it in your Power BI!

New here? Fill up the form below and download!

Enjoy!

Success

Thank you for downloading the template!
We have sent a download link to your email.

For any questions, please contact us at ZoomCharts Assistance

Log in

Forgot password

Reset Password

Tactical Crime Analysis

Share

Unfortunately this report file could not be downloaded. Please try again later.

You can contact support using chat or via email [email protected]

logo
[email protected]
+44 204 577 3993
logo

Products

Drill Down Network PRO Drill Down Waterfall PRO Drill Down Graph PRO Drill Down Combo PRO Drill Down Combo Bar PRO Drill Down Donut PRO Drill Down Pie PRO Drill Down TimeSeries PRO Drill Down Timeline PRO Drill Down Map PRO Drill Down Scatter PRO All Visuals

Resources

Report Examples Webinars Blog ZoomCharts Academy Visuals Gallery Documentation Custom Visual Development Subscribe to News

Solutions

Custom Visual Development

Company

Pricing About Us Partners Leave feedback Join PowerGroup EU Funding

Help

ZoomCharts Assistance Contact Sales Contact Support FAQ

Drill Down Network PRO Drill Down Waterfall PRO Drill Down Graph PRO Drill Down Combo PRO Drill Down Combo Bar PRO Drill Down Donut PRO Drill Down Pie PRO Drill Down TimeSeries PRO Drill Down Timeline PRO Drill Down Map PRO Drill Down Scatter PRO All Visuals

Report Examples Webinars Blog ZoomCharts Academy Visuals Gallery Documentation Custom Visual Development Subscribe to News

Custom Visual Development

Pricing About Us Partners Leave feedback Join PowerGroup EU Funding

ZoomCharts Assistance Contact Sales Contact Support FAQ
+44 204 577 3993
[email protected]

Ready to get in touch?

Contact our experts with any question about Power BI and ZoomCharts for Free!

Contact us

© 2025, Data Visualization Software Lab

U.S. Patents No. 11,645,343; 11,921,804

Cookies Policy
Manage cookies
Privacy Policy
Global
EULA
Patent
warning

Error message

success

Success info: Done!

ZoomCharts AI Assistant

We noticed you're using an old OS version.

For the best experience, we recommend upgrading to ensure that all website features display correctly.

Cookie settings

We use necessary cookies for site functionality, as well as statistic, marketing, and preference cookies to enhance your experience. For more information and to manage your preferences, please visit our Cookie policy