logo
For Power BI
  • Products
    • Drill Down Donut Pro Drill Down Donut PRO
    • Drill Down Pie Pro Drill Down Pie PRO
    • Drill TimeSeries Pro Drill Down TimeSeries PRO
    • Drill Combo Pro Drill Down Combo PRO
    • Drill Map Pro Drill Down Map PRO
    • Drill Scatter Pro Drill Down Scatter PRO
    • Drill Down Network Pro Drill Down Network PRO
    • Drill Down Waterfall Pro Drill Down Waterfall PRO
    • Drill Down Graph Pro Drill Down Graph PRO
    • Drill Down Timeline Pro Drill Down Timeline PRO
    • Drill Down Combo Bar PRO Drill Down Combo Bar PRO

    Video tutorials

    Watch Now

    More than 90 videos on how to enhance Power BI with ZoomCharts

    Learn more
    All visuals
  • Resources

      Resources

    • Documentation
    • Report Examples
    • Blog
    • Webinars
    • Video Tutorials
    • Visuals Gallery

    Support

    • ZoomCharts Assistance
    • Contact Sales
    • Contact Support
    • FAQ

    Challenges

    Challenges

    Improve your report creation skills by participating in free challenges for report creators.

    Learn more
    Start trial
  • Services
    • Power BI Report Development
    • Custom Visual Development
  • Challenges
  • Pricing
Request a quote Start Free Book a Demo Sign in
Get it now
Go back

Contents

Go back

Share

Logo

Welcome to the FP20 Analytics November 2023 Challenge!

Nov 09 - Dec 12, 2023 | EST

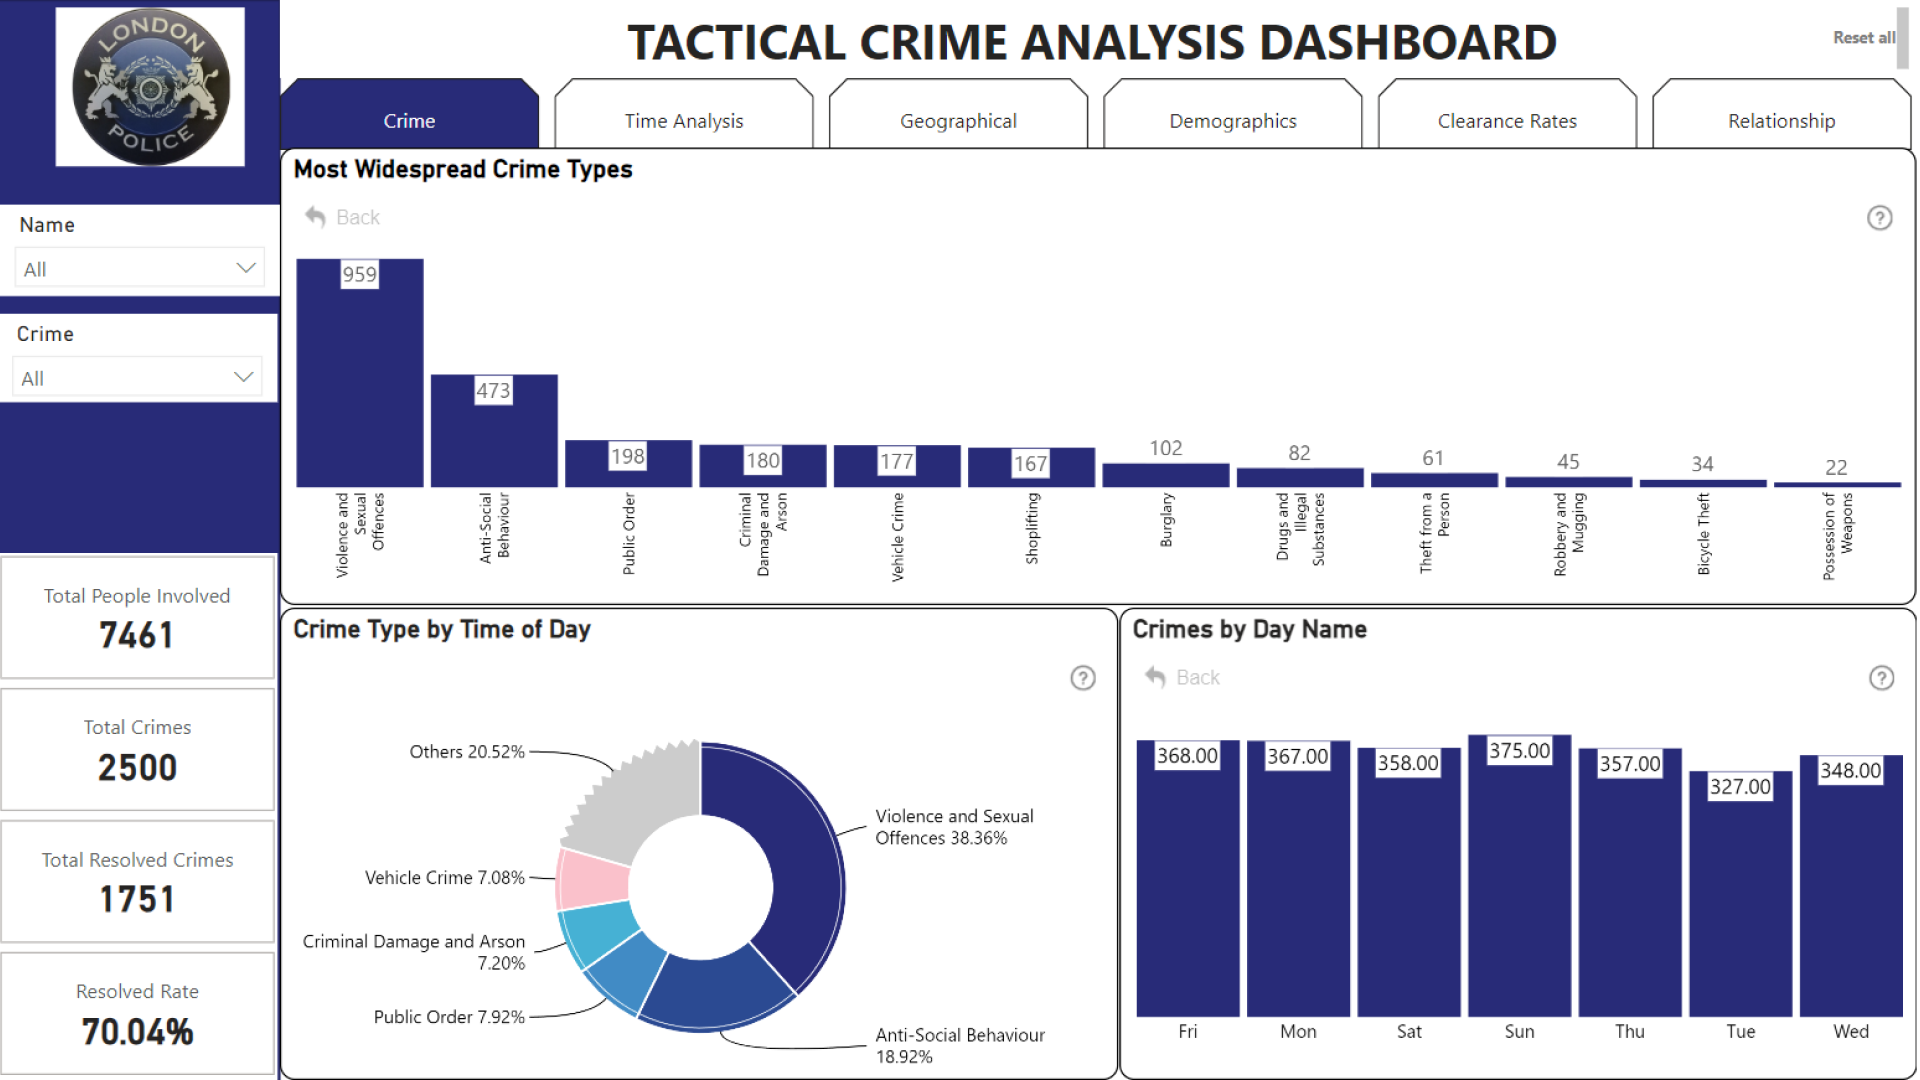
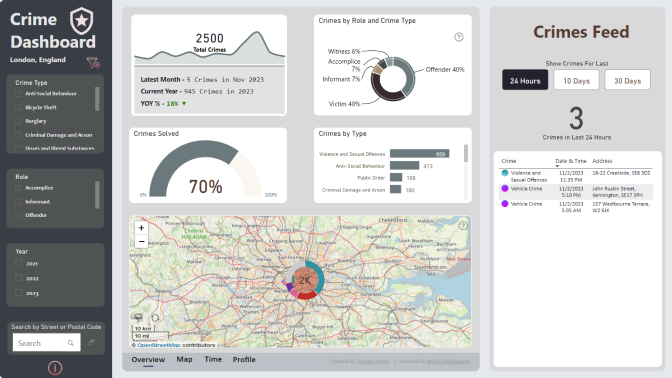
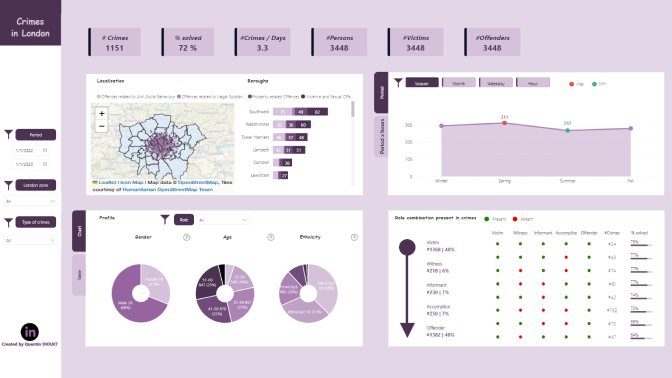
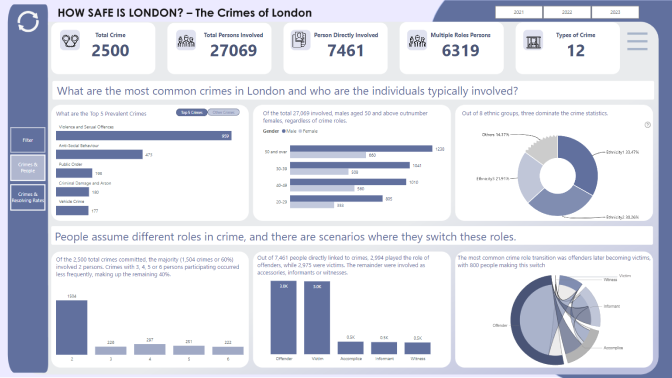
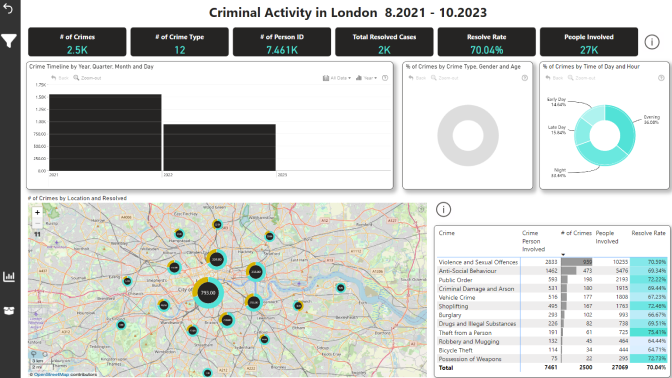
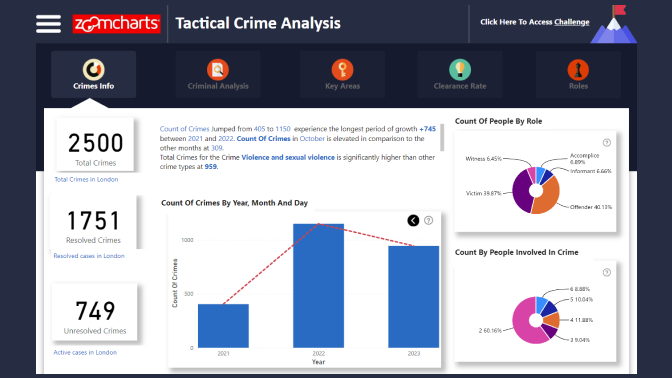
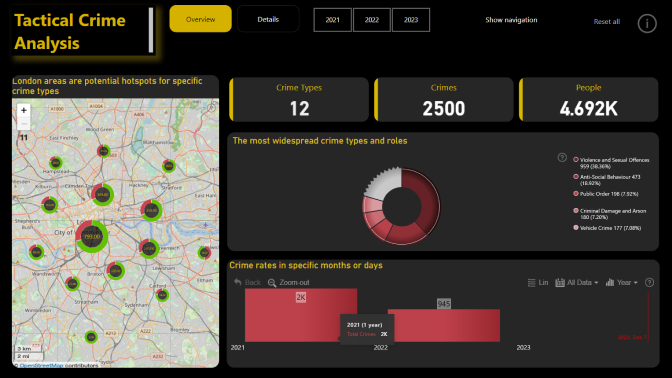
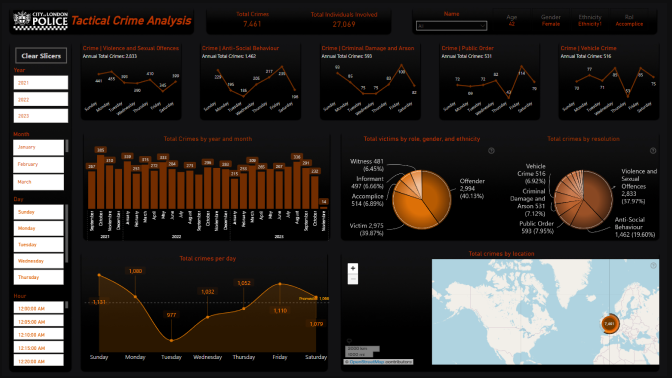
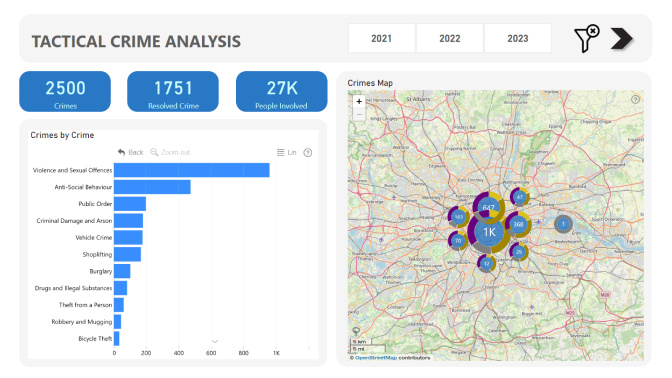
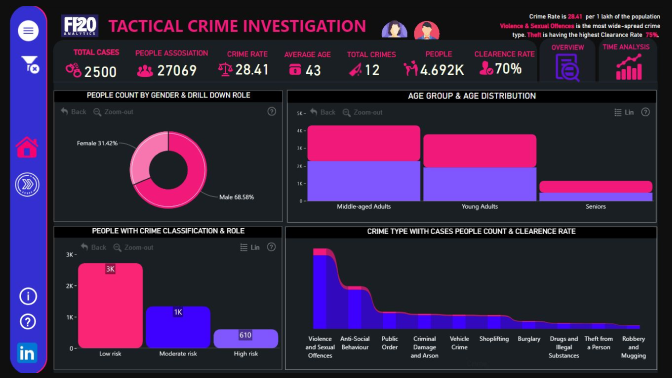
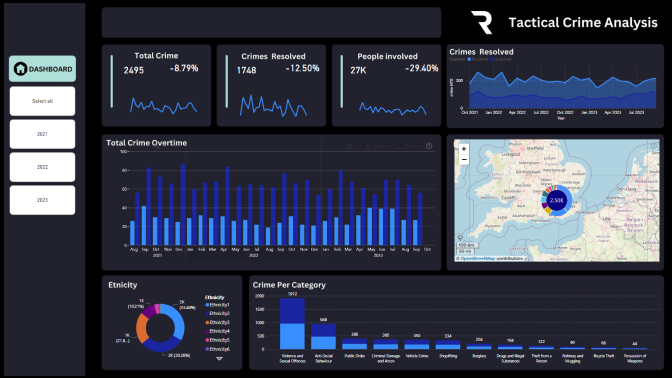
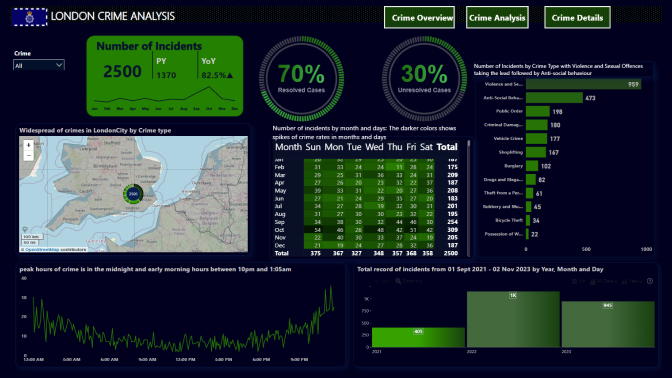
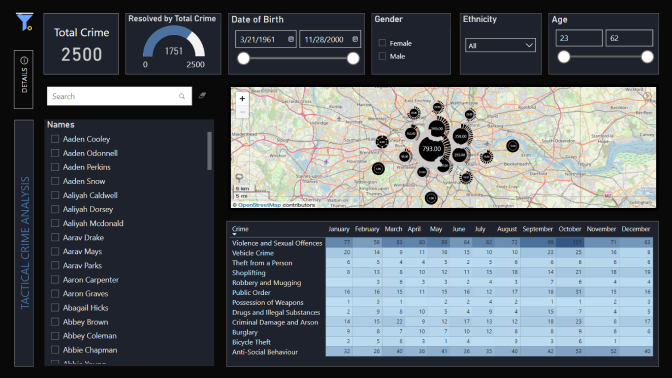
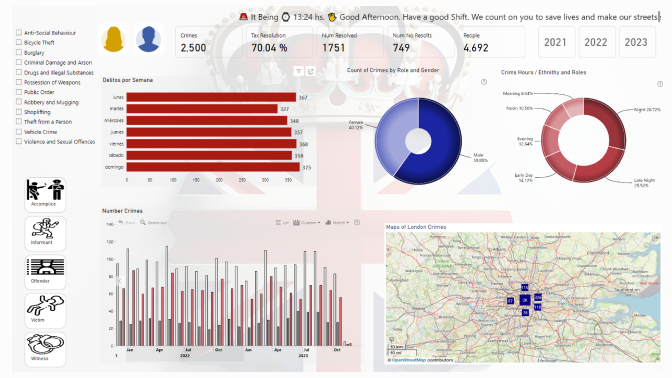
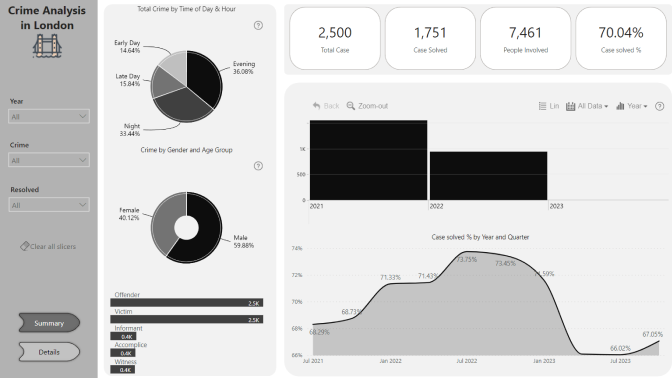
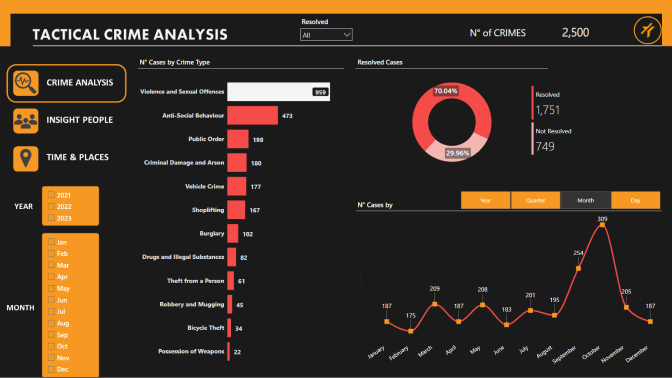
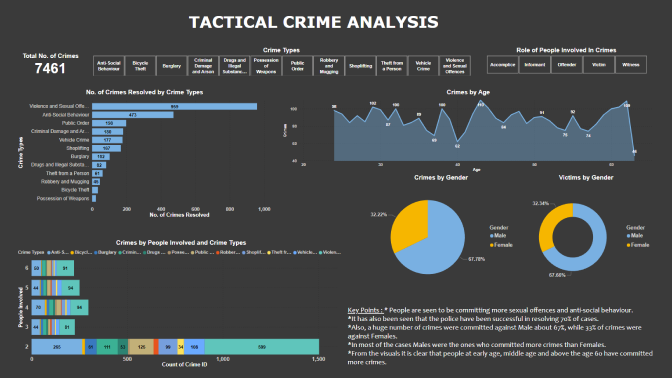
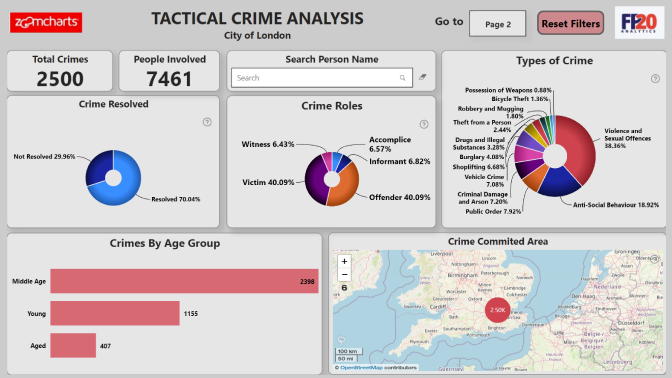
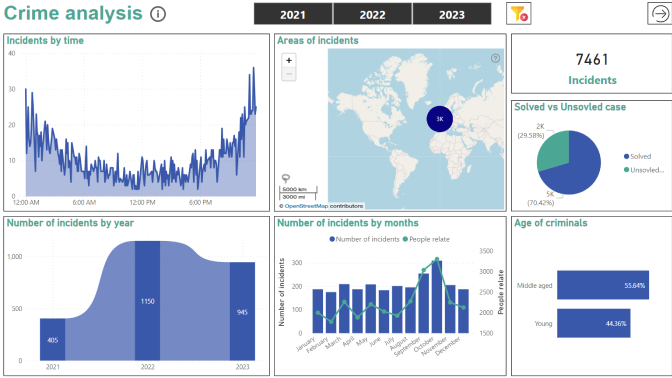
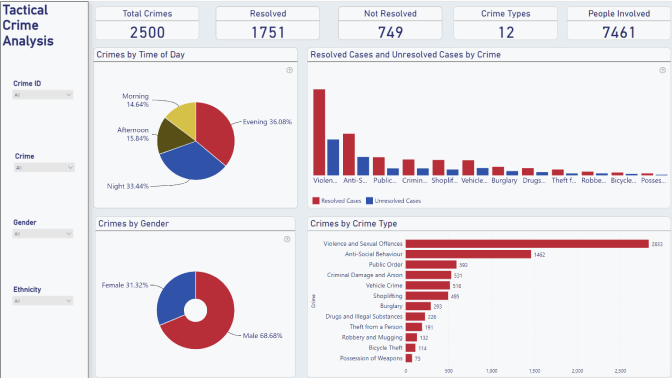
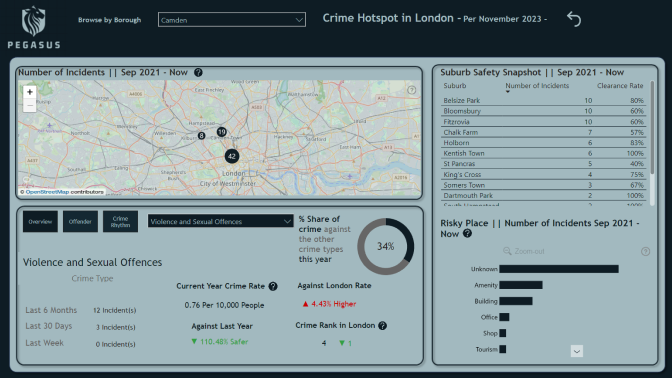
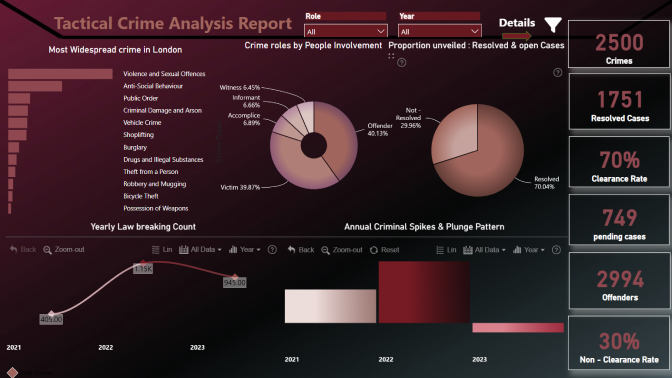
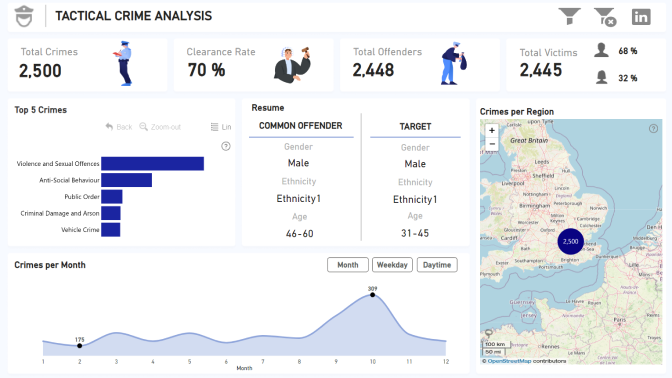
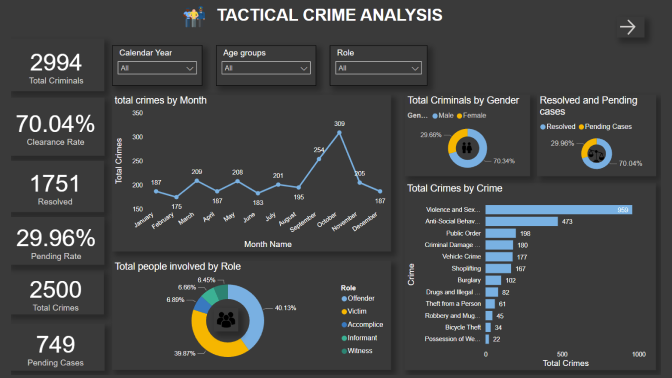
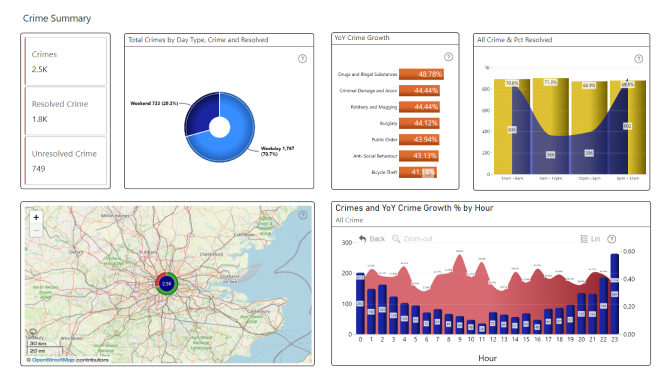
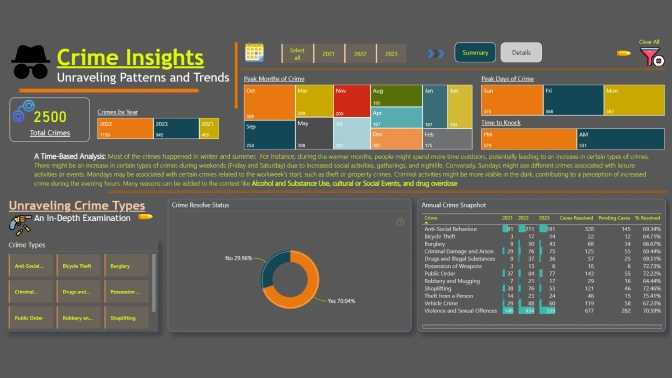
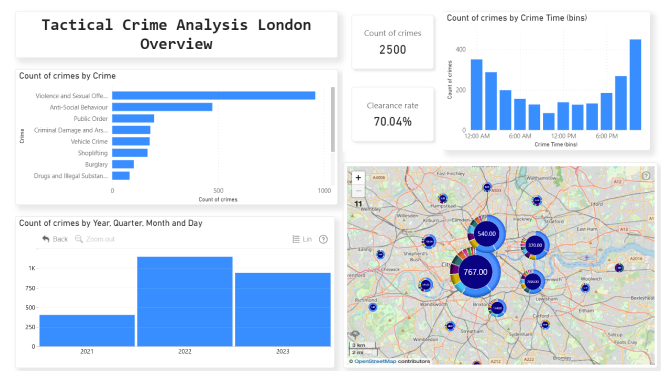
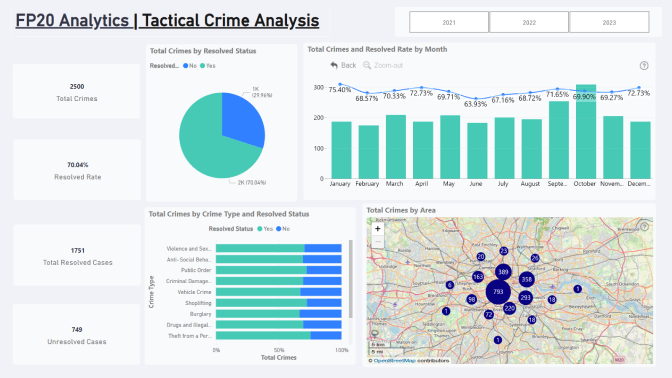
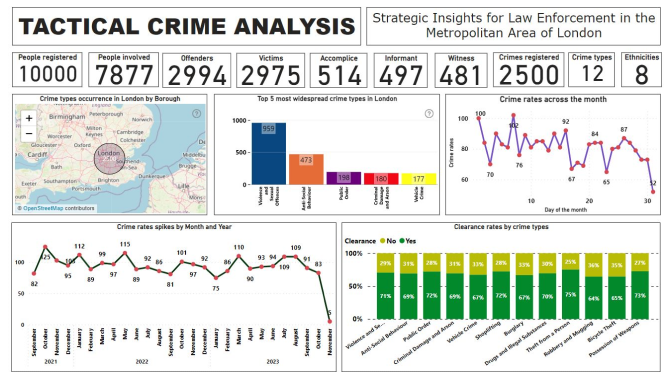
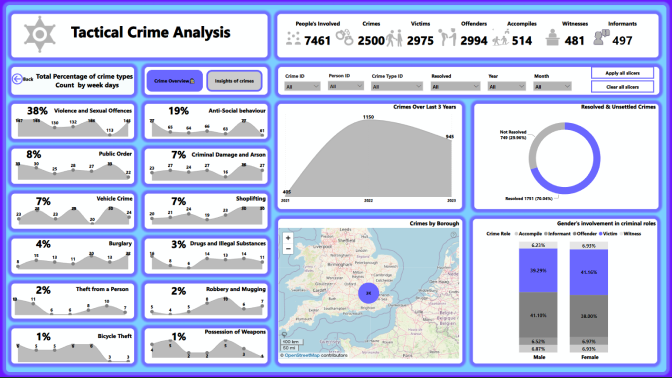
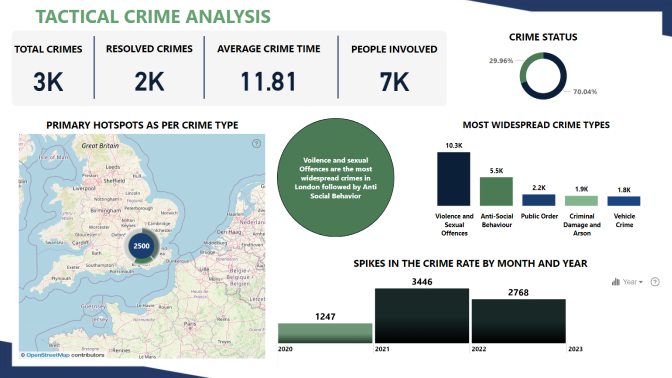
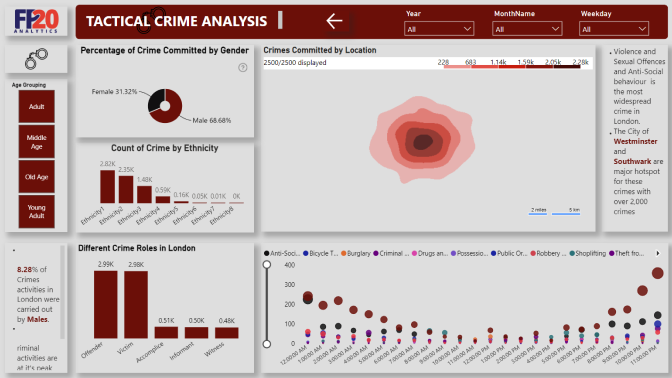
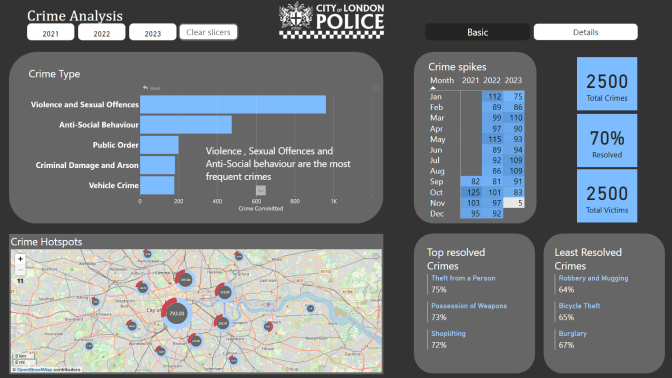
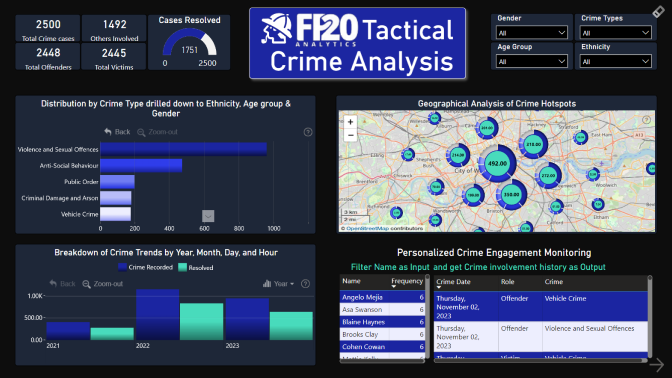
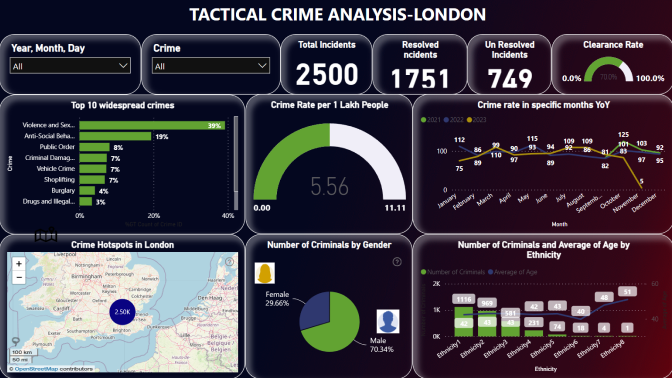
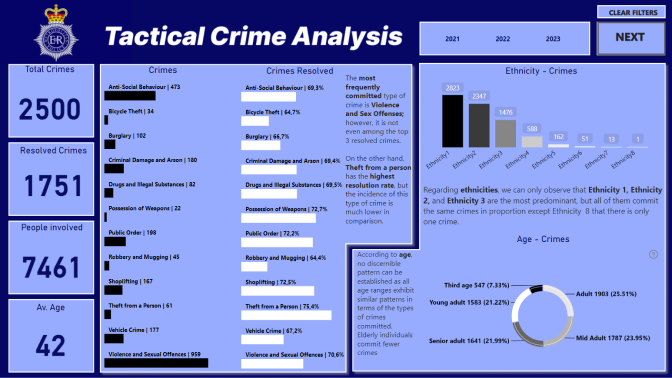
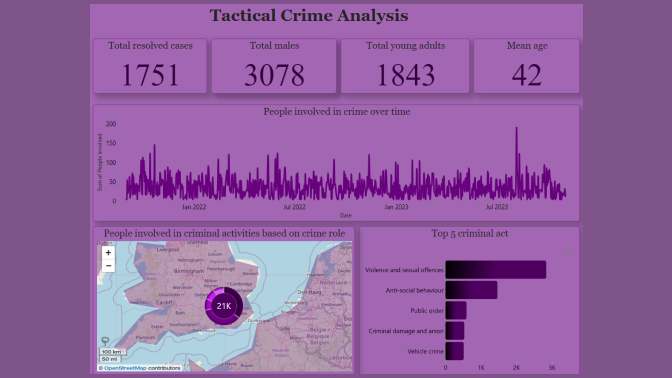
Embrace your inner detective and sharpen your analytical skills with Tactical Crime Analysis dataset

Timeline

Registration Open

Registration Open

09 November | 19:00

-

Submissions Open

Submissions Open

09 November | 19:00

-

Webinar | FP20 Analytics Challenge 11: Intro to Tactical Crime Analysis Dataset

Webinar | FP20 Analytics Challenge 11: Intro to Tactical Crime Analysis Dataset

14 November | 09:00

-

Webinar | FP20 Analytics Challenge 11: Solve the Case with ZoomCharts (Part 1)

Webinar | FP20 Analytics Challenge 11: Solve the Case with ZoomCharts (Part 1)

23 November | 08:00

-

Webinar | FP20 Analytics Challenge 11: Solve the Case with ZoomCharts (Part 2)

Webinar | FP20 Analytics Challenge 11: Solve the Case with ZoomCharts (Part 2)

29 November | 05:00

-

1:1 Mentoring Sessions

1:1 Mentoring Sessions

29 November | 05:00

09 November - 05 December

Entry Submission Deadline

Entry Submission Deadline

05 December | 19:00

09 November - 05 December

Webinar | FP20 Analytics Challenge 11: ZoomCharts Award Winner

Webinar | FP20 Analytics Challenge 11: ZoomCharts Award Winner

13 December | 11:00

09 November - 05 December

Winner Announced

Winner Announced

13 December | 11:00

09 November - 05 December

Dataset

Get the dataset

See past FP20 Analytics challenges

See past challenges

Share the challenge

Submitted Reports
About challenge
How to participate
Judging criteria
Timeline
Dataset
Past challenges

Winner of the challenge

Report Card

Tactical Crime Analysis-Toyin Taiwo

Author: Toyin Taiwo

231

View Report

All Submissions

Report Card

FP20 - Crime Dashboard

Author: Fawzan Ameer

86

View Report
Report Card

Descifrando el Panorama del Crimen en Londres

Author: Norman Reynaldo Sabillon Castro

181

View Report
Report Card

Tactical Crime Analysis in London

Author: Quentin Diouet

122

View Report
Report Card

Crime Analysis

Author: Okeh Dono Efasa

94

View Report
Report Card

Crime Analysis

Author: Hajnalka Siflis

36

View Report
Report Card

Tactical Crime Analysis

Author: Tirumalaraju Vineetha

28

View Report
Report Card

FP20 Tactical Analysis

Author: Eszter Kovacs

29

View Report
Report Card

Tactical Crime Analytics

Author: Nicolás San Marco

12

View Report
Report Card

FP20 Analytics Challenge 11.

Author: Mail Halász

8

View Report
Report Card

FP20 Analytics Challenge 11

Author: Prakash Singh

16

View Report
Report Card

FP20 Analytics November 2023 Challenge

Author: Floris Moest

18

View Report
Report Card

Crime Data Analysis

Author: Nnamdi Nwankwo

1

View Report
Report Card

FP20 Tactical Crime Analysis Challenge 11

Author: King Joseph

2

View Report
Report Card

Montse Collantes

Author: Montse Collantes

1

View Report
Report Card

Crime Analysis in London

Author: Ibrahimhapania Mondal

0

View Report
Report Card

Tactical Crimes Analysis

Author: Giancarlo Ramos de Rosas

1

View Report
Report Card

Tactical Crime Analysis

Author: Sohan Gurav

0

View Report
Report Card

Tactical Crime Analysis

Author: Akhilesh Raut

11

View Report
Report Card

Tactical crime analysis

Author: Le Hong Quang

3

View Report
Report Card

Tactical Crime Analysis

Author: Ahmad Ammar

2

View Report
Report Card

Tactical Crime Analysis

Author: Andika Dwi Nugraha

1

View Report
Report Card

Latest crime

Author: Shivani Larokar

13

View Report
Report Card

Tactical Crime Analysis

Author: Tomas Baleriani

8

View Report
Report Card

Tactical Crime Analysis

Author: Ananya Das

1

View Report
Report Card

Crime Summary

Author: Steven Stanford

14

View Report
Report Card

FP20 Data Challenge : Crime Insights

Author: Bimal Subhasis

3

View Report
Report Card

Tactical Crime Analysis London

Author: Szabina Nyírő

1

View Report
Report Card

Tactical Crime Analysis_Rakesh Meshua

Author: Rakeshmeshua Meshua

0

View Report
Report Card

Challenge11TacticalLondonCrimes

Author: Anibal Ceballos

1

View Report
Report Card

Tactical Crime Analysis

Author: Sezhiyan Selvaraj

0

View Report
Report Card

Tactical Crime Analysis - FP20 Analytics Challenge

Author: Kathareaditi Kathare

0

View Report
Report Card

FP_20_Challenge

Author: Praise (Temi) Olawoyin

8

View Report
Report Card

Navigating Crime Trends in London

Author: Zahraa Shabana

1

View Report
Report Card

Tactical Crime Analysis

Author: Maja Spanic

6

View Report
Report Card

Crimes Analysis in London

Author: Balqees Almashjari

1

View Report
Report Card

FP20-C11 -

Author: Rigoberto Garcia

1

View Report
Report Card

crime-Analysis-Sahar Jamal

Author: Sahar Jamal

0

View Report
Report Card

Tactical Crime Analysis of London

Author: Subham Pramanick

1

View Report
Report Card

Tactical Crime Analysis

Author: Goutham Rajasekaran

2

View Report
Report Card

Crime Analysis - FP20 nov

Author: Francisco Manuel Ávila Galván

0

View Report
Report Card

Overview of tactical crime analysis

Author: Faheedah Bukola Bello

0

View Report
Report Card

Tactical Crime Analysis Report

Author: Prince Matthew

3

View Report
Report Card

Crime in London

Author: Ashutosh Kumar

1

View Report
Report Card

fp 20 crime data analysis

Author: Tushar Joshi

2

View Report

About FP20 Analytics ZoomCharts Challenge

The ZoomCharts challenge is hosted in partnership with FP20 Analytics – a group that unites passionate and inspiring data enthusiasts, and helps new data analysts improve their skills and build a competitive portfolio. Join in and sharpen your skills together with this open and friendly data community. Read more about the challenges on the FP20 Analytics website. Join the community on LinkedIn.

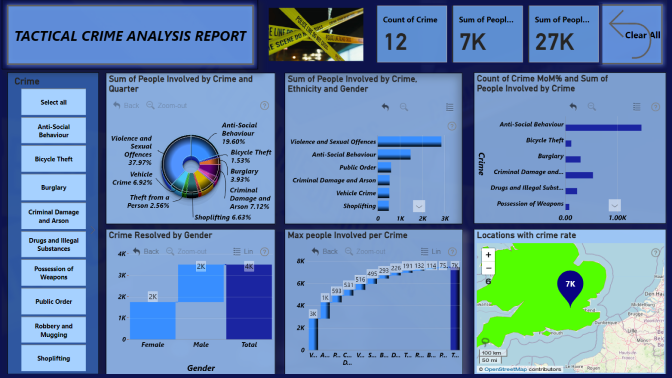
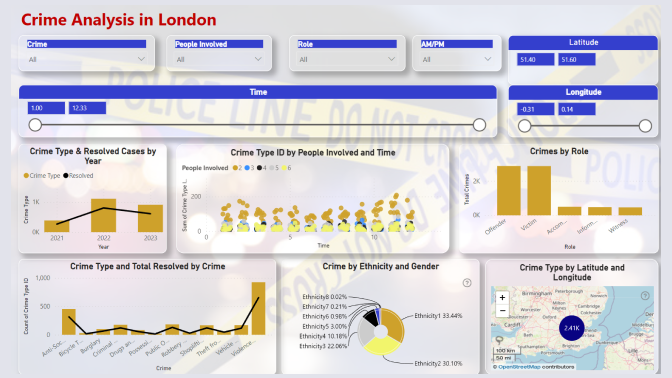
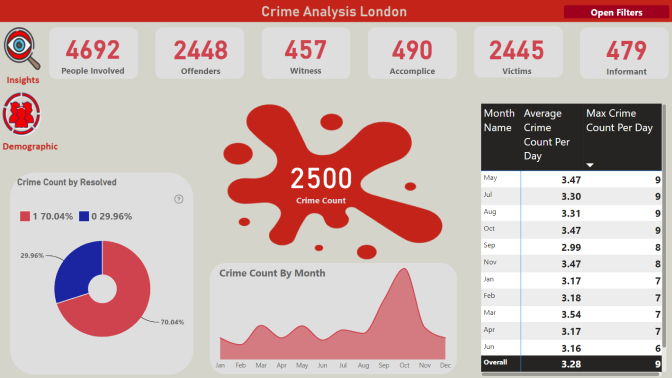
Participate in FP20 Analytics ZoomCharts Challenge to enrich your skill in creating excellent Power BI reports that help business users explore data quickly and intuitively. 

  1. Free License: All participants receive a free ZoomCharts Developer License that gives access to the full Drill Down PRO visuals library. License will remain active for 1 year after the challenge.
  2. Learn from Experienced Professionals: As part of the challenge, we host live workshops on report building and visualizing the challenge’s dataset in Power BI. Challenge participants can also book an individual consultation with an experienced Power BI mentor to ask questions and get personalized tips.
  3. Tailored Feedback: Every challenge submission will receive personalized feedback, giving participants the chance to hone their skills and improve their reports.

Prizes

The best report’s creator will receive a $300 Amazon gift card from ZoomCharts. The winner will be announced in a special live webinar session on December 13, where we will review the top entries from the November challenge. 

Webinar recordings

Recording thumbnail

FP20 Analytics Challenge 11: Intro to Tactical Crime Analysis Dataset

Discover the real-life use case behind the November dataset, and learn about the true impact of crime data analysis

Watch the recording
Recording thumbnail

FP20 Analytics Challenge 11: Solve the Case with ZoomCharts (Part 1)

Join the dynamic expert duo for a session of report building workshop and Q&A based on the November challenge dataset (Part 1 of 2)

Watch the recording
Recording thumbnail

FP20 Analytics Challenge 11: Solve the Case with ZoomCharts (Part 2)

Workshop and expert discussion for the FP20 Analytics November challenge (Part 2 of 2)

Watch the recording
Recording thumbnail

FP20 Analytics Challenge 11: ZoomCharts Award Winner

Watch the expert team analyze Top 5 reports and announce the winner of ZoomCharts prize

Watch the recording

How to participate?

  1. Register and receive a Drill Down Visuals Developer License for Power BI.
  2. Download the challenge dataset
  3. Use the dataset to build a Power BI report including ZoomCharts Drill Down Visuals
  4. Submit your entry to be verified.
    (If your submission doesn’t match the challenge criteria, you will be notified by email, so make sure you will have time for revision and resubmission if needed. Feel free to resubmit entry as many times as necessary before the deadline)
  5. Upload your publish to web link on NovyPro. 

    Note: If you opt to post your report on NovyPro, for instructions on how to do this, refer to the provided video link. 

    NovyPro: https://www.novypro.com/
    Instruction Video: https://www.youtube.com/watch?v=jkcAYgFGWUY 
  6. Post your submission on LinkedIn:
    • Upload the report as a PDF document on your LinkedIn feed.
    • Use the caption, "I am participating in FP20 Analytics Challenge 11”, along with screenshots from your report.
    • Include a brief summary about your report's key insights and publish to web or NovyPro link.
    • Use the hashtags #FP20Analytics, #FP20AnalyticsTacticalCrime Analysis, #builtwithzoomcharts, tag @Federico Pastor and @Zoomcharts.
    • Additionally, post your report in the FP20 Analytics LinkedIn Community Group.
  7. Follow ZoomCharts on LinkedIn

Technical requirements

  • Build your report using only Power BI 
  • Reports are restricted to a maximum of 2 pages 
  • Canvas size is 16:9 (Default Power BI size) or Full HD size = w:1920 - h:1080 
  • Report has to include at least 2 ZoomCharts Drill Down Visuals   

Judging criteria

Business users use reports to make data-driven decisions. That’s why reports are called effective if they enable users to drill down and filter data quickly and intuitively to find answers to any question they might have and analyse data in all possible directions and dimensions. We will evaluate:

  1. How easy is it to understand the data? (max 10 points)
    • Is too much text used for explanation?
    • Are the indicative colors in charts instinctually understandable?
    • Does it tell a story?
  2. How easy-to-use is the report? (max 14 points)
    • Cross-chart filtering implementation across the report. Can other visuals provide relevant data as the user explores the report?
    • Response time
    • Drill Down: multi-layer data exploration. Can the user drill down and gain additional insights within the report?
    • Use of tutorial overlays and other elements to assist new users. Can a new user start using this report straight away with just the guidance provided within the report itself?
  3. How good is the report design and is it suitable for its purpose? (max 10 points)
    • Visual design: is the overall look consistent, no empty spaces, no overcrowding?
    • Interface design: are there unnecessary visualisations/buttons/complexity in use?
    • UX design: is the produced report usable?
    • Report design: is the main challenge answered?
    • Technical: are all the fonts used the same, are the sizes readable?

You are encouraged to use various techniques at your disposal, such as tooltips, drill-throughs, drill-downs, cross-chart filtering and page navigation features, to enhance your analysis.

Timeline

Registration Open

Registration Open

09 November | 19:00

-

Submissions Open

Submissions Open

09 November | 19:00

-

Webinar | FP20 Analytics Challenge 11: Intro to Tactical Crime Analysis Dataset

Webinar | FP20 Analytics Challenge 11: Intro to Tactical Crime Analysis Dataset

14 November | 09:00

-

Webinar | FP20 Analytics Challenge 11: Solve the Case with ZoomCharts (Part 1)

Webinar | FP20 Analytics Challenge 11: Solve the Case with ZoomCharts (Part 1)

23 November | 08:00

-

Webinar | FP20 Analytics Challenge 11: Solve the Case with ZoomCharts (Part 2)

Webinar | FP20 Analytics Challenge 11: Solve the Case with ZoomCharts (Part 2)

29 November | 05:00

-

1:1 Mentoring Sessions

1:1 Mentoring Sessions

29 November | 05:00

09 November - 05 December

Entry Submission Deadline

Entry Submission Deadline

05 December | 19:00

09 November - 05 December

Webinar | FP20 Analytics Challenge 11: ZoomCharts Award Winner

Webinar | FP20 Analytics Challenge 11: ZoomCharts Award Winner

13 December | 11:00

09 November - 05 December

Winner Announced

Winner Announced

13 December | 11:00

09 November - 05 December

Dataset

Get the dataset

See past FP20 Analytics November 2023 challenges

See past challenges

Your Drill Down Visuals Developers License

Use the email and password provided below to log in Power BI Desktop and access an account with a license to use all ZoomCharts Drill Down Visuals.

Upon logging in, you will need to change your password and enable two-factor authentication. If you encounter any problems, feel free to reach out to us via chat.

*This Developer License can be used to create a report for this ZoomCharts Mini Challenge or for your personal training purposes. Commercial use of this license is prohibited.

Upload failed
Attach file
File requirements: 16MB

Any questions? Feel free to use chat!

Are you sure you want to delete the report?

Activate your Drill Down visuals Developer License!

You can use these credential to access ZoomCharts visuals and create your report for this ZoomCharts Mini Challenge, or for your personal training purposes.


logo
[email protected]
+44 204 577 3993
logo

Products

Drill Down Network PRO Drill Down Waterfall PRO Drill Down Graph PRO Drill Down Combo PRO Drill Down Combo Bar PRO Drill Down Donut PRO Drill Down Pie PRO Drill Down TimeSeries PRO Drill Down Timeline PRO Drill Down Map PRO Drill Down Scatter PRO All Visuals

Resources

Report Examples Webinars Blog ZoomCharts Academy Visuals Gallery Documentation Custom Visual Development Subscribe to News

Solutions

Custom Visual Development

Company

Pricing About Us Partners Leave feedback Join PowerGroup EU Funding

Help

ZoomCharts Assistance Contact Sales Contact Support FAQ

Drill Down Network PRO Drill Down Waterfall PRO Drill Down Graph PRO Drill Down Combo PRO Drill Down Combo Bar PRO Drill Down Donut PRO Drill Down Pie PRO Drill Down TimeSeries PRO Drill Down Timeline PRO Drill Down Map PRO Drill Down Scatter PRO All Visuals

Report Examples Webinars Blog ZoomCharts Academy Visuals Gallery Documentation Custom Visual Development Subscribe to News

Custom Visual Development

Pricing About Us Partners Leave feedback Join PowerGroup EU Funding

ZoomCharts Assistance Contact Sales Contact Support FAQ
+44 204 577 3993
[email protected]

Ready to get in touch?

Contact our experts with any question about Power BI and ZoomCharts for Free!

Contact us

© 2025, Data Visualization Software Lab

U.S. Patents No. 11,645,343; 11,921,804

Cookies Policy
Manage cookies
Privacy Policy
Global
EULA
Patent
warning

Error message

success

Success info: Done!

ZoomCharts AI Assistant

We noticed you're using an old OS version.

For the best experience, we recommend upgrading to ensure that all website features display correctly.

Cookie settings

We use necessary cookies for site functionality, as well as statistic, marketing, and preference cookies to enhance your experience. For more information and to manage your preferences, please visit our Cookie policy