Feel free to leave your vote:
2
Share template with others
Summary
This Power BI report uses the Pharmacy Sales and Profitability dataset. The report features ZoomCharts Drill Down PRO custom visuals for Power BI. It was submitted to the Onyx Data DataDNA ZoomCharts Mini Challenge in January - February 2026.
Author’s Description:
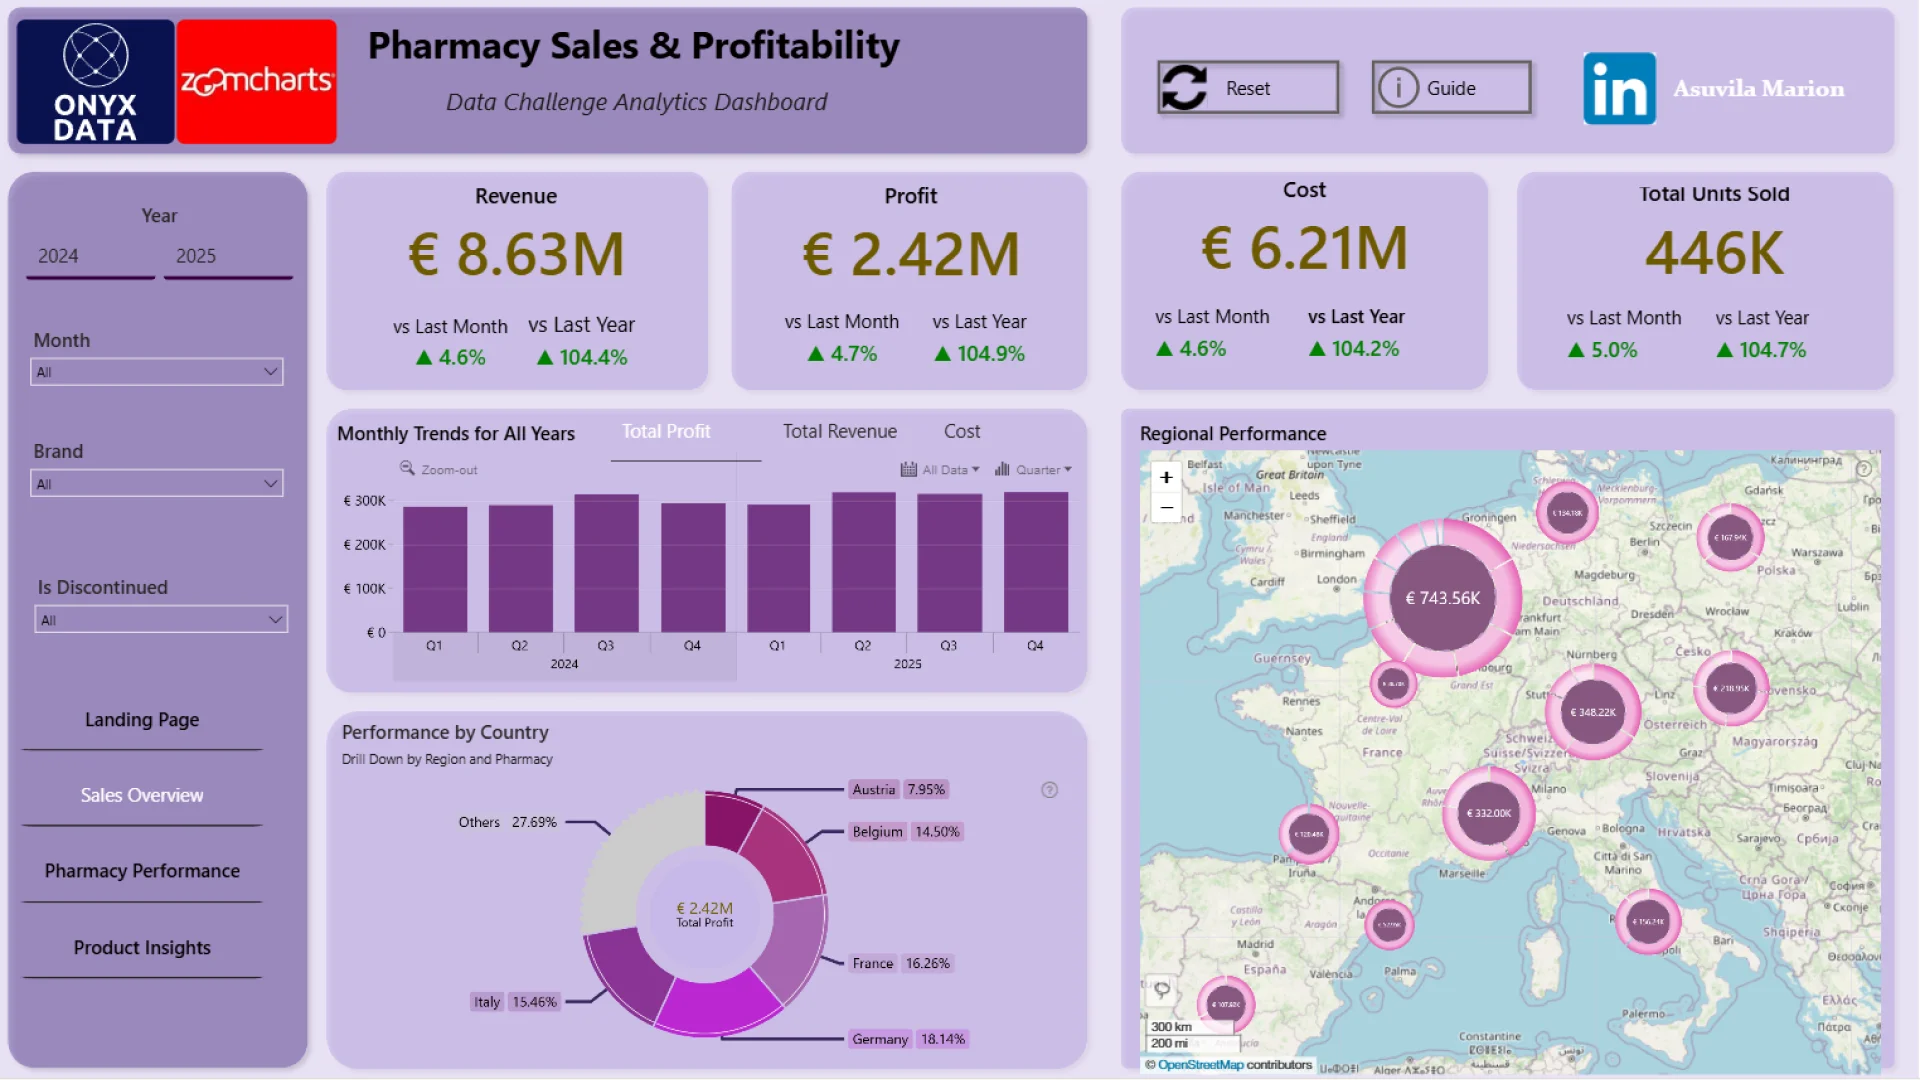
This report analyzes sales and profitability performance for a European pharmacy chain distributor operating across multiple European countries. It highlights how revenue, profit, costs, and sales volume vary over time across countries, regions, and individual pharmacies.
Beyond overall performance, the report explores product category and brand contributions, the impact of promotions on sales and margins, and geographic patterns that identify high- and low-performing areas and pharmacies.
By combining these insights, the analysis enables stakeholders to make informed, data-driven decisions to optimize business performance and profitability.
ZoomCharts visuals used
Mobile view allows you to interact with the report. To Download the template please switch to desktop view.