logo
For Power BI
  • Products
    • Drill Down Donut Pro Drill Down Donut PRO
    • Drill Down Pie Pro Drill Down Pie PRO
    • Drill TimeSeries Pro Drill Down TimeSeries PRO
    • Drill Combo Pro Drill Down Combo PRO
    • Drill Map Pro Drill Down Map PRO
    • Drill Scatter Pro Drill Down Scatter PRO
    • Drill Down Network Pro Drill Down Network PRO
    • Drill Down Waterfall Pro Drill Down Waterfall PRO
    • Drill Down Graph Pro Drill Down Graph PRO
    • Drill Down Timeline Pro Drill Down Timeline PRO
    • Drill Down Combo Bar PRO Drill Down Combo Bar PRO

    Video tutorials

    Watch Now

    More than 90 videos on how to enhance Power BI with ZoomCharts

    Learn more
    All visuals
  • Resources

      Resources

    • Documentation
    • Report Examples
    • Blog
    • Webinars
    • Video Tutorials
    • Visuals Gallery

    Support

    • ZoomCharts Assistance
    • Contact Sales
    • Contact Support
    • FAQ

    Challenges

    Challenges

    Improve your report creation skills by participating in free challenges for report creators.

    Learn more
    Start trial
  • Services
    • Power BI Report Development
    • Custom Visual Development
  • Challenges
  • Pricing
Request a quote Start Free Book a Demo Sign in
Get it now
Go back

Contents

Go back

Challenge11TacticalLondonCrimes

Report Author: Anibal Ceballos

Report
Report Interact

Feel free to leave your vote:

1

Share template with others

Summary

Report submitted for FP20 Analytics ZoomCharts Challenge, November 2023. The report was built with Tactical Crime Analysis dataset and includes ZoomCharts custom Drill Down PRO visuals for Power BI. 

Author's description:
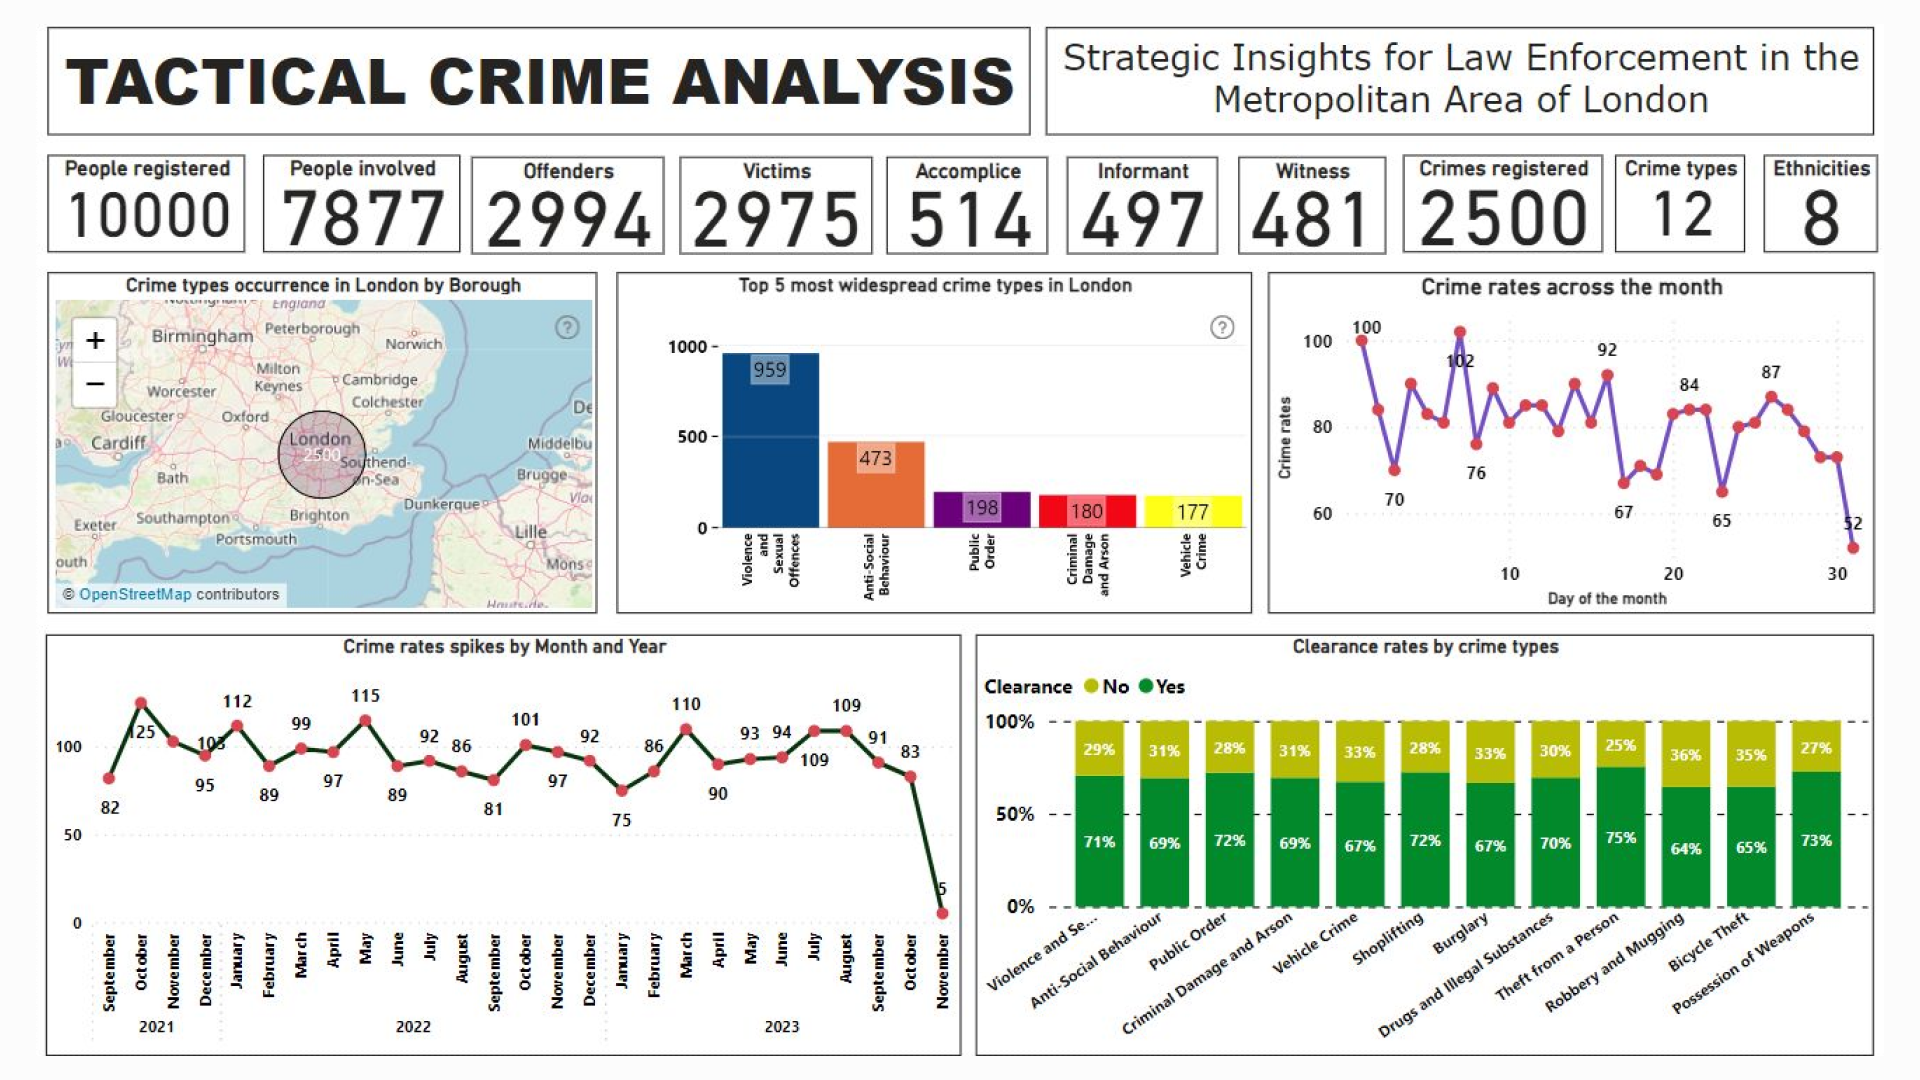
The main insights are outlined below:
· There are 10000 people registered in the database, whose 7877 were involved in any of 2500 crimes registered in the 3 years analyzed.
· The top 5 crime types registered in the city of London were Violence and Sexual Offenses leading the top with 959 cases (38%), followed by far for Anti-Social Behavior with 473 (18.92%) reported cases. Finally, Public Order with 198 cases (7.92%), Criminal Damage with 180 cases (7.20%), and Vehicle Crime with 177 cases (7.08%) make up the last three places in the countdown.
· Along the three years analyzed, it can be observed there is a cycle of about 4 months in between where crimes recorded an increase in crime rates and the same behavior occurs regarding the months with the lowest crimes registered which says the trend of crime occurrences are cyclical and might be related to specific seasons along the year where the Police department should pay more attention to lower those figures.
· As for clearance rates, most of the crime types observe a clearance rate over 60% where “Possession of Weapons” is the one with the highest proportion whereas “Robbery and Mugging” has the lowest clearance. For the most part, the clearance rate of crimes is around 70%.
· Crime roles listed in the study show a similar proportion in terms of gender involvement where male offenders account for 41% and their female counterparts around 38%. For victims, the proportions yielded the opposite compared to offenders; regarding the other roles the proportions for both genders were the same, 7% for both Accomplices and Informants. Witness showed 6% for males and 7% for females.
· The biggest challenges according to this survey are to address the crimes with the highest rates by targeting the boroughs with the greatest occurrences, research the main reasons for these facts, and increase the clearance rates by training the police force on how criminality should be approached. Make bigger recruiting campaigns to attract new potential members to the Police to increase the personnel within the city and spread them on the places considered “dangerous” especially on certain days of the week.
· Also, conduct research regarding those who identified as Ethnicity 1, Ethnicity 2, or Ethnicity 3 as they were involved in most of the crimes registered in the study. The main topics should be a deep study of the backgrounds, and chances of improving their life quality in terms of job opportunities to avoid falling into criminality. 

ZoomCharts visuals used

Drill Down Combo PRO Drill Down Combo PRO
Drill Down Map PRO Drill Down Map PRO

Mobile view allows you to interact with the report. To Download the template please switch to desktop view.

Try it in your Power BI!

New here? Fill up the form below and download!

Enjoy!

Success

Thank you for downloading the template!
We have sent a download link to your email.

For any questions, please contact us at ZoomCharts Assistance

Log in

Forgot password

Reset Password

Challenge11TacticalLondonCrimes

Share

Unfortunately this report file could not be downloaded. Please try again later.

You can contact support using chat or via email [email protected]

logo
[email protected]
+44 204 577 3993
logo

Products

Drill Down Network PRO Drill Down Waterfall PRO Drill Down Graph PRO Drill Down Combo PRO Drill Down Combo Bar PRO Drill Down Donut PRO Drill Down Pie PRO Drill Down TimeSeries PRO Drill Down Timeline PRO Drill Down Map PRO Drill Down Scatter PRO All Visuals

Resources

Report Examples Webinars Blog ZoomCharts Academy Visuals Gallery Documentation Custom Visual Development Subscribe to News

Solutions

Custom Visual Development

Company

Pricing About Us Partners Leave feedback Join PowerGroup EU Funding

Help

ZoomCharts Assistance Contact Sales Contact Support FAQ

Drill Down Network PRO Drill Down Waterfall PRO Drill Down Graph PRO Drill Down Combo PRO Drill Down Combo Bar PRO Drill Down Donut PRO Drill Down Pie PRO Drill Down TimeSeries PRO Drill Down Timeline PRO Drill Down Map PRO Drill Down Scatter PRO All Visuals

Report Examples Webinars Blog ZoomCharts Academy Visuals Gallery Documentation Custom Visual Development Subscribe to News

Custom Visual Development

Pricing About Us Partners Leave feedback Join PowerGroup EU Funding

ZoomCharts Assistance Contact Sales Contact Support FAQ
+44 204 577 3993
[email protected]

Ready to get in touch?

Contact our experts with any question about Power BI and ZoomCharts for Free!

Contact us

© 2025, Data Visualization Software Lab

U.S. Patents No. 11,645,343; 11,921,804

Cookies Policy
Manage cookies
Privacy Policy
Global
EULA
Patent
warning

Error message

success

Success info: Done!

ZoomCharts AI Assistant

We noticed you're using an old OS version.

For the best experience, we recommend upgrading to ensure that all website features display correctly.

Cookie settings

We use necessary cookies for site functionality, as well as statistic, marketing, and preference cookies to enhance your experience. For more information and to manage your preferences, please visit our Cookie policy