Feel free to leave your vote:
36
Share template with others
Summary
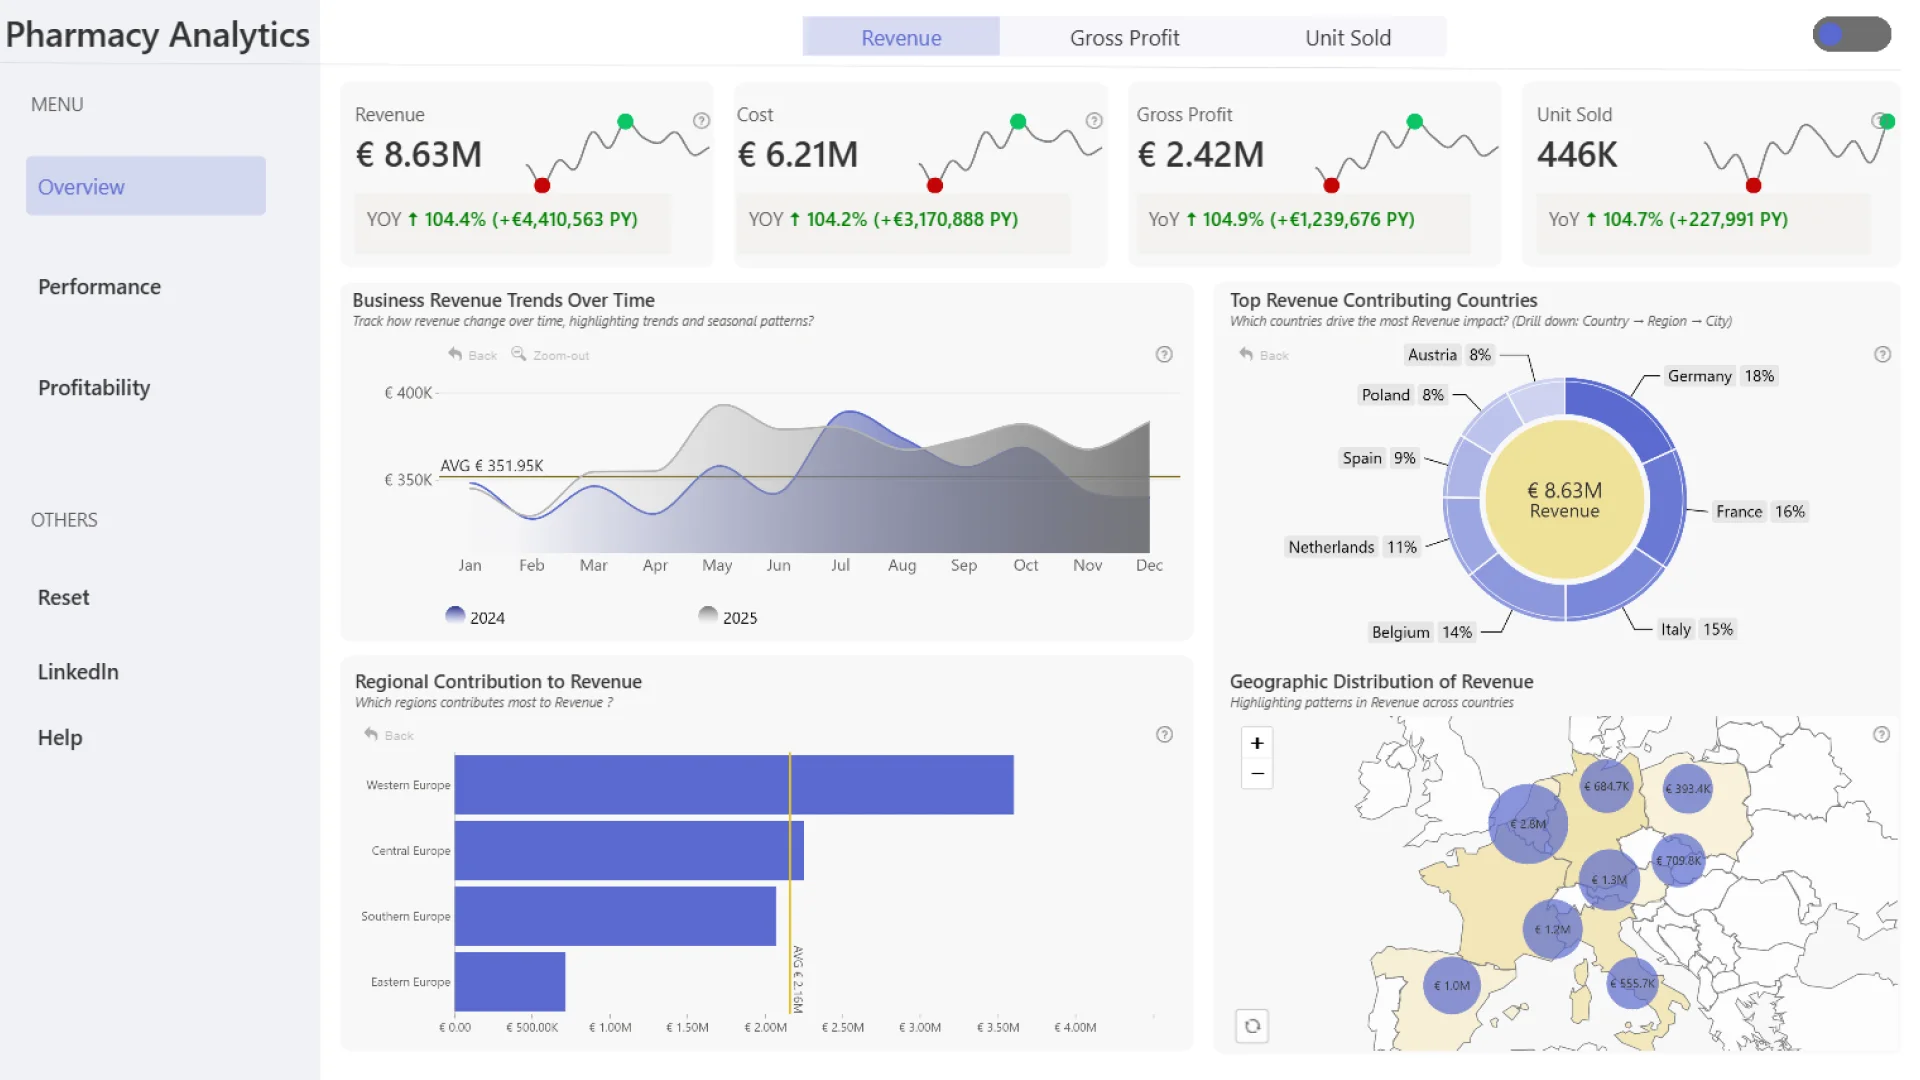
This Power BI report uses the Pharmacy Sales and Profitability dataset. The report features ZoomCharts Drill Down PRO custom visuals for Power BI. It was submitted to the Onyx Data DataDNA ZoomCharts Mini Challenge in January - February 2026.
Author’s Description:
This dataset is crucial for understanding how sales performance, profitability, and product success vary across different regions, pharmacy types, and product categories in the European market. By analyzing these metrics, the dataset provides valuable insights into business performance, helping stakeholders identify growth opportunities and areas for operational improvement.
ZoomCharts visuals used
Mobile view allows you to interact with the report. To Download the template please switch to desktop view.