Feel free to leave your vote:
0
Share template with others
Summary
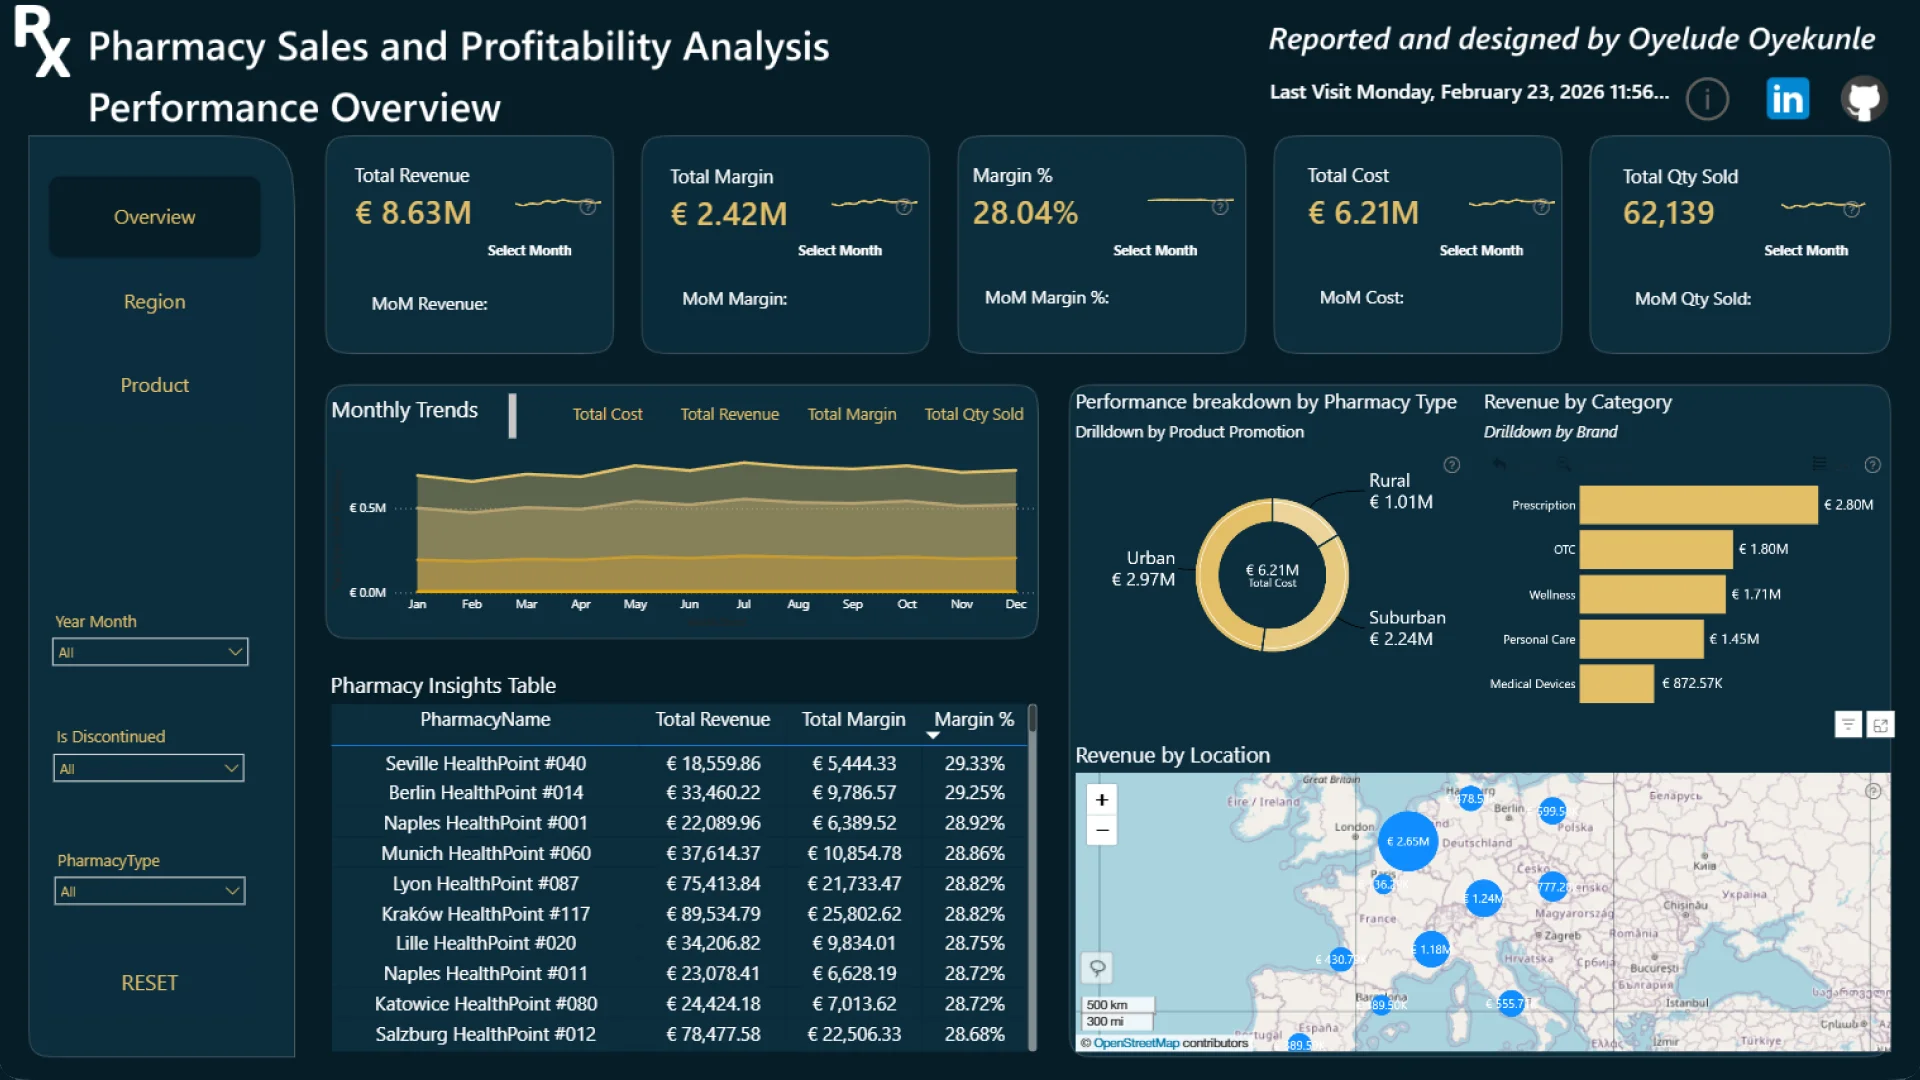
This Power BI report uses the Pharmacy Sales and Profitability dataset. The report features ZoomCharts Drill Down PRO custom visuals for Power BI. It was submitted to the Onyx Data DataDNA ZoomCharts Mini Challenge in January - February 2026.
Author’s Description:
This project focused on understanding revenue drivers, cost structures, and profitability patterns across pharmacies, regions, product categories, and brands using Power BI, DAX, and Power Query.
ZoomCharts visuals used
Mobile view allows you to interact with the report. To Download the template please switch to desktop view.