Feel free to leave your vote:
0
Share template with others
Summary
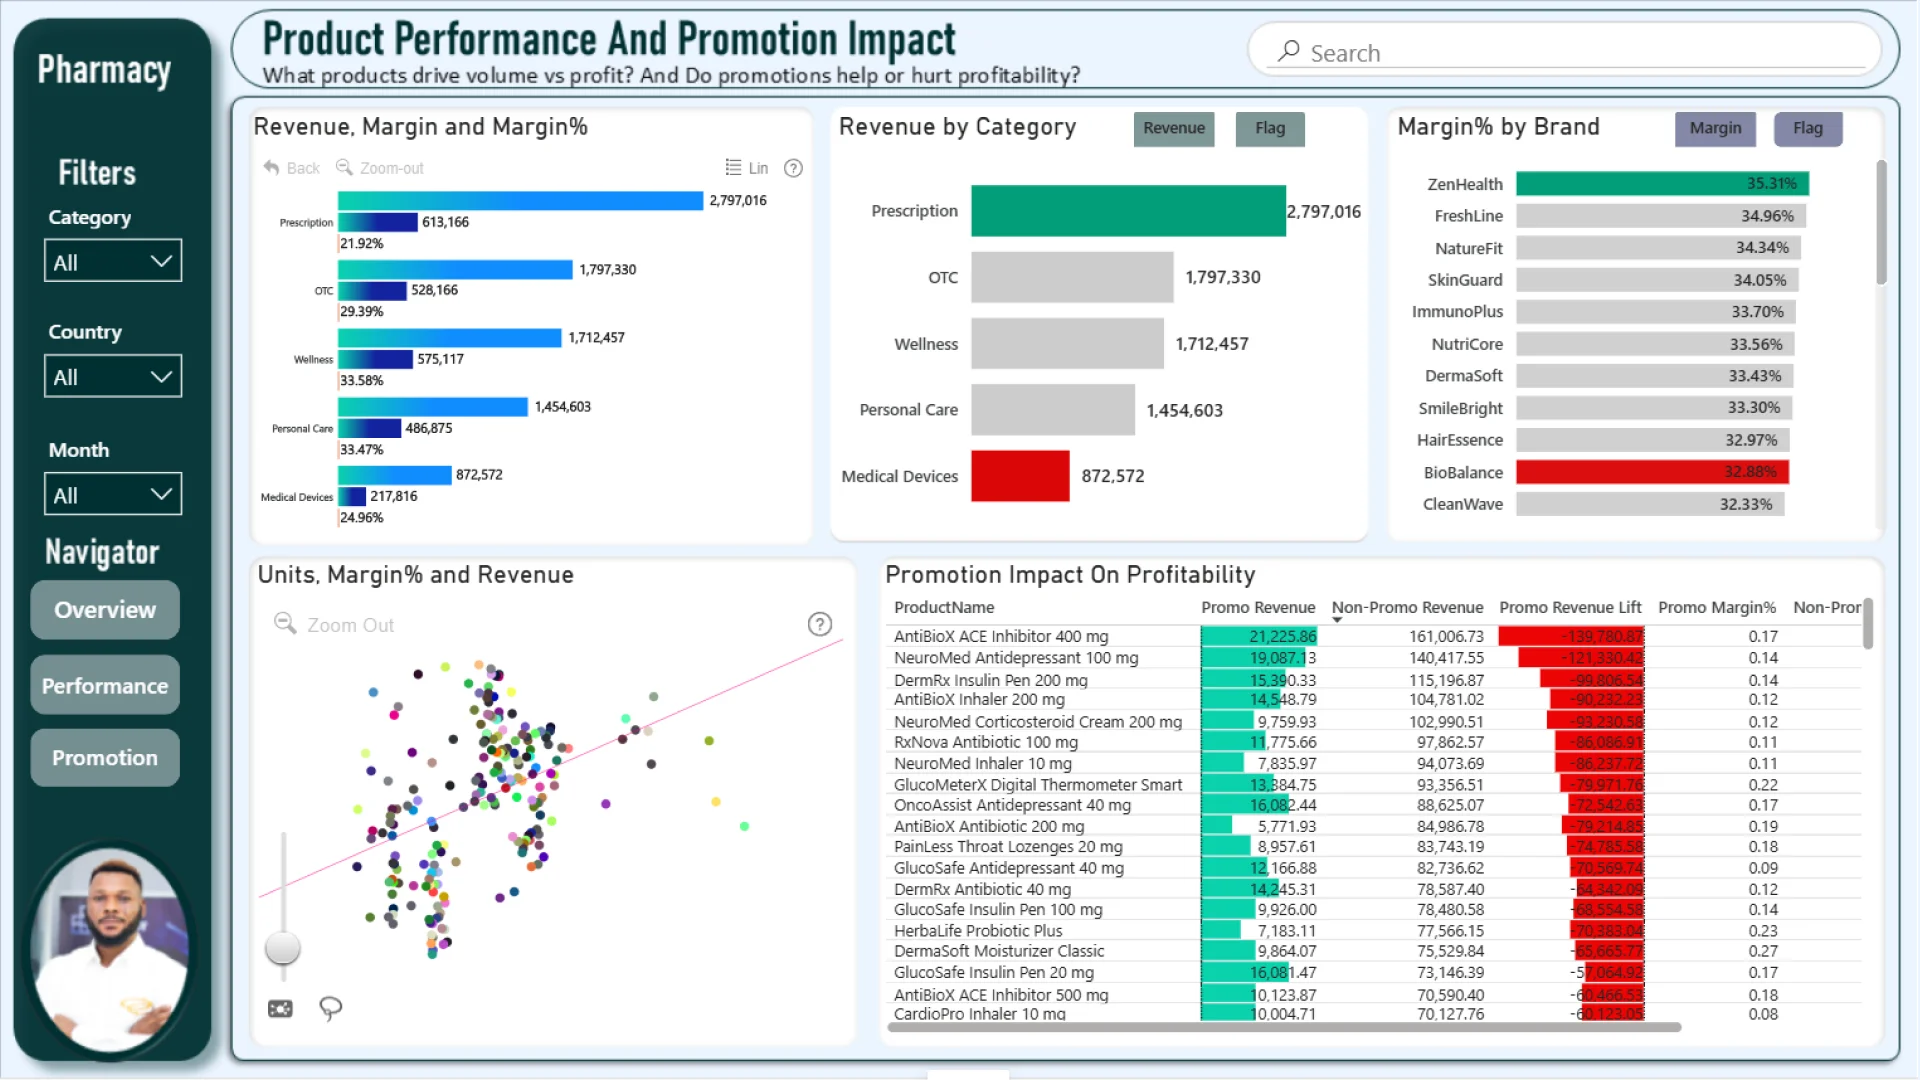
This Power BI report uses the Pharmacy Sales and Profitability dataset. The report features ZoomCharts Drill Down PRO custom visuals for Power BI. It was submitted to the Onyx Data DataDNA ZoomCharts Mini Challenge in January - February 2026.
Author’s Description:
This dashboard provides a comprehensive view of sales and profitability for a European pharmacy chain across countries, regions, pharmacies, and products. It enables fast drill-down analysis to identify top-performing locations, profitable product lines, and the true impact of promotions on margins.
Mobile view allows you to interact with the report. To Download the template please switch to desktop view.