Feel free to leave your vote:
0
Share template with others
Summary
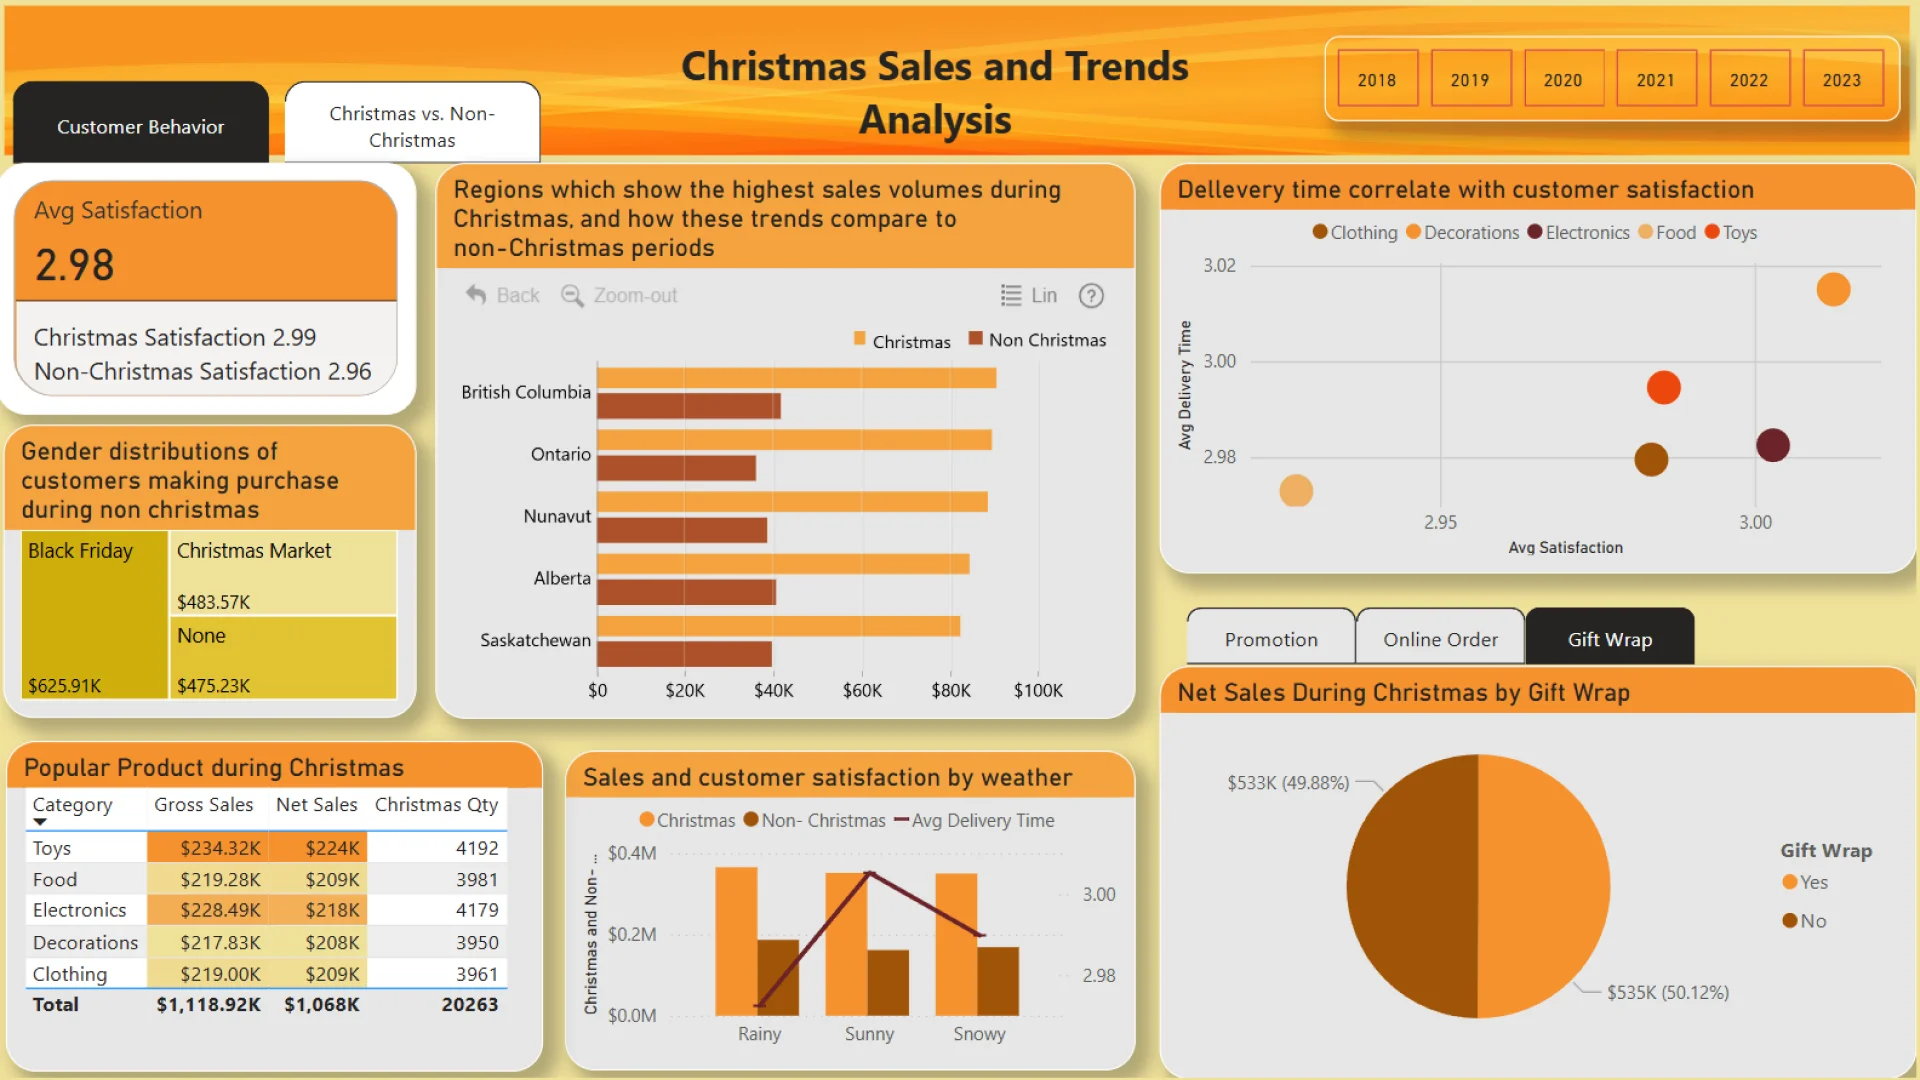
Report submitted for the FP20 Analytics ZoomCharts Challenge, December 2024. The report was built using the Christmas Sales & Trends Dataset and includes ZoomCharts custom Drill Down PRO visuals for Power BI.
Author's description:
This analysis seeks to uncover valuable insights about consumer behavior and business performance during the Christmas season, enabling businesses to optimize strategies and maximize profitability.
1. Identify Sales Trends
- Objective: Understand overall sales performance during the Christmas period and identify significant sales trends.
- Key Metrics:
- Total Revenue: Analyze total revenue generated during the Christmas period and compare it to non-Christmas periods.
- Sales Uplift: Measure the percentage increase in sales during Christmas compared to non-Christmas times.
- Category Performance: Examine which product categories contributed the most to sales (e.g., Toys, Electronics, Clothing).
- Insights:
- Revenue Growth: Identify the sales spike during peak events like Black Friday and Christmas Eve.
- Category Trends: Recognize which categories performed better during the holiday season, helping businesses stock up accordingly.
- Key Metrics:
2. Customer Behavior Insights
- Objective: Gain a deeper understanding of customer preferences and purchasing patterns.
- Key Metrics:
- Product Preferences: Identify the most popular products or categories purchased during the Christmas season.
- Demographic Segmentation: Analyze customer behavior by age group, gender, and location.
- Purchase Method: Determine if customers prefer online or in-store shopping and the impact on sales.
- Insights:
- Customer Demographics: Understand which demographic segments contributed the most to sales (e.g., Working Adults, age groups, etc.).
- Purchase Method: Recognize whether online or in-store purchases drove more sales and how promotional efforts affected each.
- Key Metrics:
3. Seasonal Timing
- Objective: Pinpoint the peak shopping periods during the holiday season to optimize sales strategies.
- Key Metrics:
- Peak Sales Days: Identify specific days with the highest sales, such as Black Friday, Cyber Monday, or Christmas Eve.
- Time-of-Day Sales Patterns: Analyze sales patterns by time of day (e.g., morning, afternoon, evening).
- Weekday vs. Weekend Trends: Understand whether weekdays or weekends generate more sales during the holiday season.
- Insights:
- Peak Shopping Times: Identify the optimal days and times for targeted promotions, offers, and marketing.
- Consumer Preferences: Discover when customers are most likely to make purchases, enabling businesses to plan for high-traffic times.
- Key Metrics:
4. Shipping and Delivery Performance
- Objective: Assess the role of shipping services in customer satisfaction and its impact on purchasing decisions.
- Key Metrics:
- Express Shipping Demand: Evaluate how much demand there is for express shipping during the holiday period.
- Delivery Times and Satisfaction: Analyze the relationship between delivery speed and customer satisfaction.
- Insights:
- Express Shipping: Determine whether customers are willing to pay for expedited shipping and its effect on sales.
- Delivery-Related Satisfaction: Recognize delivery performance as a key factor influencing overall customer satisfaction during the holiday season.
- Key Metrics:
5. Gift-Wrapping and Add-on Services
- Objective: Understand the popularity of gift-wrapping and other add-on services.
- Key Metrics:
- Gift-Wrapping Usage: Calculate the percentage of orders with gift-wrapping services.
- Demographic Preferences for Add-on Services: Identify which customer segments are most likely to use gift-wrapping and other add-on services.
- Insights:
- Gift-Wrapping Demand: Understand the demand for gift-wrapping services during the holiday season.
- Target Demographics: Identify customer groups most inclined to purchase add-on services like gift-wrapping, allowing businesses to create targeted promotions.
- Key Metrics:
ZoomCharts visuals used
Mobile view allows you to interact with the report. To Download the template please switch to desktop view.