Feel free to leave your vote:
0
Share template with others
Summary
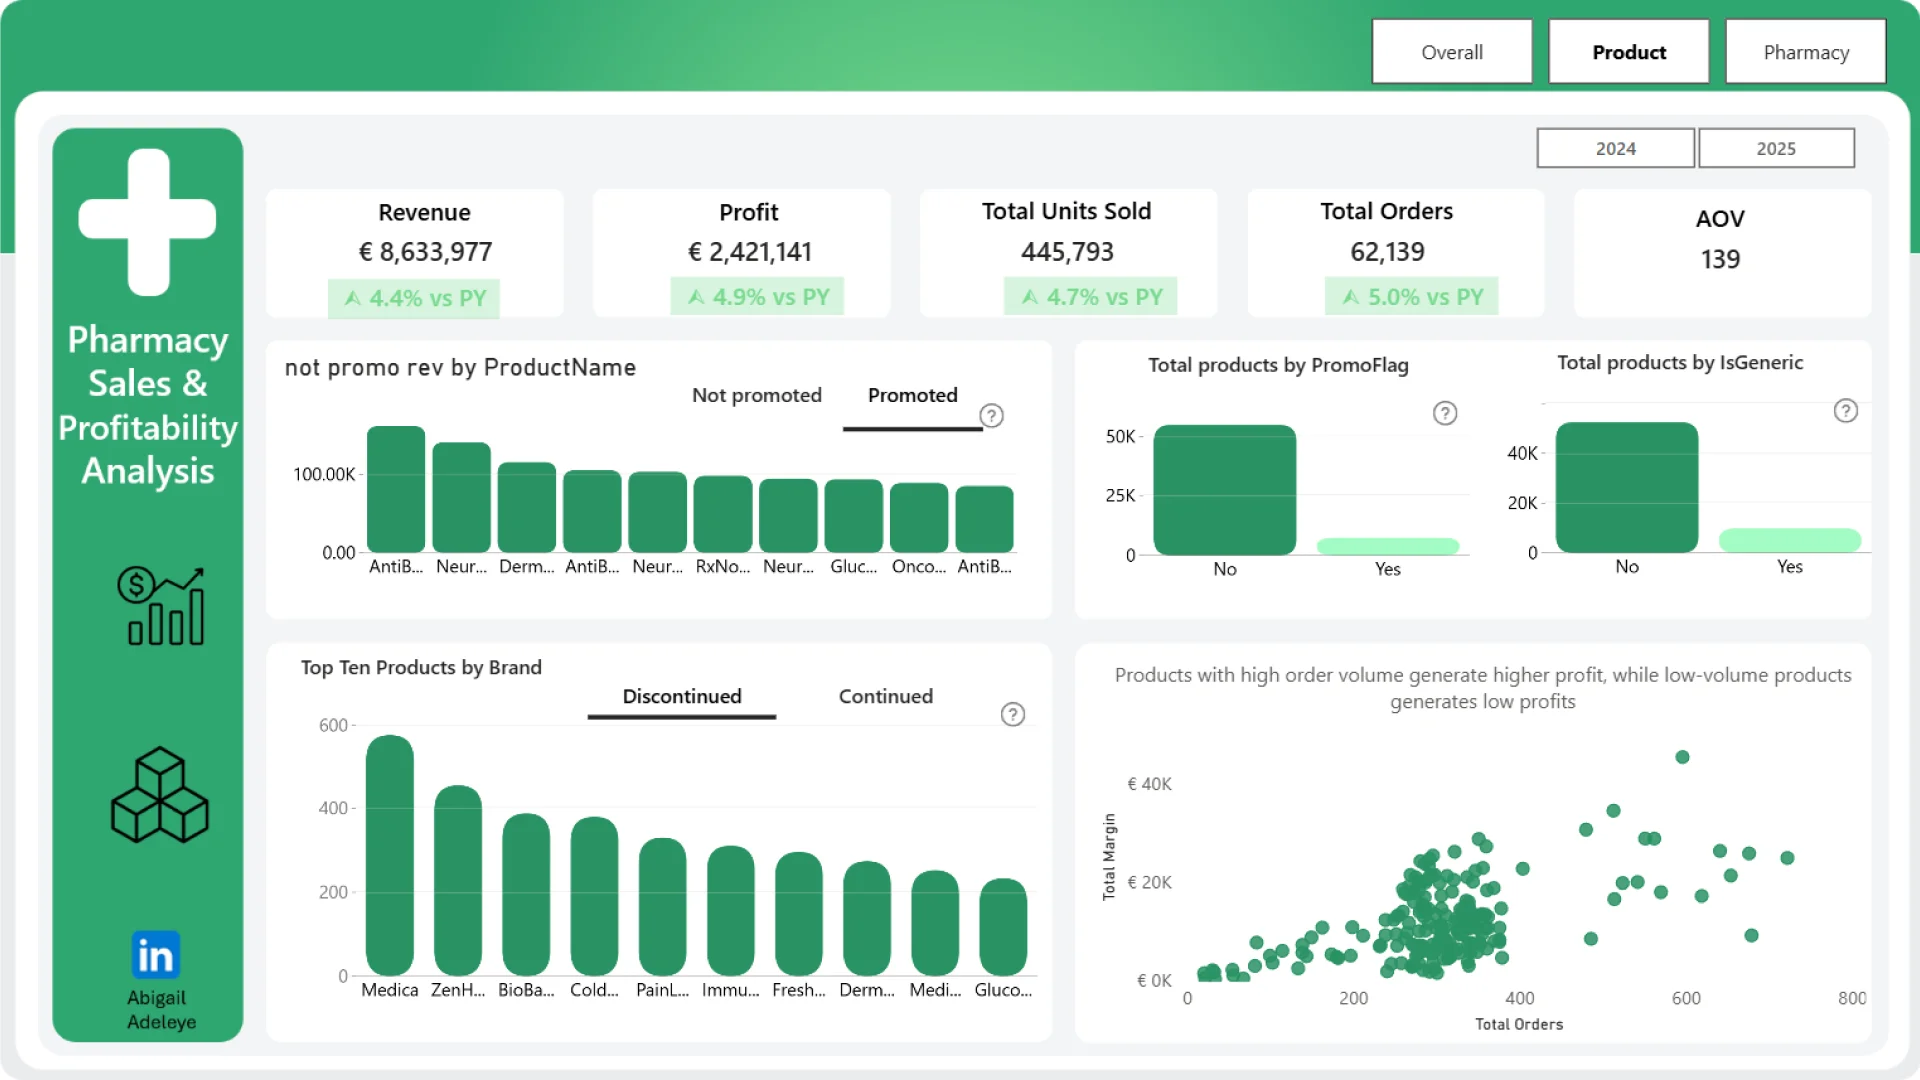
This Power BI report uses the Pharmacy Sales and Profitability dataset. The report features ZoomCharts Drill Down PRO custom visuals for Power BI. It was submitted to the Onyx Data DataDNA ZoomCharts Mini Challenge in January - February 2026.
Author’s Description:
This project analyzes sales and profitability data for a European pharmacy chain distributor operating across multiple countries. The objective is to build an interactive Power BI dashboard that enables stakeholders to understand business performance across countries, regions, and individual pharmacies. The analysis focuses on revenue, units sold, and profit margins, as well as how different product categories and brands perform across locations.
Mobile view allows you to interact with the report. To Download the template please switch to desktop view.