Feel free to leave your vote:
0
Share template with others
Summary
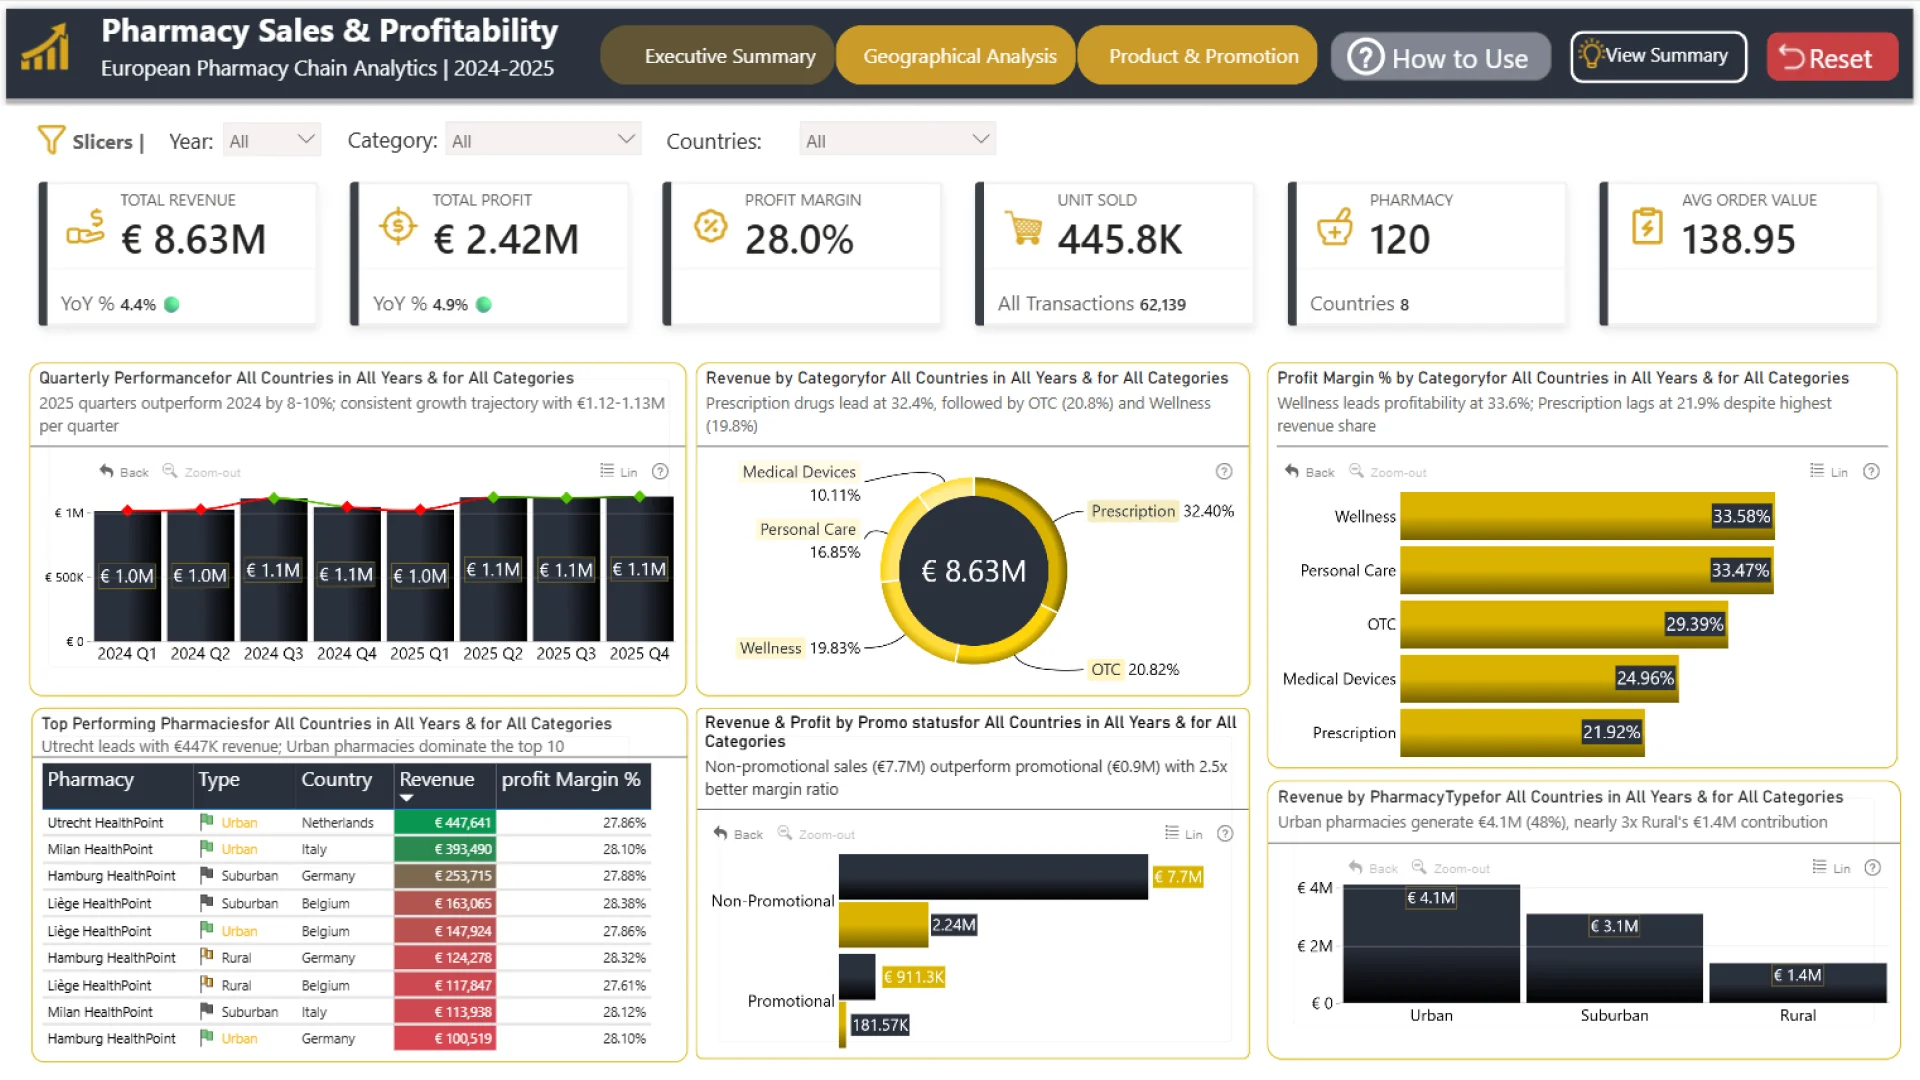
This Power BI report uses the Pharmacy Sales and Profitability dataset. The report features ZoomCharts Drill Down PRO custom visuals for Power BI. It was submitted to the Onyx Data DataDNA ZoomCharts Mini Challenge in January - February 2026.
Author’s Description:
This report analyzes daily sales and profitability for a European pharmacy chain across countries, regions, and individual pharmacies. It includes insights into product and brand performance, top-performing locations, and regional contributions to overall business results to support sales and profitability optimization.
ZoomCharts visuals used
Mobile view allows you to interact with the report. To Download the template please switch to desktop view.