Feel free to leave your vote:
0
Share template with others
Summary
This Power BI report uses the Pharmacy Sales and Profitability dataset. The report features ZoomCharts Drill Down PRO custom visuals for Power BI. It was submitted to the Onyx Data DataDNA ZoomCharts Mini Challenge in January - February 2026.
Author’s Description:
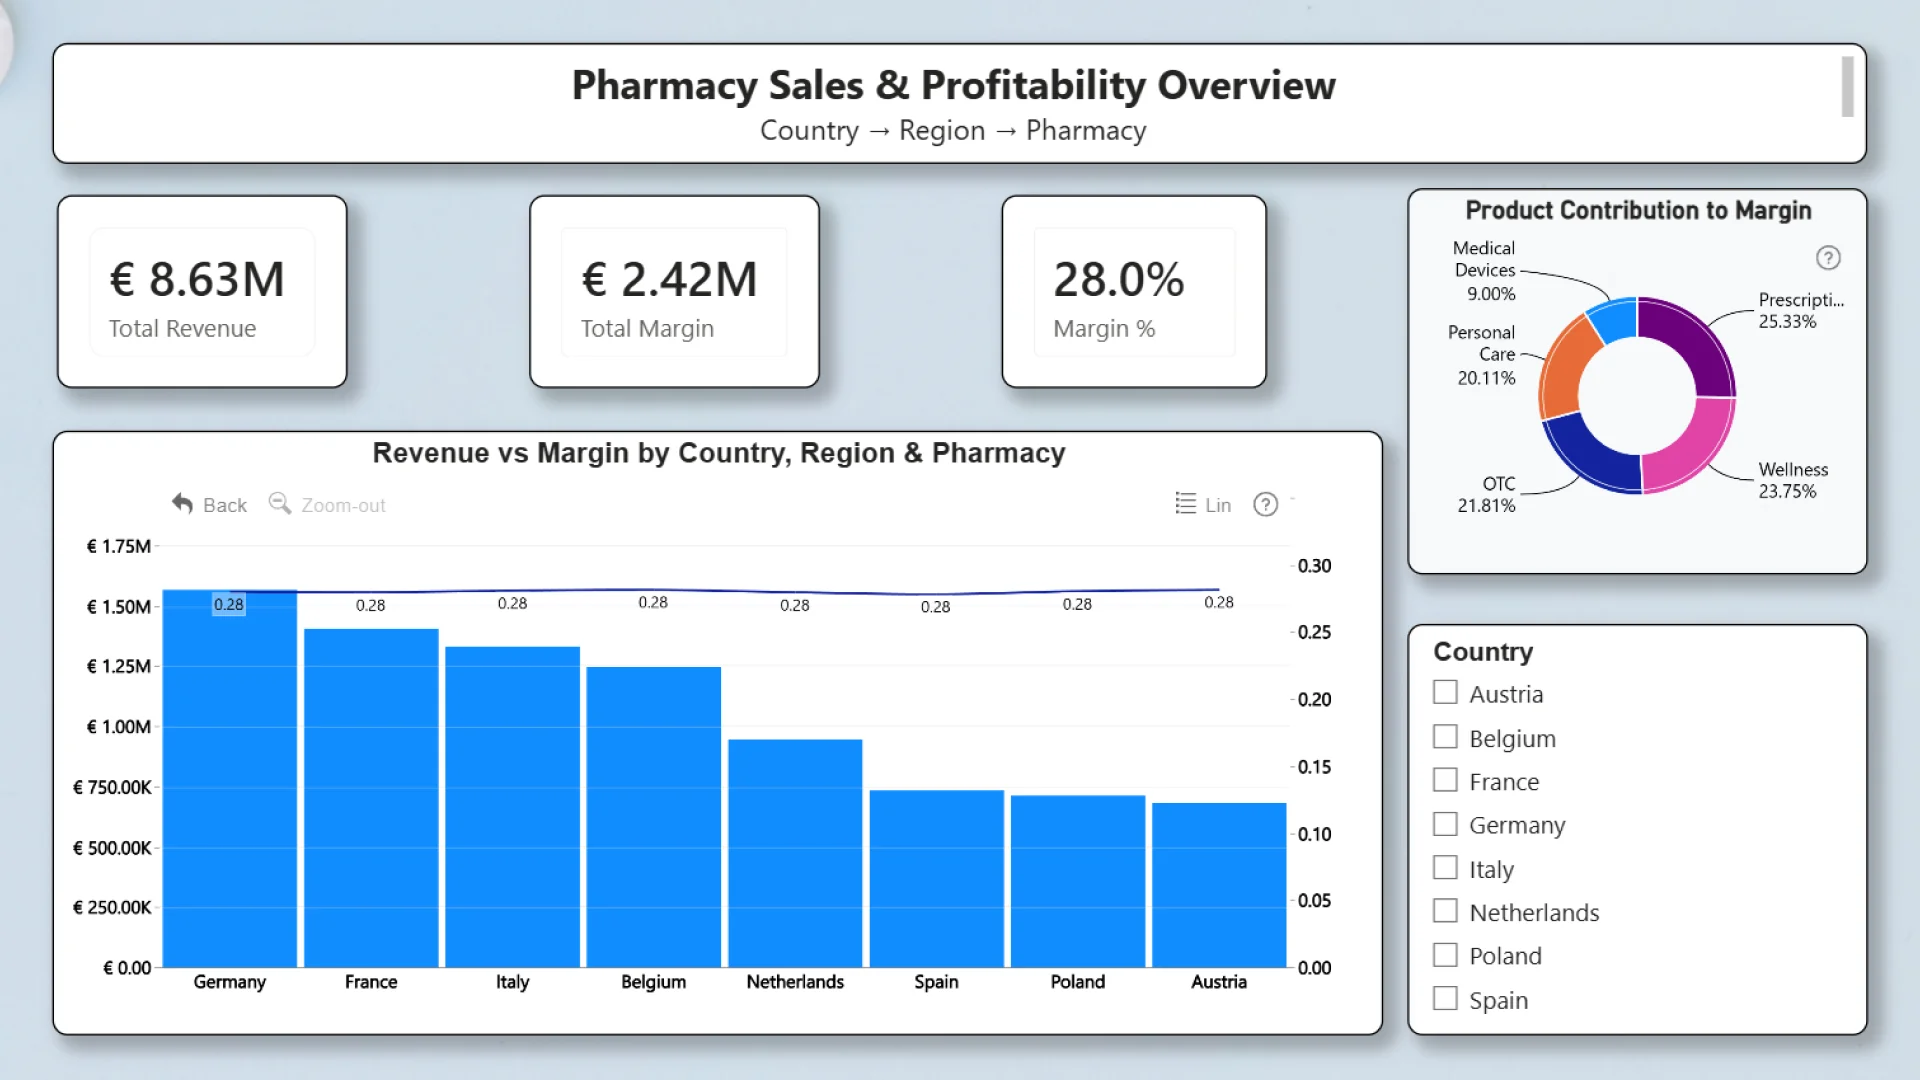
This is a one-page Power BI dashboard that analyzes sales and profitability for a multi-country pharmacy chain. The report uses ZoomCharts drill-down visuals to explore performance from country to region to individual pharmacy and explains margin differences through product mix analysis (from category to brand). Key techniques include hierarchical drill-down, cross-filtering, and descriptive sales and margin analysis.
Mobile view allows you to interact with the report. To Download the template please switch to desktop view.