Feel free to leave your vote:
0
Share template with others
Summary
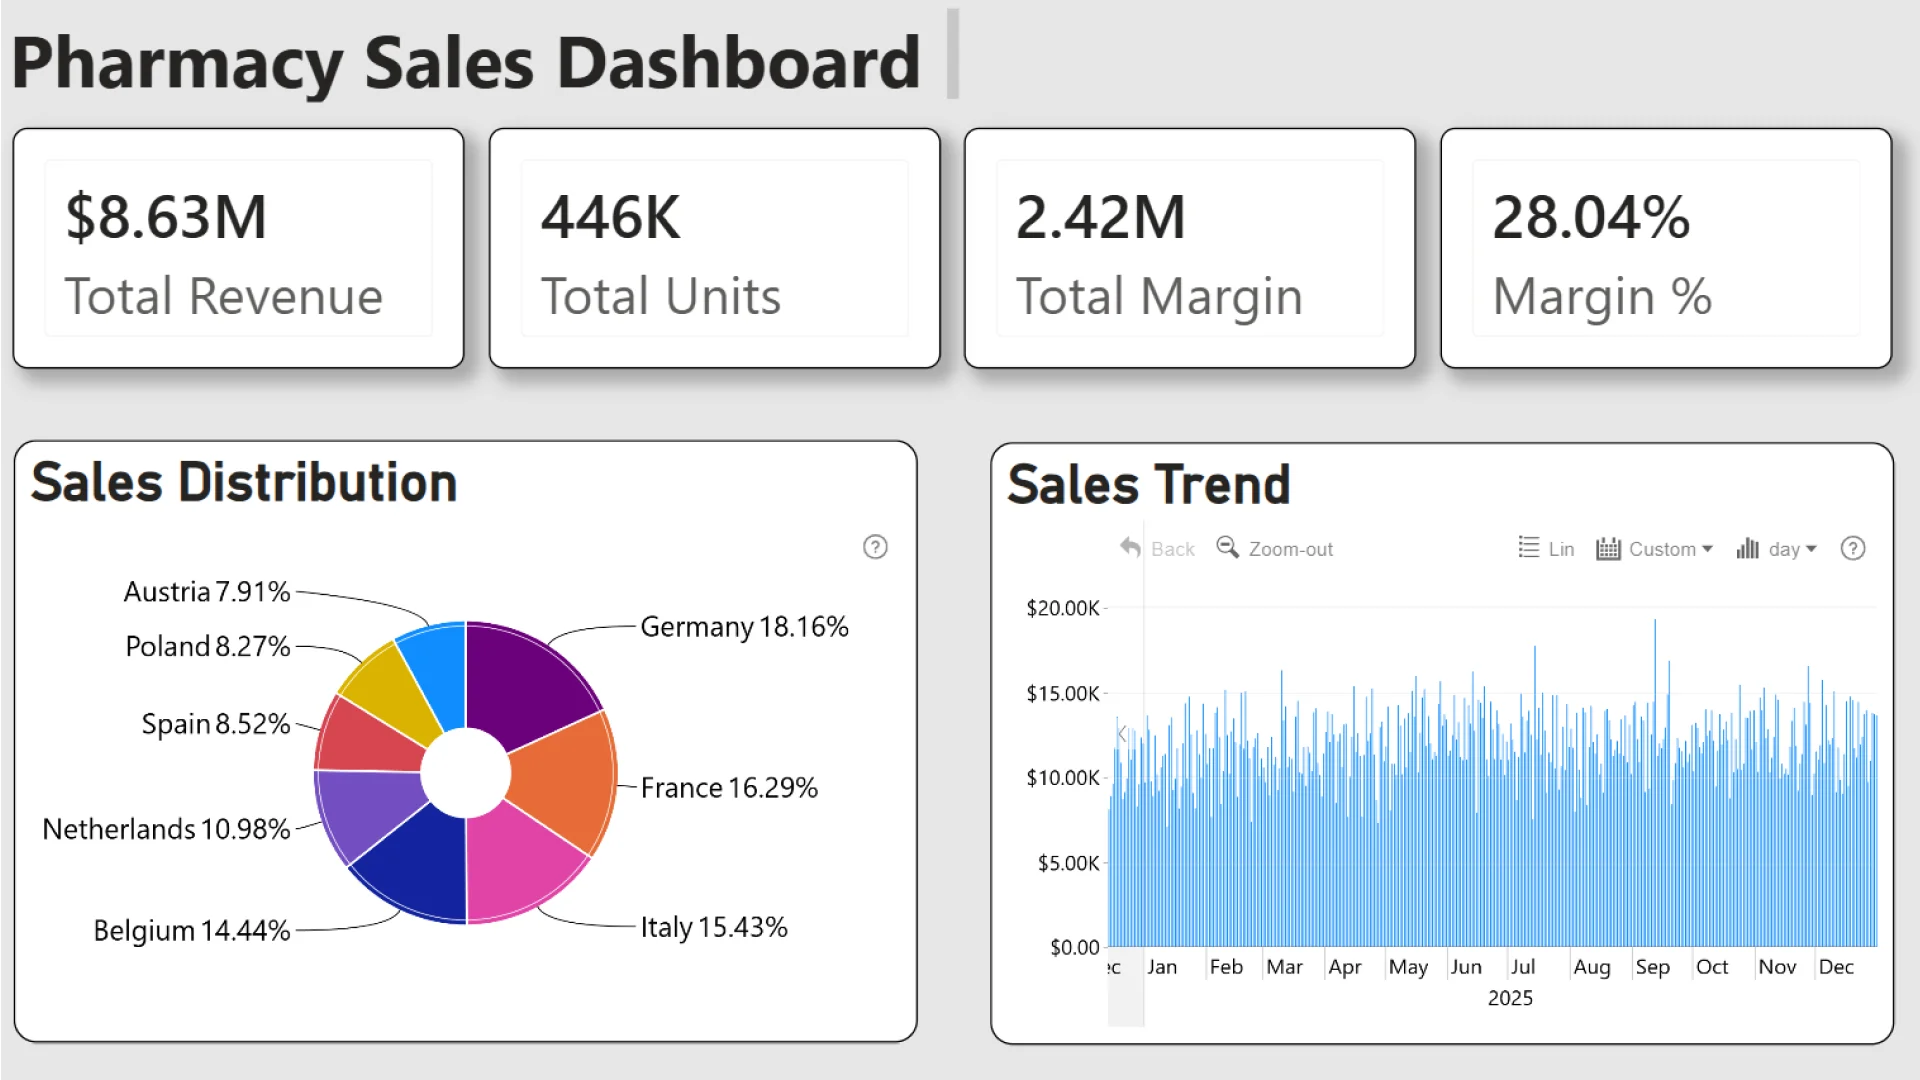
This Power BI report uses the Pharmacy Sales and Profitability dataset. The report features ZoomCharts Drill Down PRO custom visuals for Power BI. It was submitted to the Onyx Data DataDNA ZoomCharts Mini Challenge in January - February 2026.
Author’s Description:
Analyzed pharmacy sales trends using ZoomCharts drill-down visuals. The report features the Drill Down Donut PRO for location hierarchy analysis and the Drill Down TimeSeries PRO for date navigation. The focus was on clear KPI tracking and user-friendly interactivity.
Mobile view allows you to interact with the report. To Download the template please switch to desktop view.