Feel free to leave your vote:
0
Share template with others
Summary
This Power BI report uses the Pharmacy Sales and Profitability dataset. The report features ZoomCharts Drill Down PRO custom visuals for Power BI. It was submitted to the Onyx Data DataDNA ZoomCharts Mini Challenge in January - February 2026.
Author’s Description:
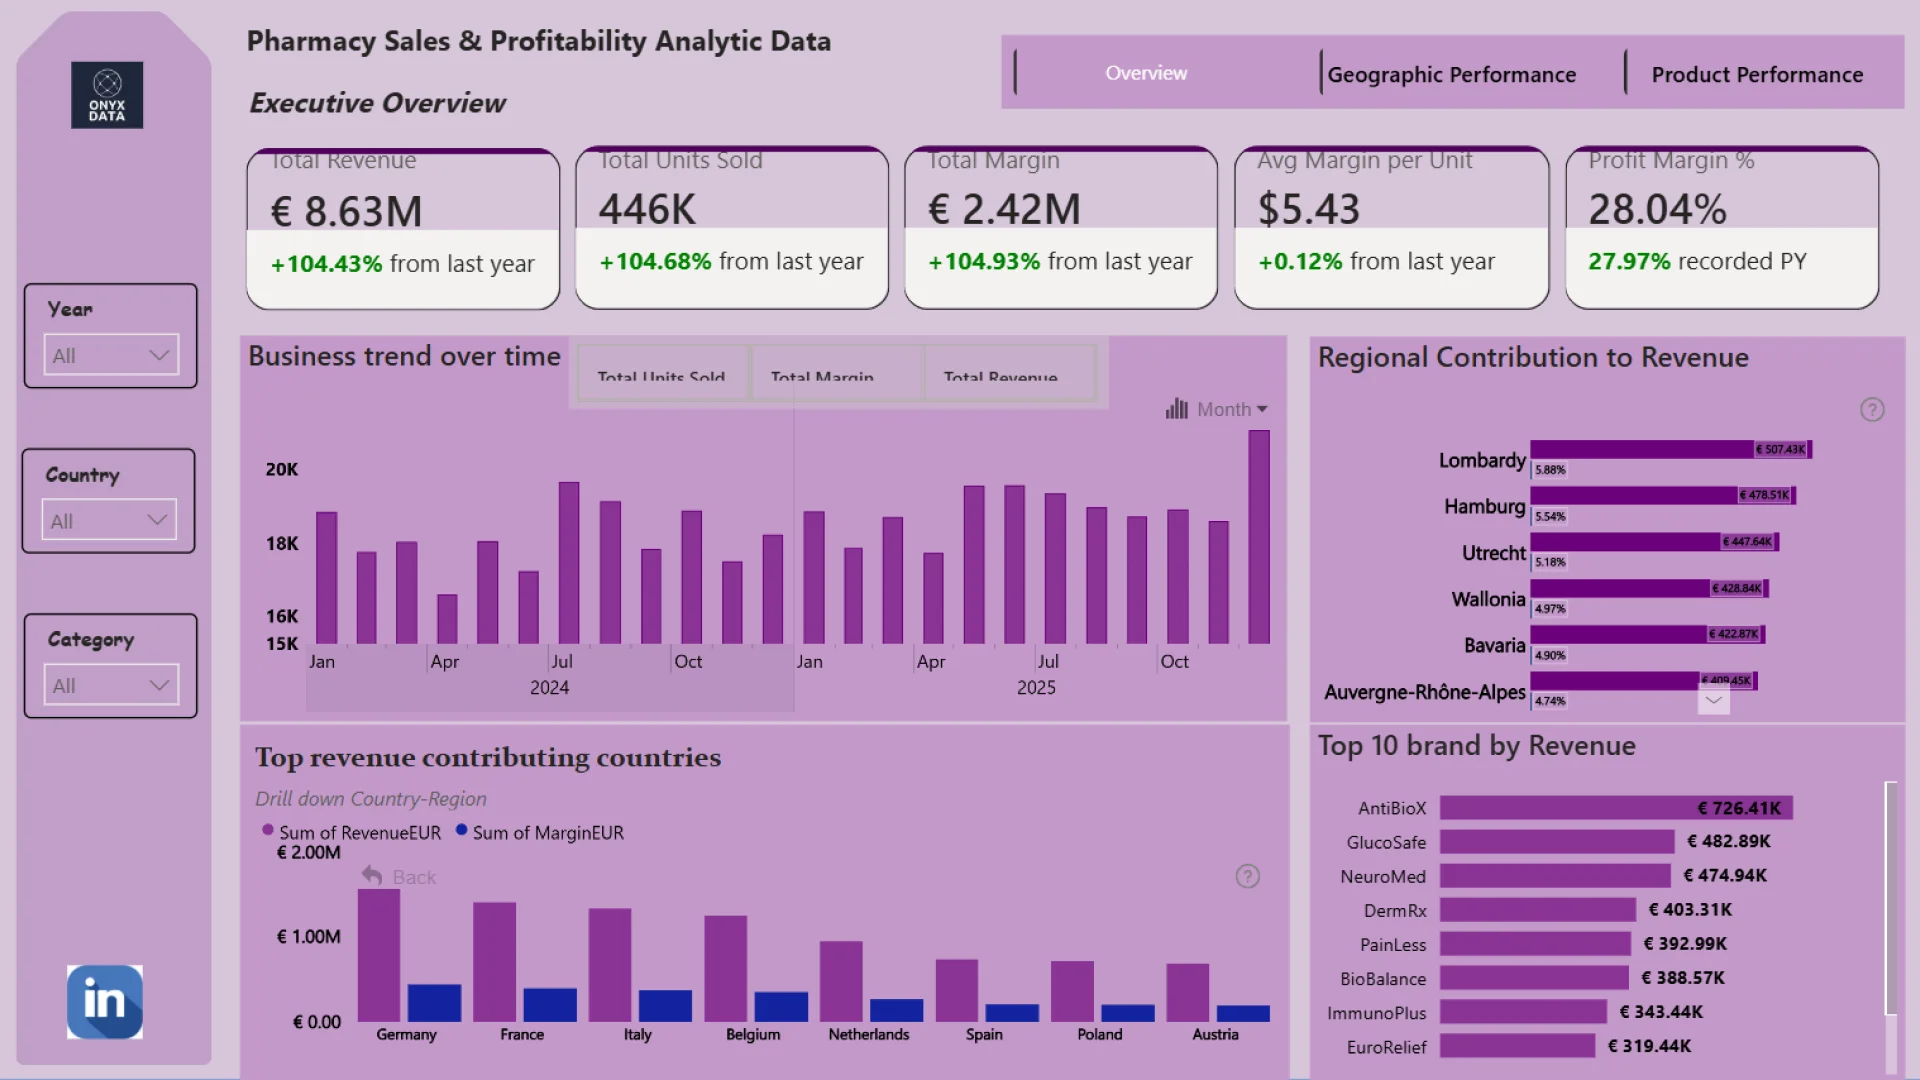
This Power BI report analyzes pharmacy sales and profitability across multiple European countries. It explores revenue, units sold, and margin trends; compares performance across countries, regions, and pharmacies; and evaluates product category and brand performance. The dashboard includes year-over-year KPI metrics, drill-down analysis, and scatter visualizations to identify key performance drivers and profitability insights.
ZoomCharts visuals used
Mobile view allows you to interact with the report. To Download the template please switch to desktop view.