Feel free to leave your vote:
1
Share template with others
Summary
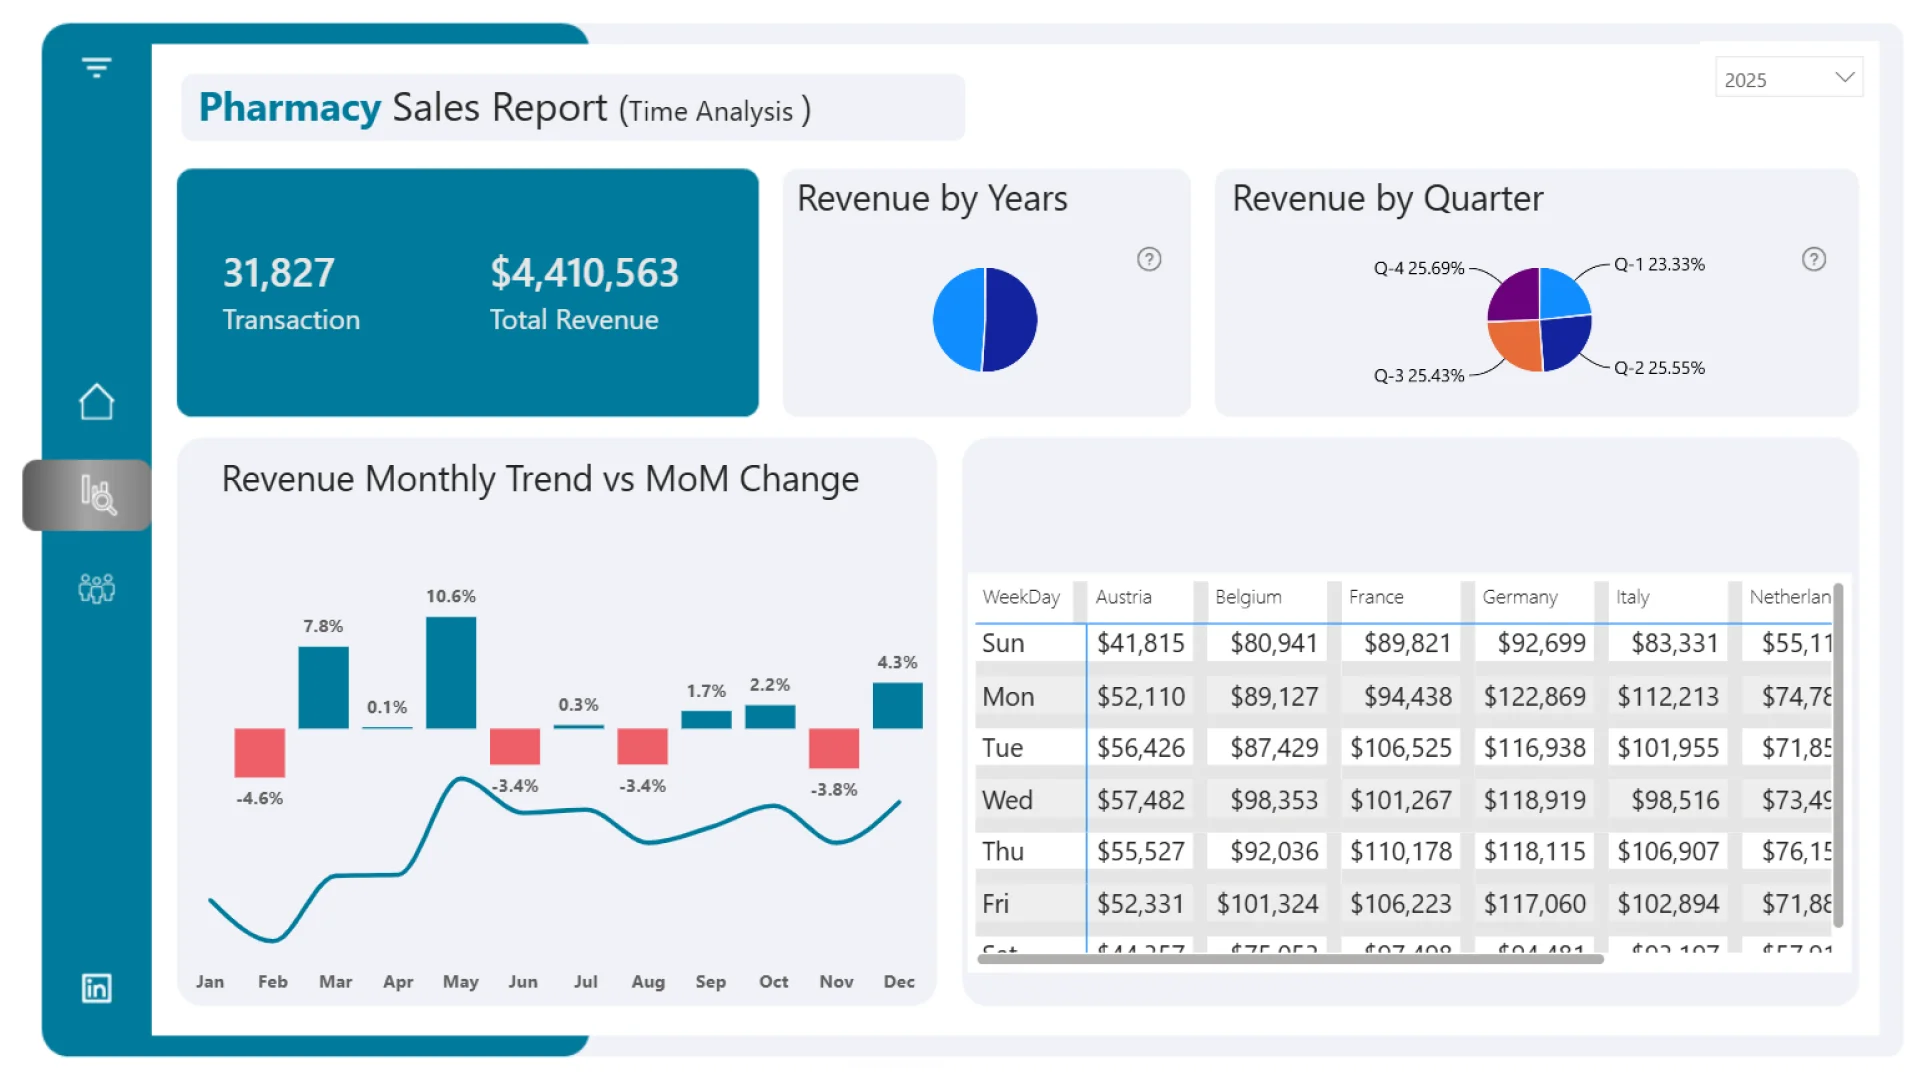
This Power BI report uses the Pharmacy Sales and Profitability dataset. The report features ZoomCharts Drill Down PRO custom visuals for Power BI. It was submitted to the Onyx Data DataDNA ZoomCharts Mini Challenge in January - February 2026.
Author’s Description:
That’s the question I explored in my Power BI report for the Onyx Data January–February 2026 Challenge, analyzing 120 pharmacy stores across 8 European markets.
ZoomCharts visuals used
Mobile view allows you to interact with the report. To Download the template please switch to desktop view.