Feel free to leave your vote:
0
Share template with others
Summary
This Power BI report uses the Pharmacy Sales and Profitability dataset. The report features ZoomCharts Drill Down PRO custom visuals for Power BI. It was submitted to the Onyx Data DataDNA ZoomCharts Mini Challenge in January - February 2026.
Author’s Description:
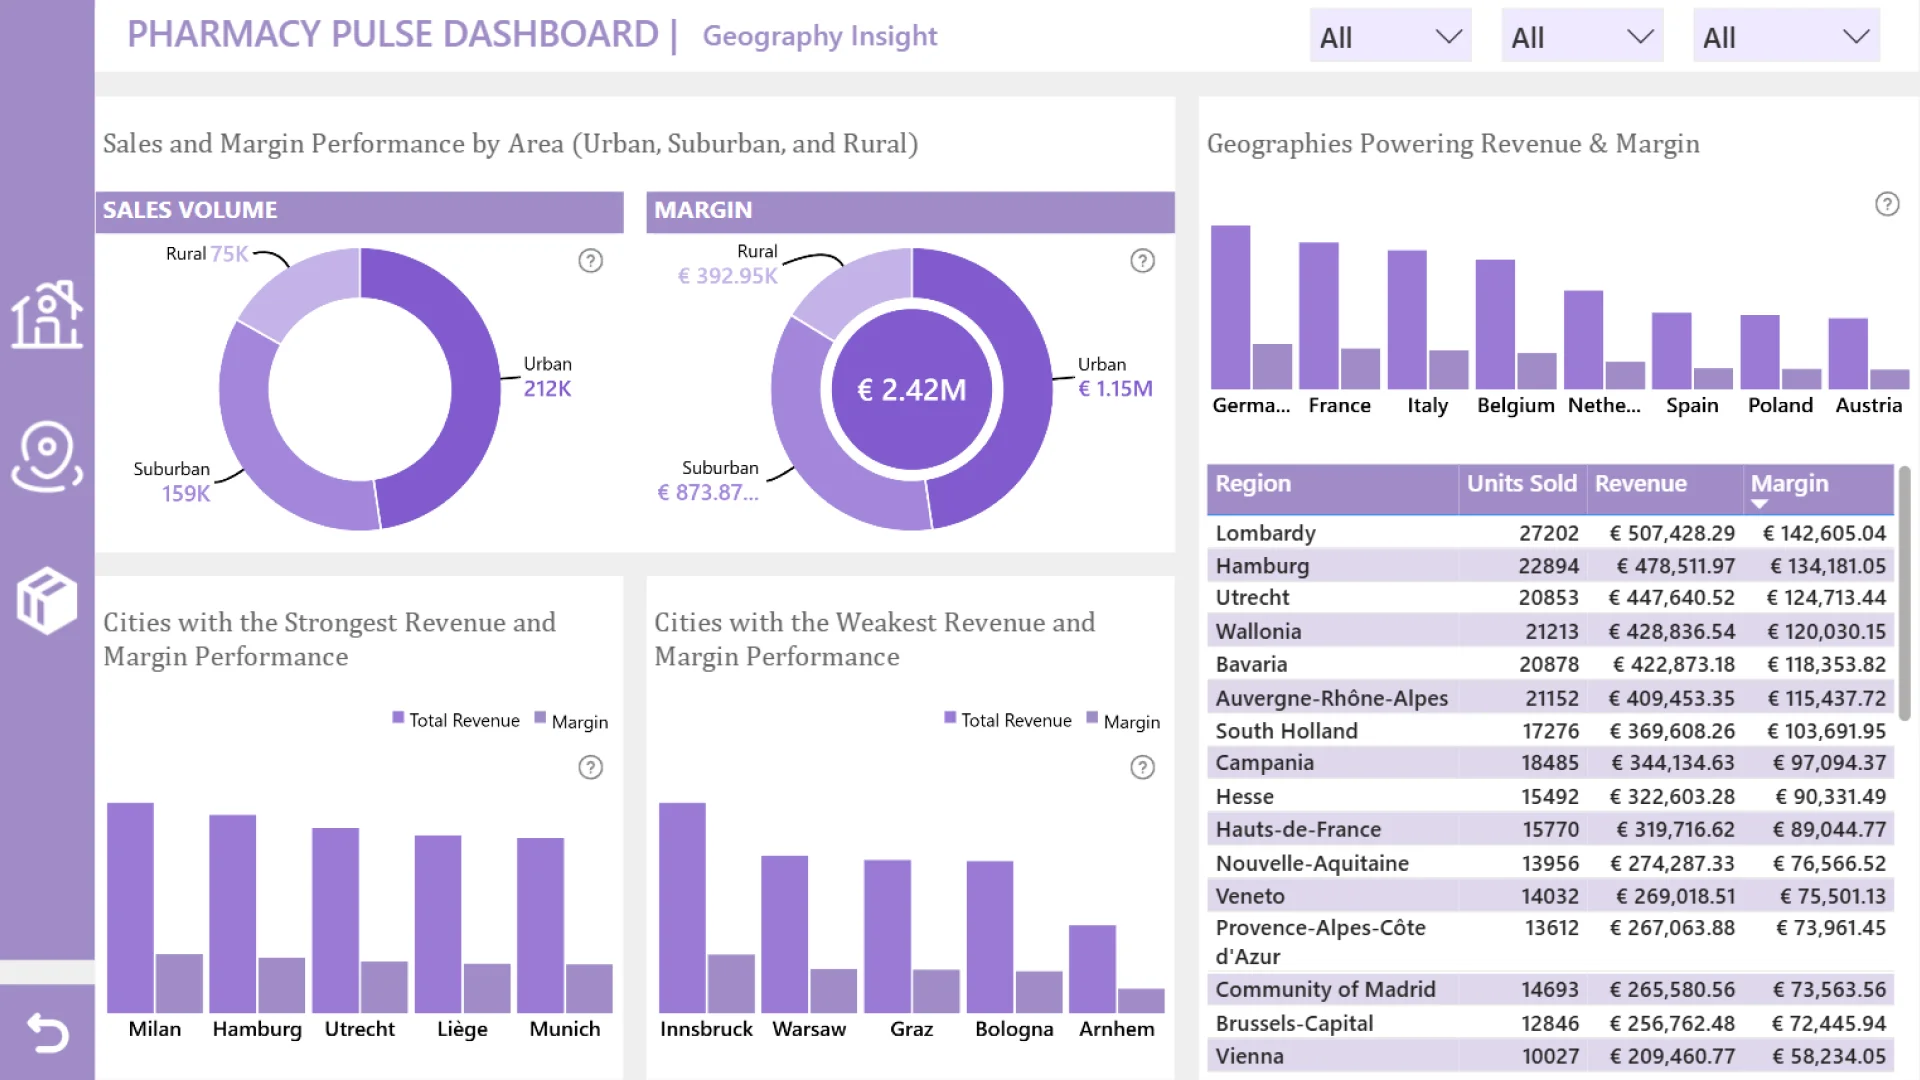
The Pharmacy Pulse Dashboard was developed to provide data-driven visibility into pharmacy sales performance, inventory trends, customer purchasing behavior, and regional distribution effectiveness. The dashboard enables stakeholders to make informed decisions regarding revenue optimization, inventory management, and operational efficiency.
ZoomCharts visuals used
Mobile view allows you to interact with the report. To Download the template please switch to desktop view.