logo
For Power BI
  • Products
    • Drill Down Donut Pro Drill Down Donut PRO
    • Drill Down Pie Pro Drill Down Pie PRO
    • Drill TimeSeries Pro Drill Down TimeSeries PRO
    • Drill Combo Pro Drill Down Combo PRO
    • Drill Map Pro Drill Down Map PRO
    • Drill Scatter Pro Drill Down Scatter PRO
    • Drill Down Network Pro Drill Down Network PRO
    • Drill Down Waterfall Pro Drill Down Waterfall PRO
    • Drill Down Graph Pro Drill Down Graph PRO
    • Drill Down Timeline Pro Drill Down Timeline PRO
    • Drill Down Combo Bar PRO Drill Down Combo Bar PRO

    Video tutorials

    Watch Now

    More than 90 videos on how to enhance Power BI with ZoomCharts

    Learn more
    All visuals
  • Resources

      Resources

    • Documentation
    • Report Examples
    • Blog
    • Webinars
    • Video Tutorials
    • Visuals Gallery

    Support

    • ZoomCharts Assistance
    • Contact Sales
    • Contact Support
    • FAQ

    Challenges

    Challenges

    Improve your report creation skills by participating in free challenges for report creators.

    Learn more
    Start trial
  • Services
    • Power BI Report Development
    • Custom Visual Development
  • Challenges
  • Pricing
Request a quote Start Free Book a Demo Sign in
Get it now
Go back

Contents

Go back

Share

Logo

Welcome to the Onyx Data January 2024 Challenge!

Dec 31 - Jan 30, 2023 | EST

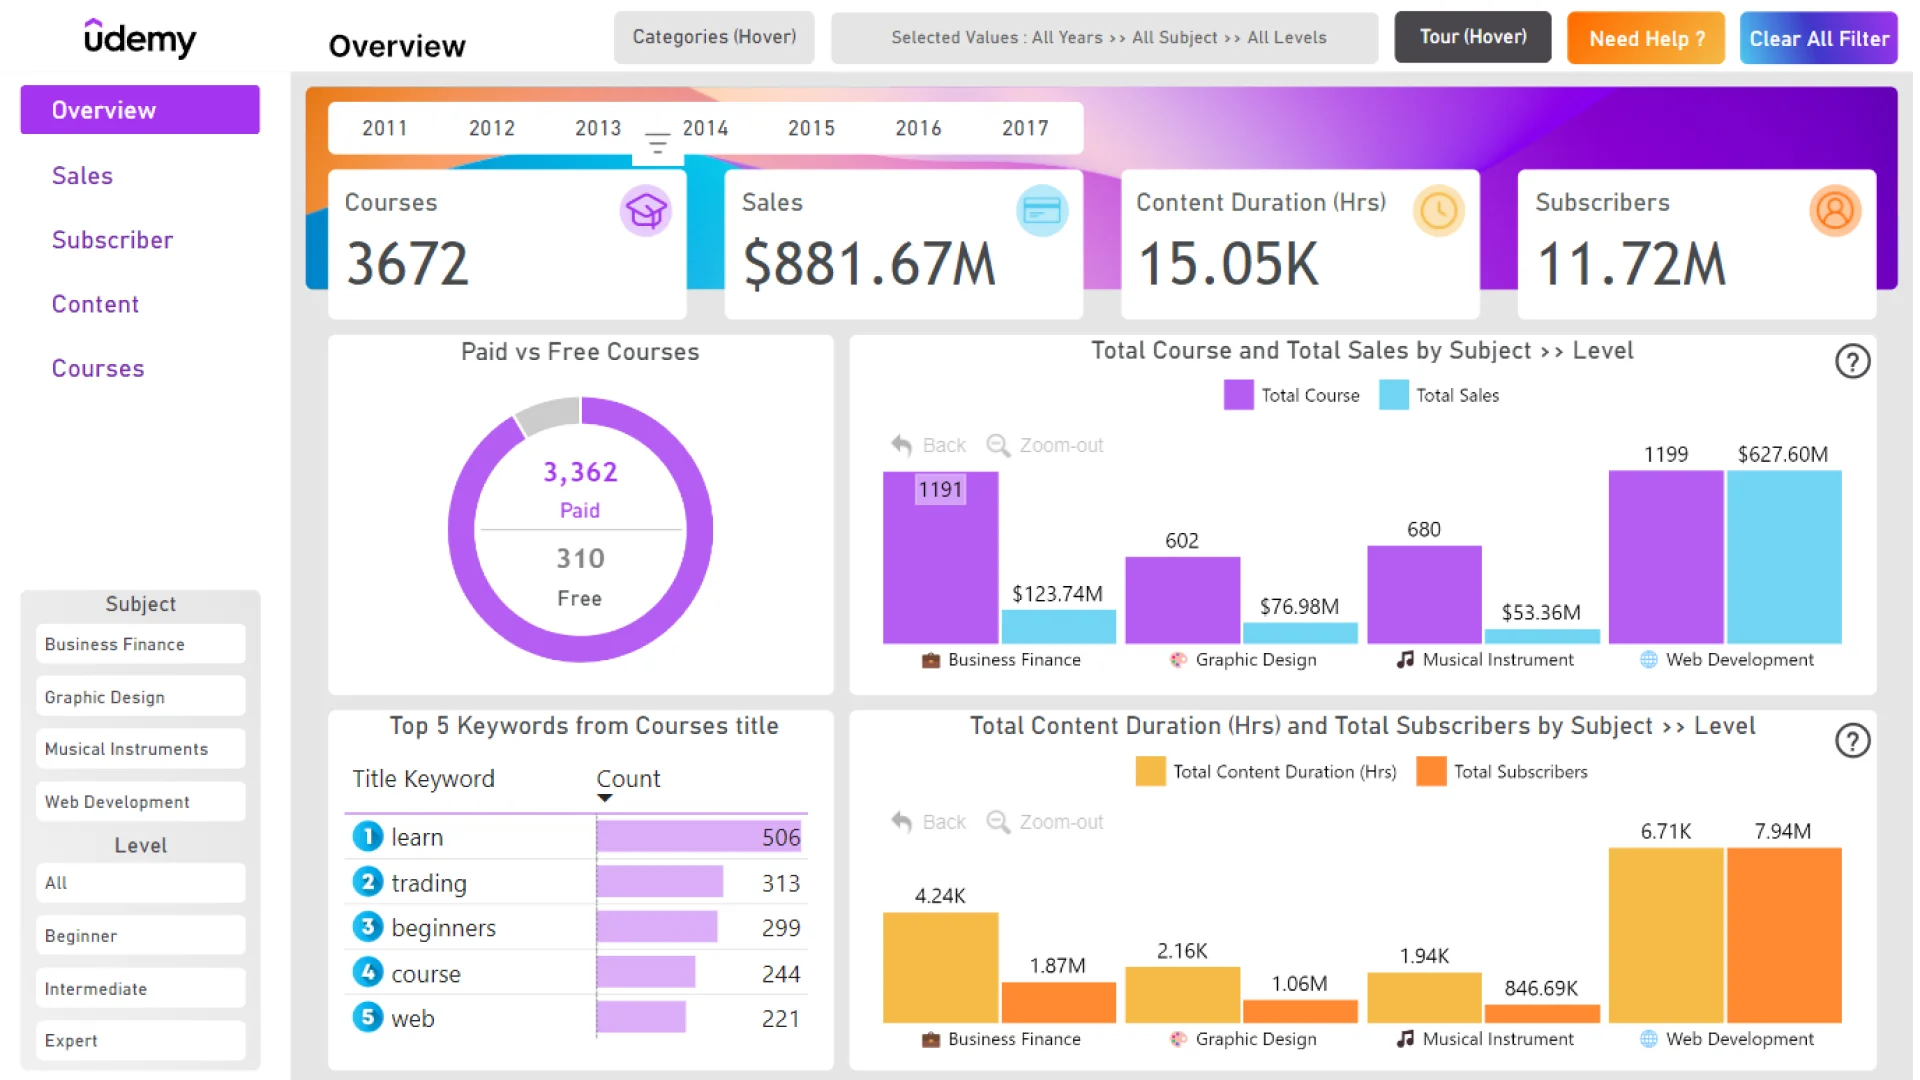
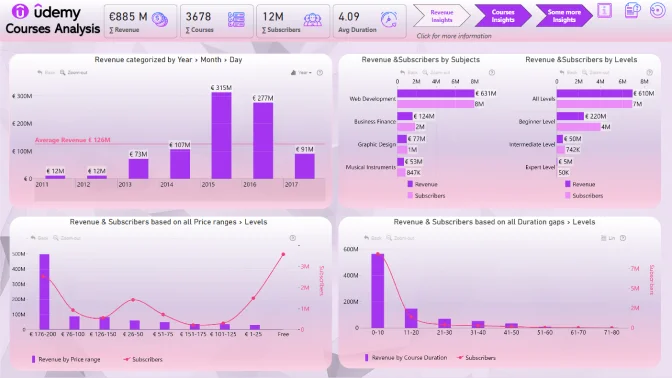
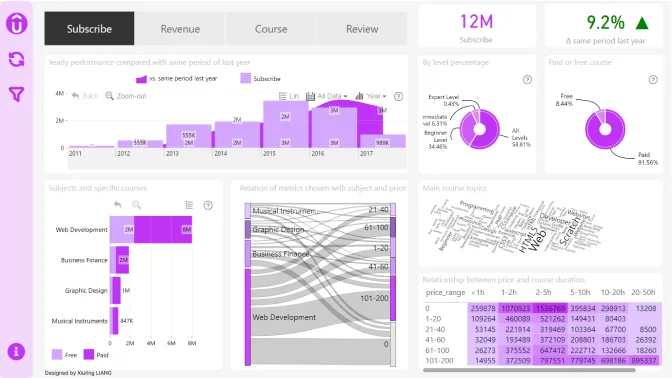
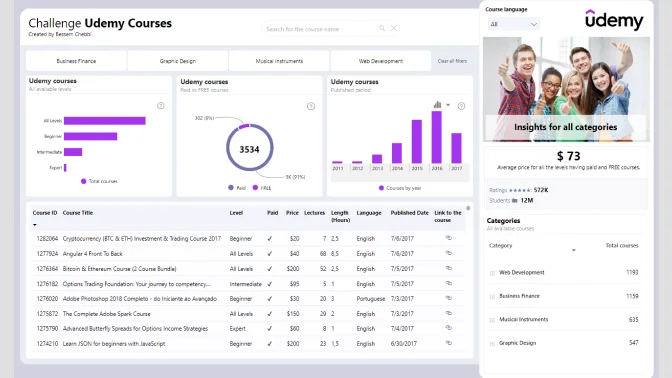
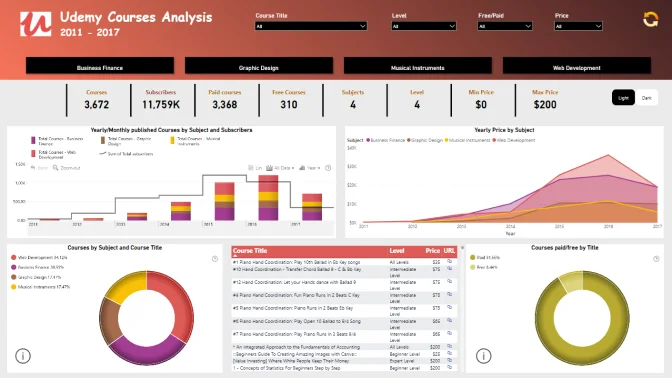
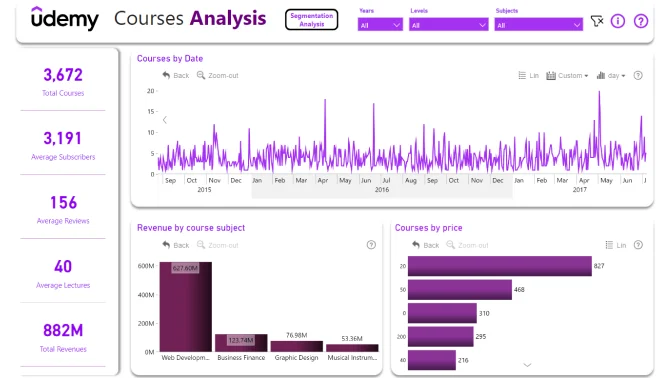
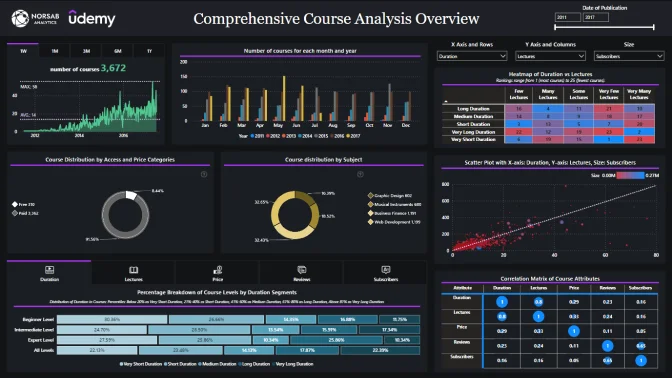
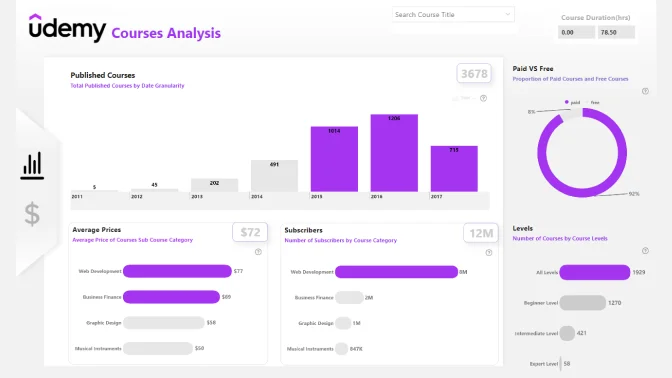
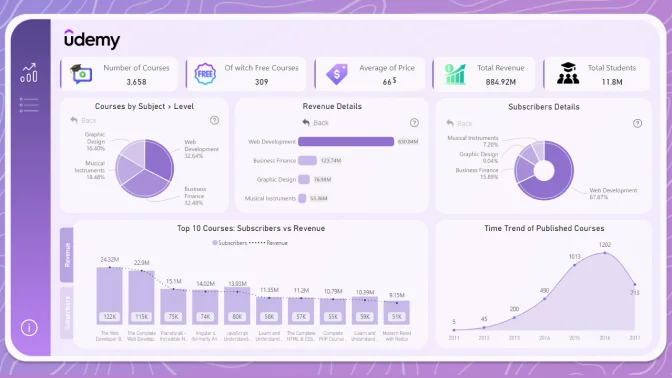
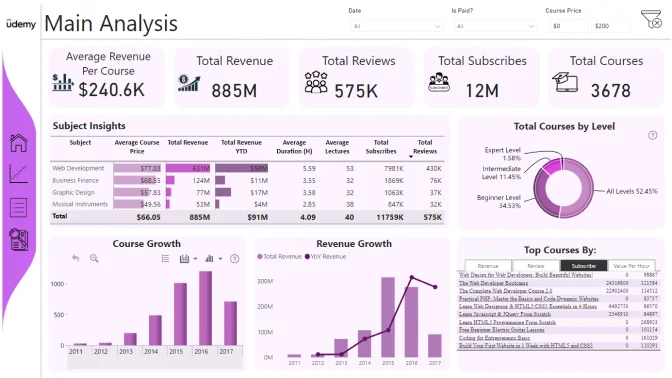
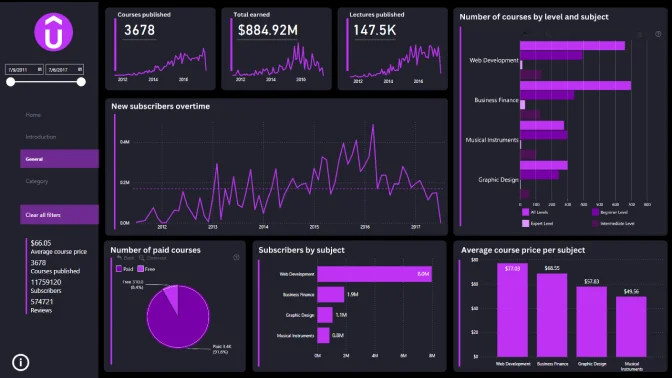
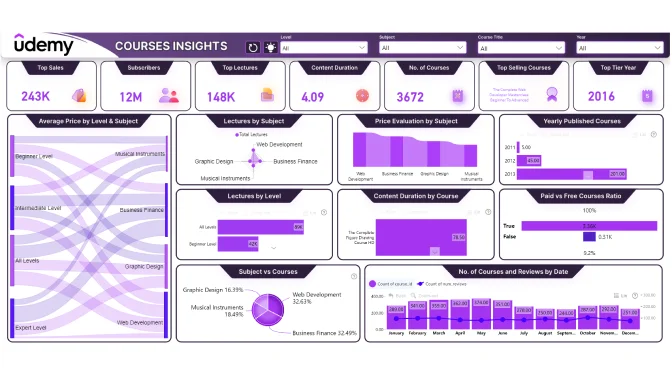
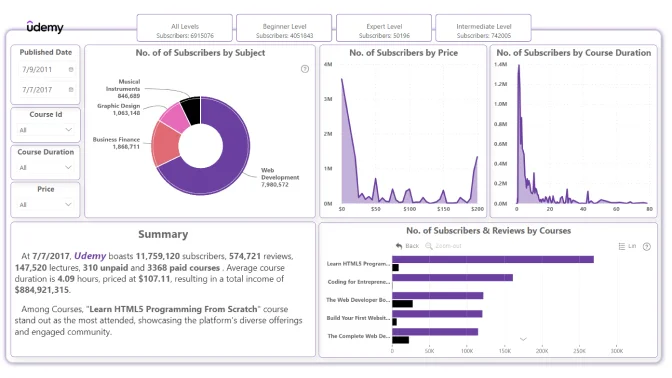
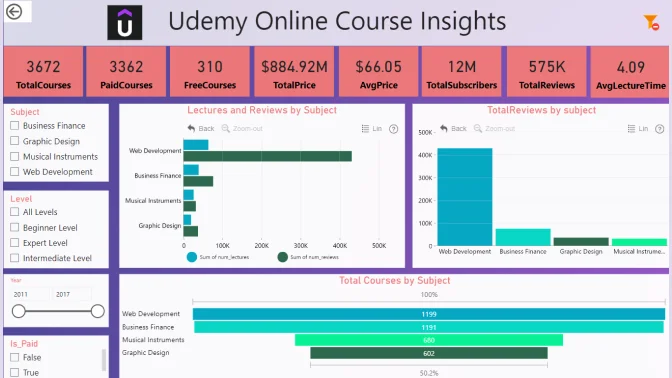
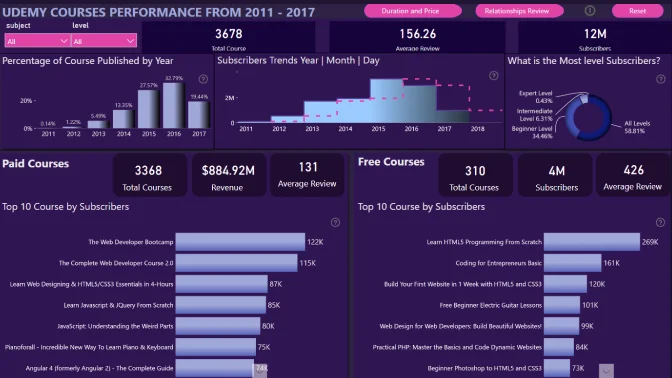
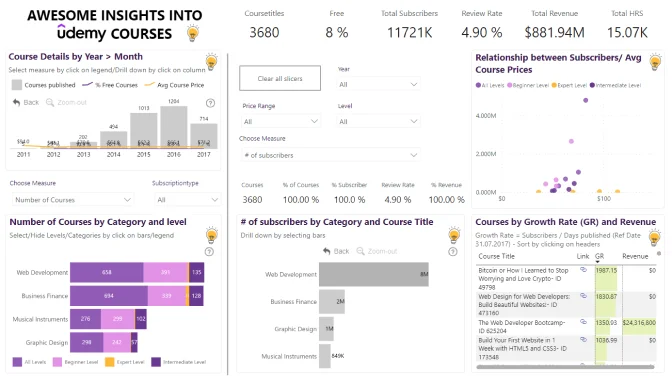
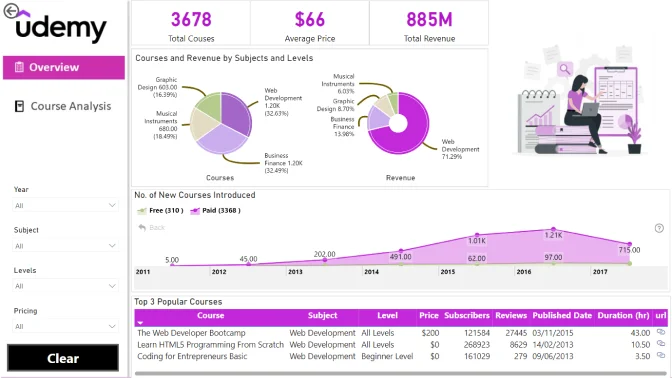
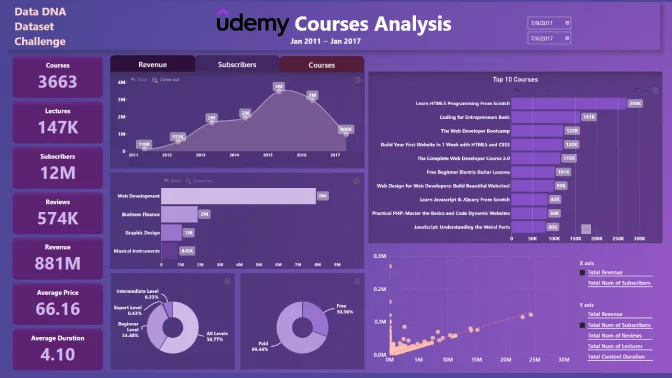
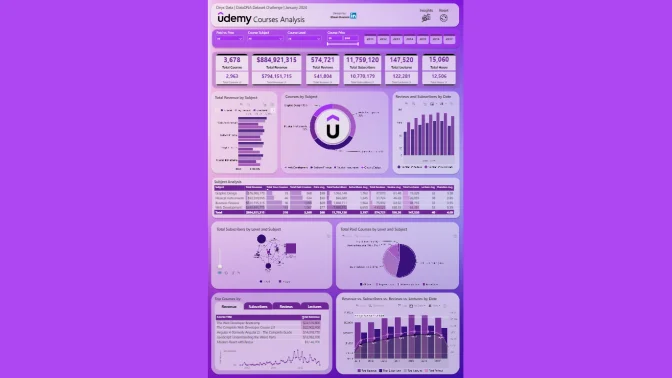
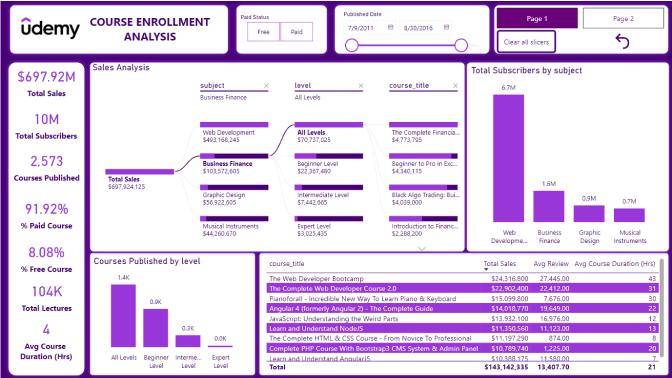
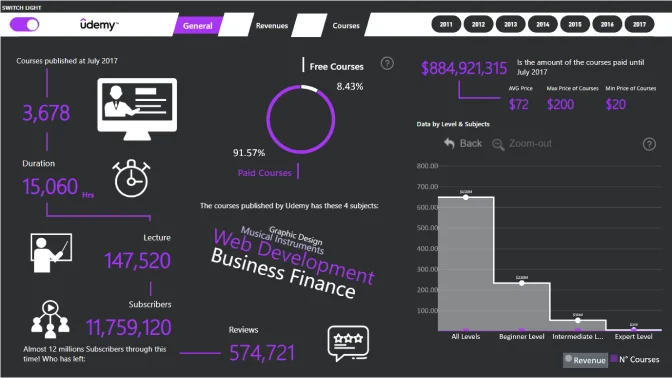
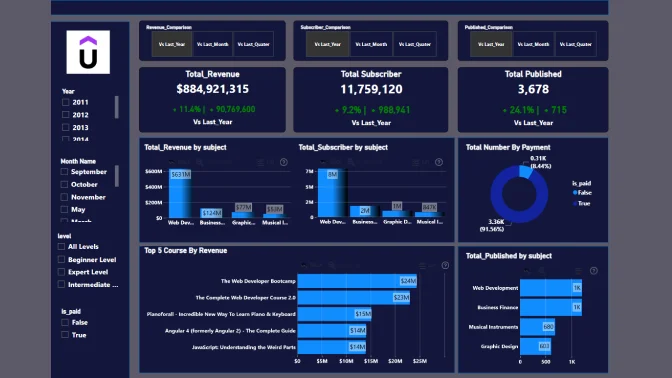
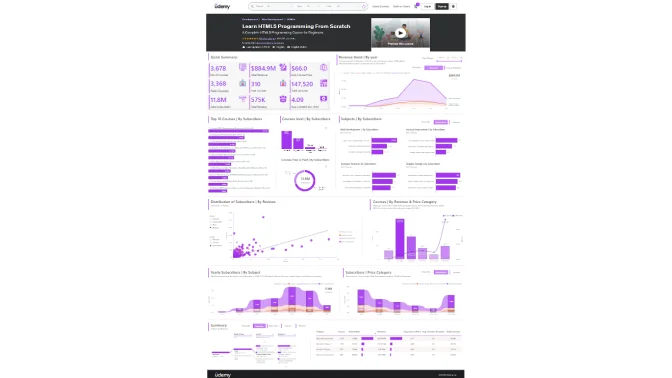
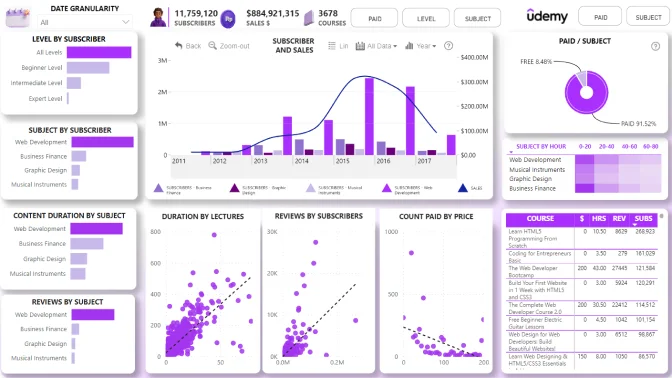
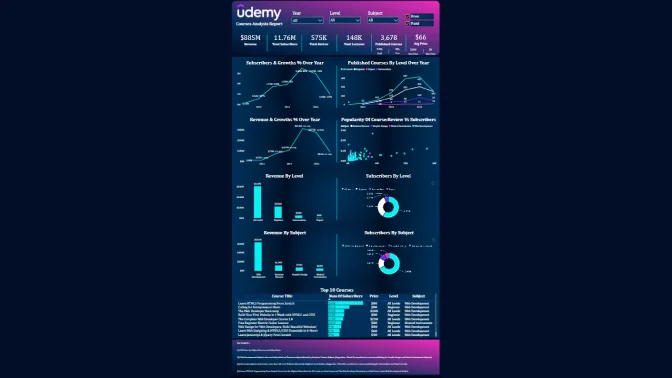
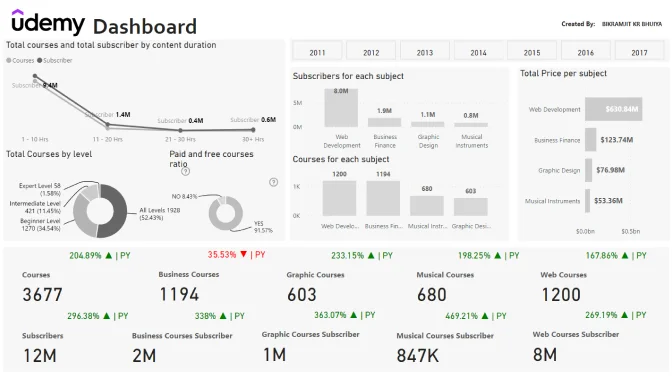
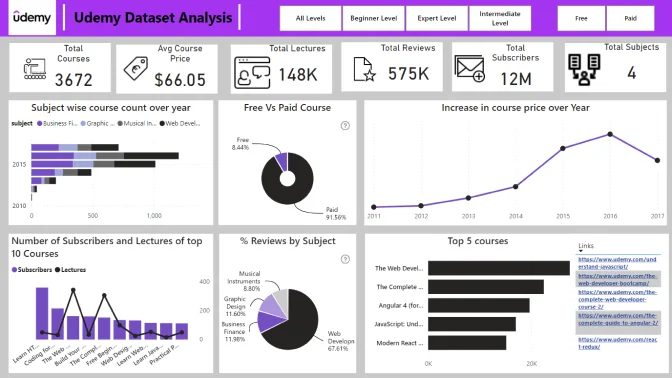
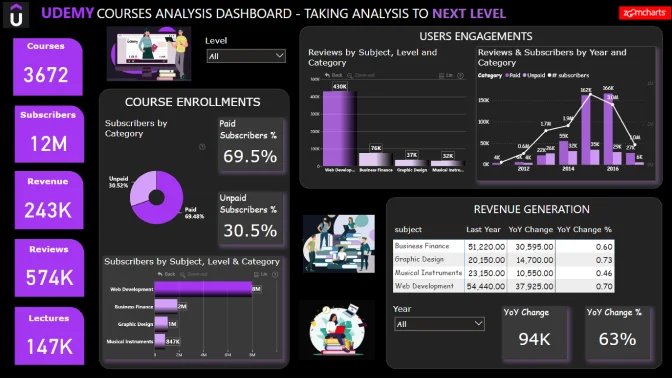
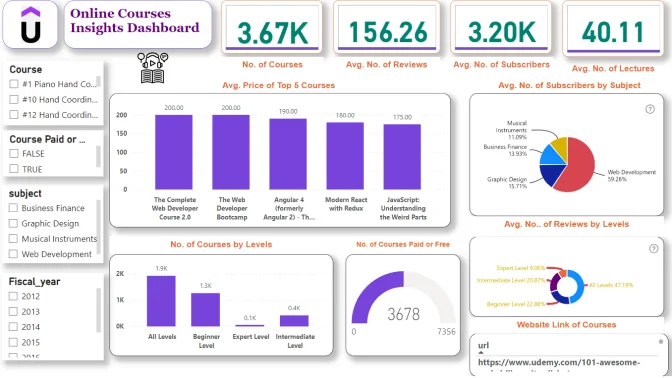
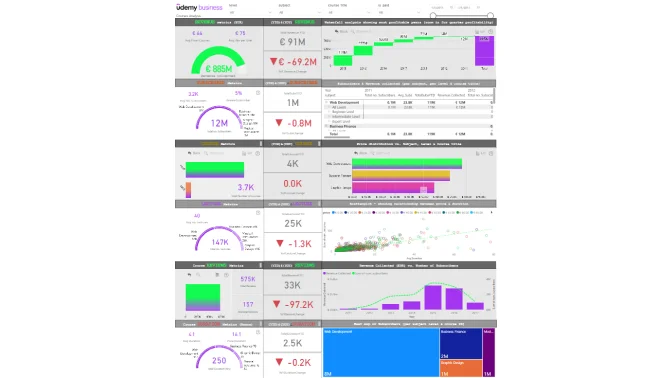
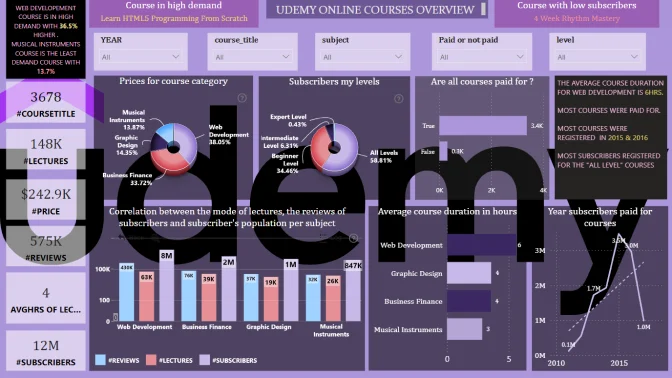
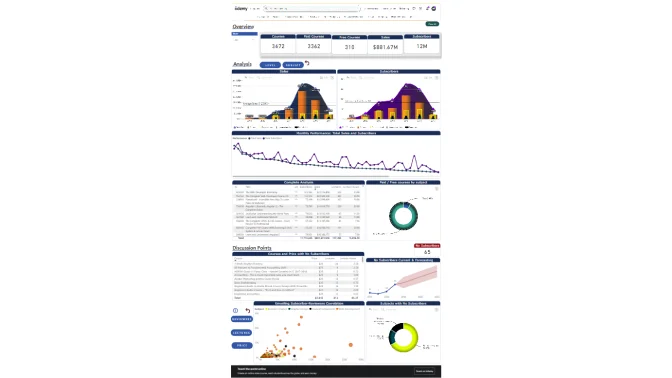
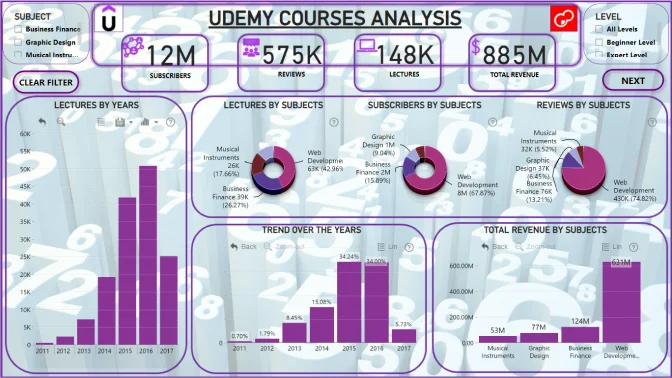
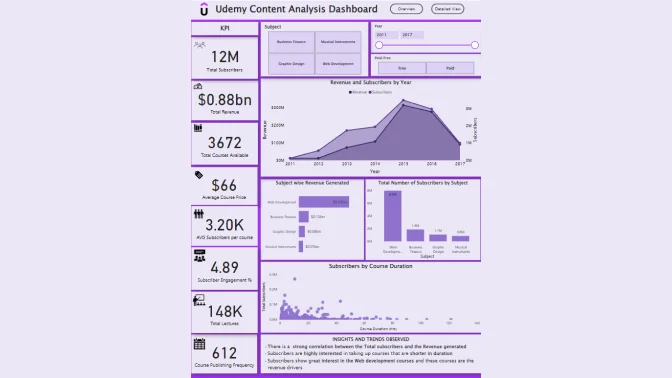
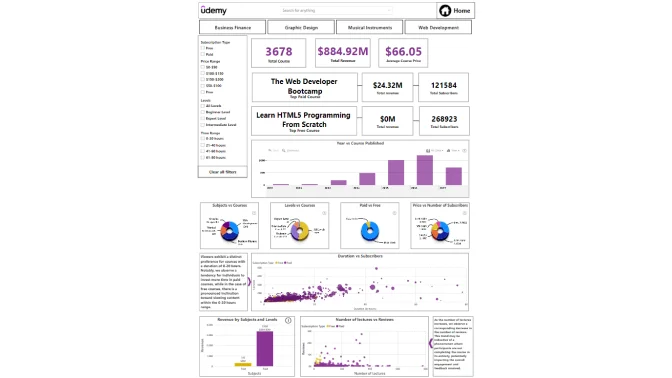
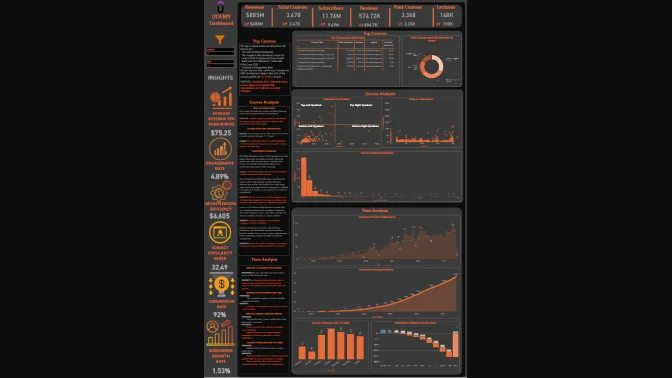
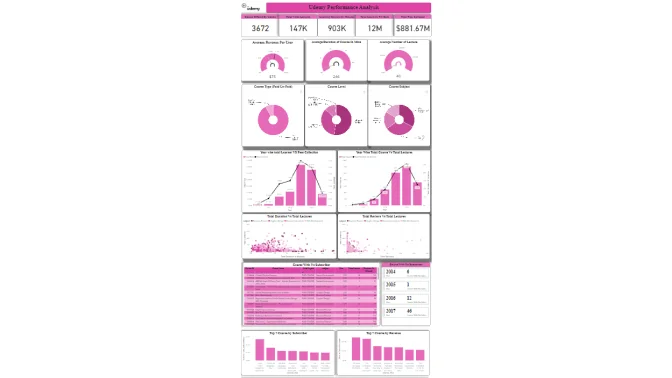
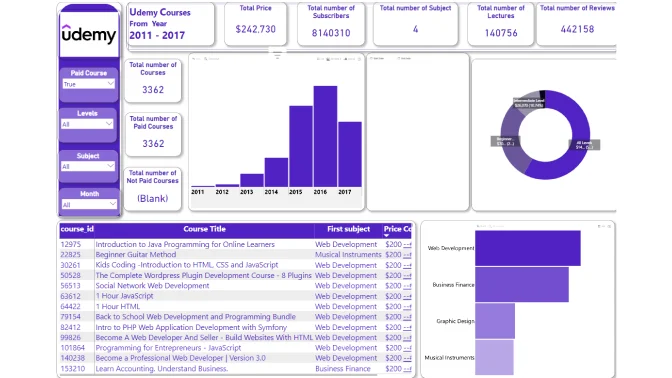
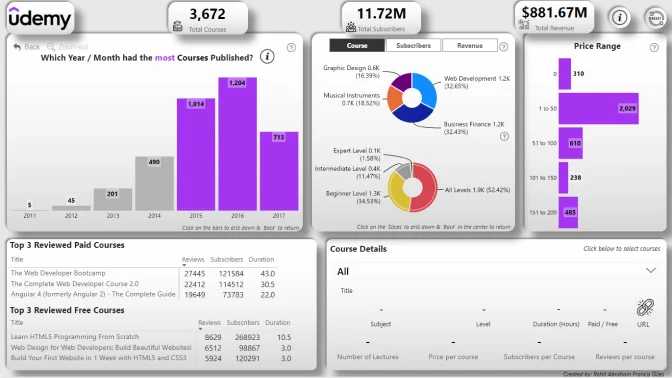
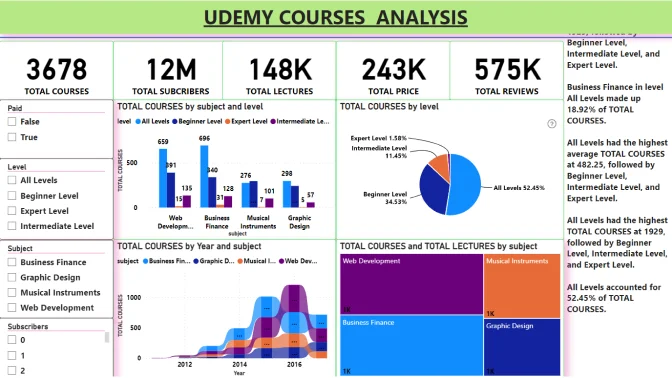
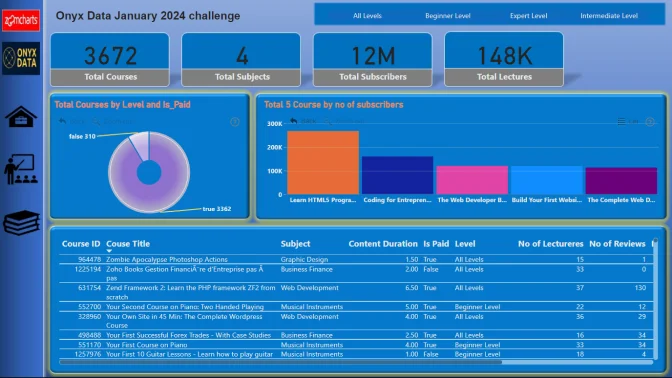
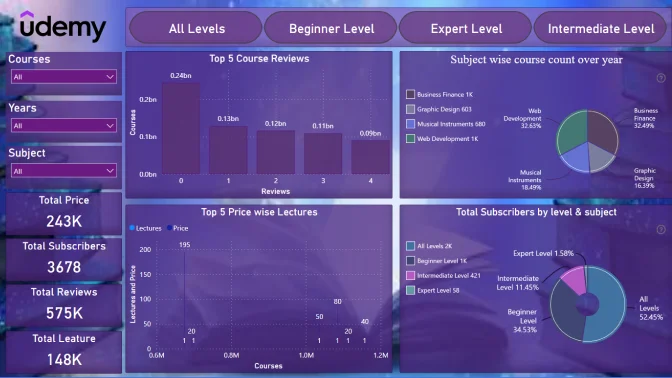
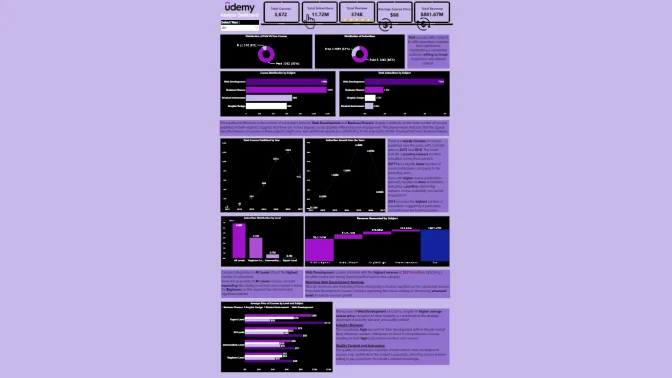
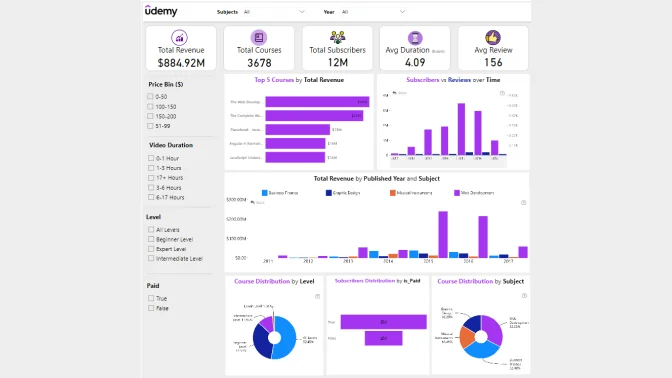
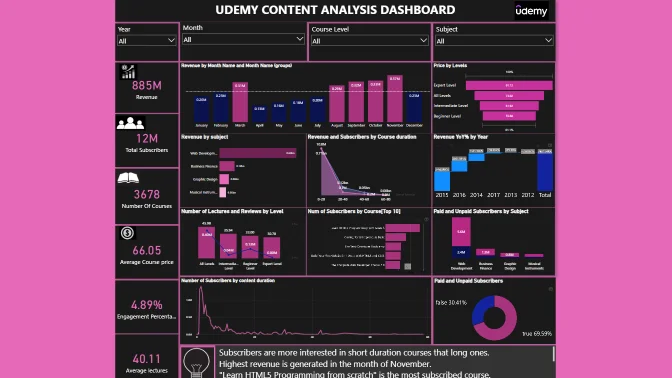
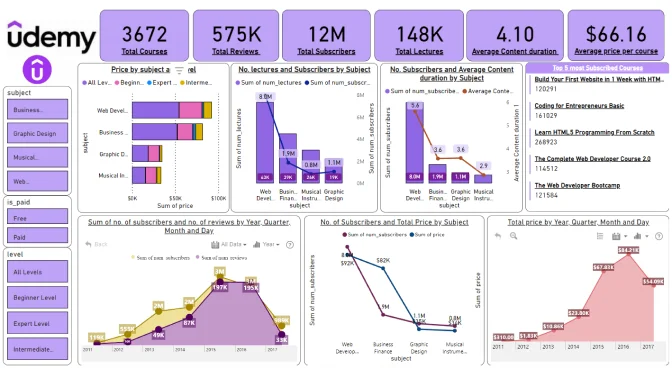
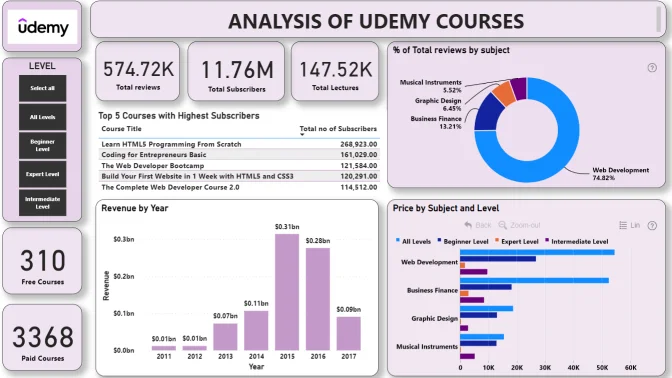
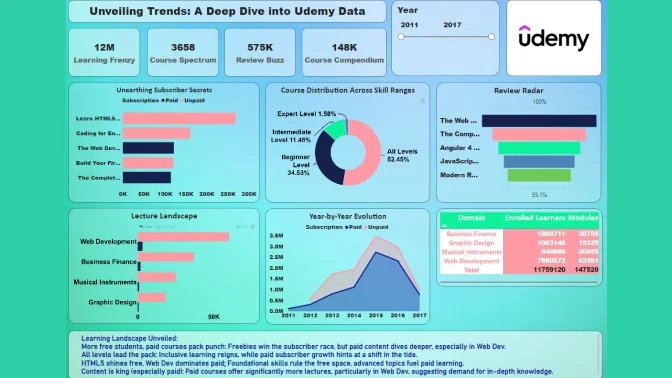
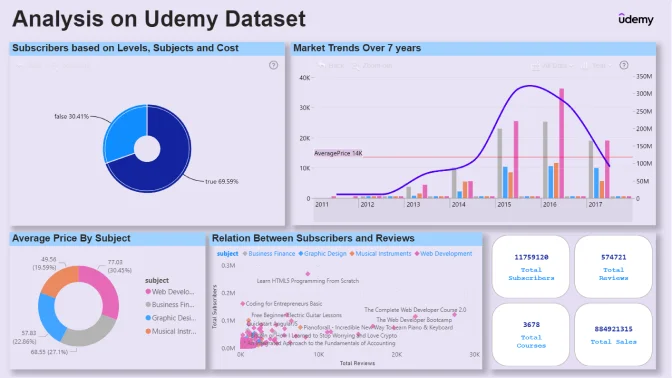
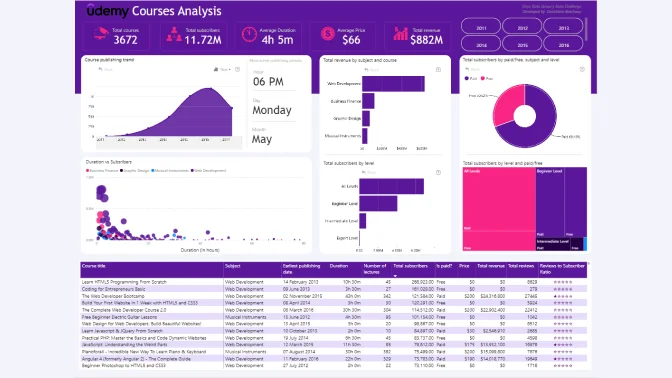
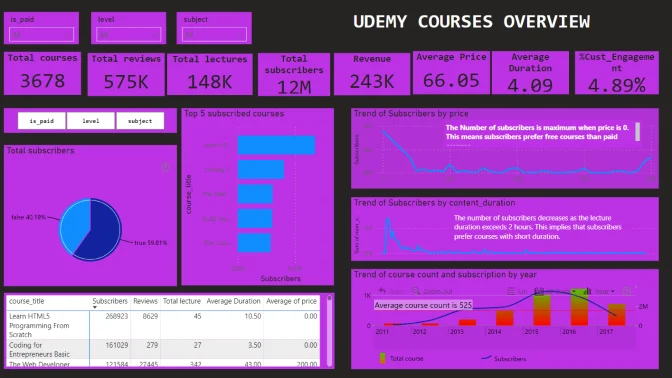
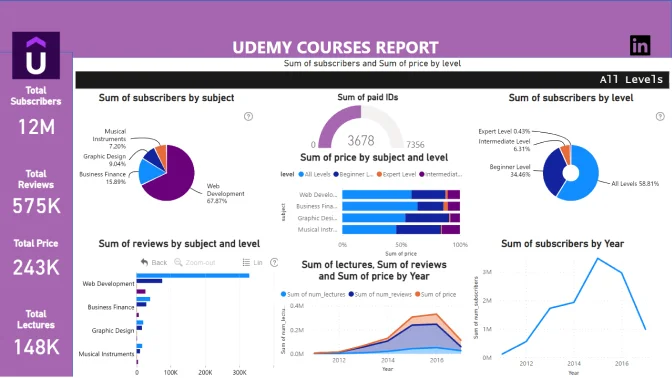
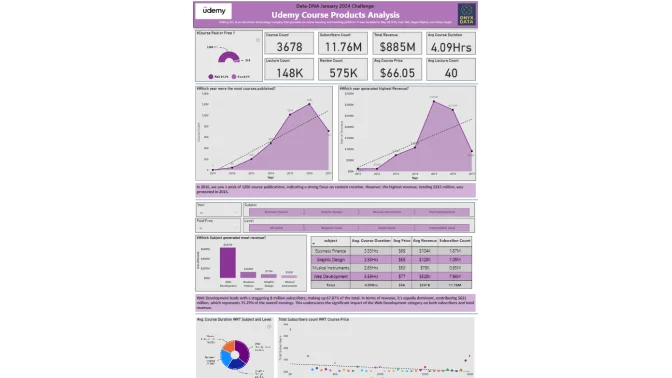
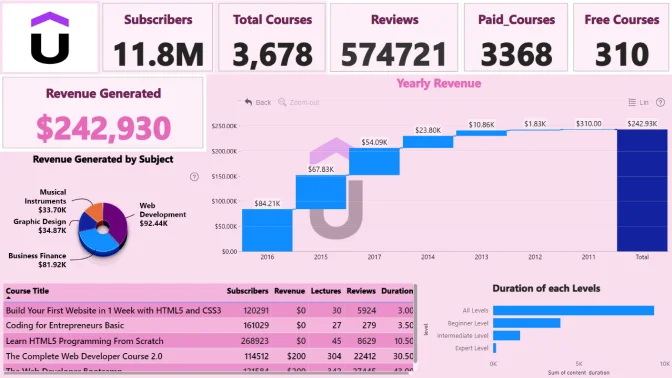
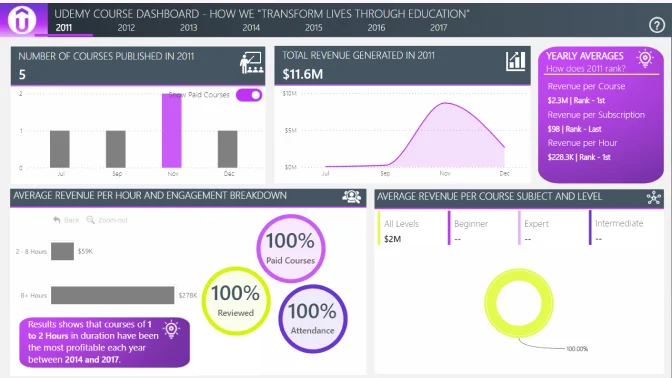
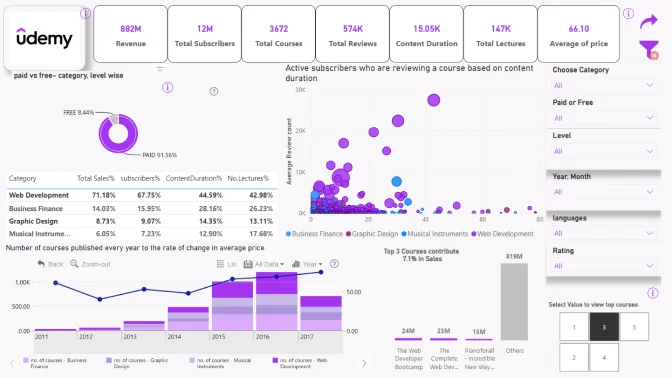
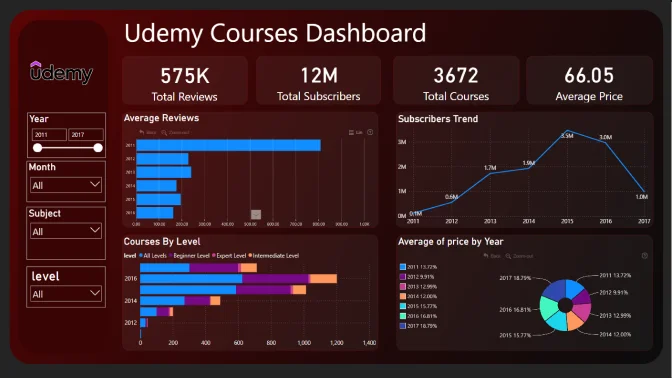
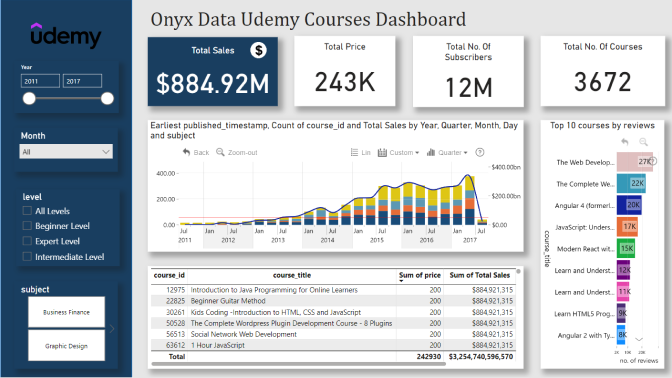
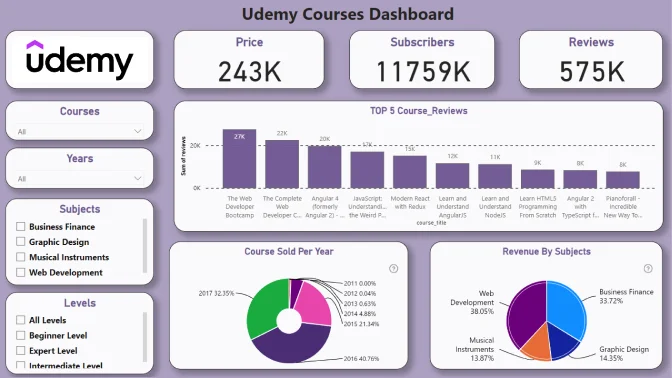
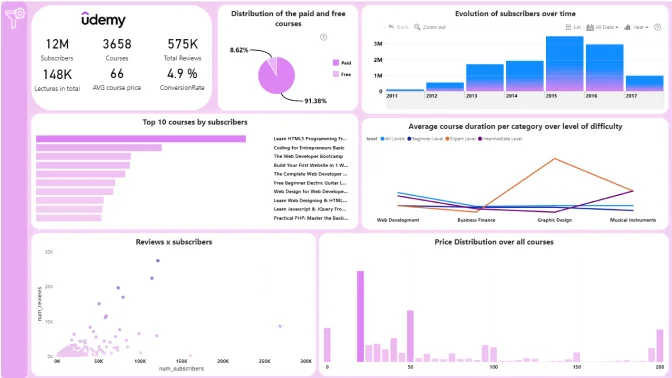
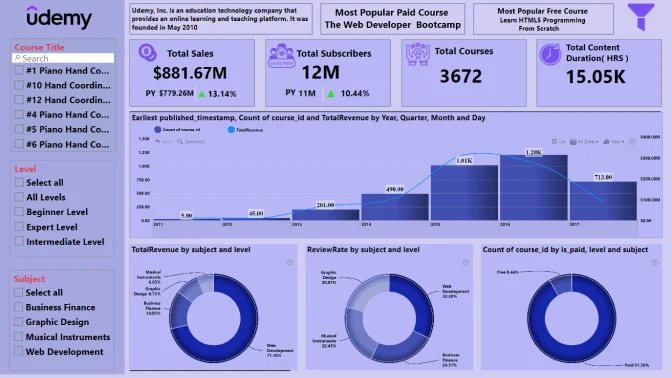
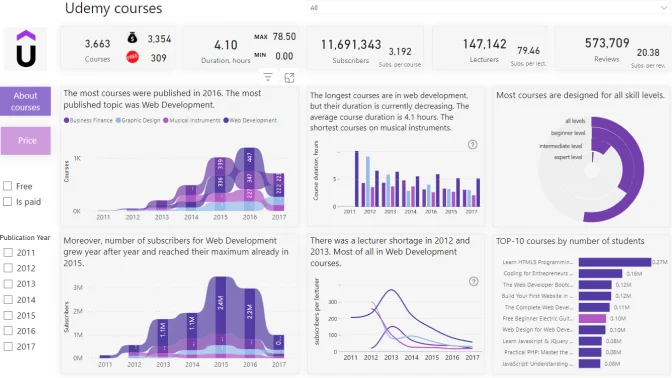
This January, we invite you to explore the trends in online learning with the Udemy Courses dataset.

Timeline

Registration Open

Registration Open

31 December | 19:00

-

Submissions Open

Submissions Open

31 December | 19:00

-

Workshop | Workshop: Udemy Courses Data Visualization with ZoomCharts

Workshop | Workshop: Udemy Courses Data Visualization with ZoomCharts

11 January | 09:00

-

1:1 Mentoring Sessions

1:1 Mentoring Sessions

11 January | 09:00

31 December - 23 January

Entry Submission Deadline

Entry Submission Deadline

23 January | 19:00

31 December - 23 January

Webinar | CANCELLED ZoomCharts Mini Challenge Awards: January Winner

Webinar | CANCELLED ZoomCharts Mini Challenge Awards: January Winner

31 January | 11:00

31 December - 23 January

Winner Announced

Winner Announced

31 January | 12:00

31 December - 23 January

Dataset

Get the dataset

See past Onyx Data challenges

See past challenges

Share the challenge

Submitted Reports
About challenge
How to participate
Judging criteria
Timeline
Dataset
Past challenges

Winner of the challenge

Report Card

Udemy Courses Analysis

Author: Prathamesh Sawant

24

View Report

All Submissions

Report Card

Udemy Courses Analysis

Author: Larisa Demjanenko

21

View Report
Report Card

DataDNA challenge Udemy product subscription and revenue analysis_Xiuting LIANG

Author: Ripple Liang

20

View Report
Report Card

Challenge Udemy Courses

Author: Bessem Chebbi

19

View Report
Report Card

Udemy Courses Analysis

Author: Eszter Kovacs

15

View Report
Report Card

Udemy Courses Analysis

Author: Rigoberto Garcia

13

View Report
Report Card

Comprehensive Course Analysis Overview

Author: Norman Reynaldo Sabillon Castro

3

View Report
Report Card

Udemy Courses Analysis

Author: Kelvin Usanga

1

View Report
Report Card

Udemy Courses Report

Author: Federico Atzori

11

View Report
Report Card

Onyx Data Challenge - Udemy Courses Analysis

Author: Fatemeh Asadi

7

View Report
Report Card

Onyx Data January 2024 Challenge - Floris Moest

Author: Floris Moest

9

View Report
Report Card

Onyx Data Challenge - Udemy Courses Analysis

Author: King Joseph

20

View Report
Report Card

Learning Platform Analysis

Author: Ngwe Sin Linn Latt

1

View Report
Report Card

Udemy Course Analysis

Author: Agalya Ramachandran

1

View Report
Report Card

Udemy Courses Analysis by Agbata Dickson Ukolojo

Author: Agbata Dickson Ukolojo

3

View Report
Report Card

Udemy Dashboard

Author: Jasmin Simader

0

View Report
Report Card

Udemy Courses Analysis

Author: Shivani Mittal

5

View Report
Report Card

Onyx Data Jan Challenge Udemy Courses - Haixu Zhao

Author: Evelyn Zhao

4

View Report
Report Card

Udemy Courses Analysis

Author: Ehsan Kaviani

2

View Report
Report Card

Udemy Courses Analysis by Adegoke Aderonmu

Author: Adegoke Aderonmu

1

View Report
Report Card

Udemy Analysis

Author: Giancarlo Ramos de Rosas

1

View Report
Report Card

Udemy Course Analysis

Author: Eniola Adekoya

4

View Report
Report Card

Onyx Data -DataDNA Dataset Challenge - Udemy Courses - January 2024

Author: Raaz Iglesias

0

View Report
Report Card

Udemy Courses Analysis

Author: Cesar Juarez

2

View Report
Report Card

Udemy Courses Analysis Report

Author: Zay Yar Htay

1

View Report
Report Card

Udemy

Author: Bikramjit Bhuiya

2

View Report
Report Card

Udemy Dashboard

Author: Nidhi Chinchkhede

5

View Report
Report Card

Udemy Course Challenge - Entry by Tanmay Deshpande

Author: Tanmay Deshpande

7

View Report
Report Card

Udemy Online Course Dataset

Author: Seema Dabas

0

View Report
Report Card

Udemy Courses Analysis

Author: Joseph Szczesniak

2

View Report
Report Card

Udemy Online Course Analysis

Author: Ayepola Pelumi

3

View Report
Report Card

ONYX Data - Udemy Sales Overview

Author: Bimal Subhasis

0

View Report
Report Card

Udemy Analysis Dashboard

Author: Olayinka Amusah

4

View Report
Report Card

Udemy Courses Report

Author: S R Bharath

2

View Report
Report Card

ONYX Data Jan 2024 Challenge

Author: Rohit C

1

View Report
Report Card

Udemy Courses Dashboard Analysis

Author: Oji Ndidiamaka Cletus

1

View Report
Report Card

Udemy Performance Analysis

Author: Yash Sheth

1

View Report
Report Card

January 2024 DataDNA

Author: Paul Halleluyah

0

View Report
Report Card

Udemy Courses Analysis

Author: Rohit Abraham Francis Giles

0

View Report
Report Card

Udemy Courses Dashboard

Author: Vinod Jadhav

0

View Report
Report Card

Onyx Data Challenge by Santosh Hiremath

Author: Santosh Hiremath

7

View Report
Report Card

Udemy Data Analysis

Author: Preeti Sharma

6

View Report
Report Card

Udemy Data Dashboard

Author: Manarina Mazlan

0

View Report
Report Card

Udemy Courses Analysis

Author: Mohammad Rashid

0

View Report
Report Card

Onyx Data Challenge

Author: Tharun R

2

View Report
Report Card

Udemy Data Analysis

Author: Simranjit Kaur

2

View Report
Report Card

Udemy Courses Analysis

Author: Gori Omotola

0

View Report
Report Card

Unveiling Trends: A Deep Dive into Udemy Data

Author: Aditi Bhargava

0

View Report
Report Card

Analysis On Udemy Dataset

Author: Aung Thet Khaing

0

View Report
Report Card

Onyx Data Challenge (Jan) - Udemy Courses

Author: Darhlilove Botchway

6

View Report
Report Card

Udemy Courses Analysis

Author: Roseline Moronkola

2

View Report
Report Card

Udemy Courses Report

Author: Mackdonald Shiwani

1

View Report
Report Card

Onyx Data -DataDNA Dataset Challenge - Udemy Courses - January 2024

Author: Yash Sonkhiya

0

View Report
Report Card

Udemy Courses Analysis

Author: Mahesh Allam

0

View Report
Report Card

Udemy Courses Dashboard

Author: Rich Evans

5

View Report
Report Card

Udemy Data Challenge

Author: Ananya B Mishra

0

View Report
Report Card

Onyx Data -DataDNA Dataset Challenge - Udemy Courses - January 2024

Author: Sandesh Arsud

20

View Report
Report Card

Onyx Data Udemy Courses Dashboard

Author: Vishal Pagare

14

View Report
Report Card

Onyx Data Udemy Courses Dashboard

Author: Sachin Gavande

11

View Report
Report Card

Data DNA Challenge by Arselane Gaouar

Author: Arselane Gaouar

2

View Report
Report Card

January 2024, Udemy Courses Analysis

Author: Niel Angelo Simon

5

View Report
Report Card

LaDucQuan - January Mini Challenge Submission

Author: Quan La

0

View Report
Report Card

Udemy Courses Analysis

Author: Roberto Vallejos

2

View Report
Report Card

Udemy Course Performance

Author: Md Nawid Khichi

7

View Report
Report Card

Udemy Course Analysis

Author: Akhilesh Raut

3

View Report
Report Card

Udemy Courses Analysis by Valerya Vorobeva

Author: Vvalerika Vorobeva

1

View Report

About ZoomCharts Mini Challenge

ZoomCharts Mini Challenge is part of the global DataDNA – Dataset Challenge by Onyx Data, which unites 11K+ data enthusiasts worldwide, ranging from beginners to seasoned professionals, including Microsoft MVPs. Read more about the DataDNA challenge on the Onyx Data website. Join the community on LinkedIn

Participate in ZoomCharts Mini Challenge to enrich your skill in creating excellent reports that help business users explore data quickly and intuitively.

  1. Free License: All participants receive a free ZoomCharts Developer License that gives access to the full Drill Down PRO visuals library. License will remain active for 1 year after the challenge.
  2. Learn from Experienced Professionals: As part of the challenge, we host live workshops on report building and visualizing the challenge’s dataset in Power BI. Challenge participants can also book an individual consultation with an experienced Power BI mentor to ask questions and get personalized tips.
  3. Tailored Feedback: Every challenge submission will receive personalized feedback, giving participants the chance to hone their skills and improve their reports.

Prizes

The best report’s creator will receive a $300 Amazon gift card from ZoomCharts. The winner will be announced on January 31 in a special live webinar.

Webinar recordings

Recording thumbnail

Workshop: Udemy Courses Data Visualization with ZoomCharts

Power BI workshop for Onyx Data ZoomCharts Mini Challenge participants

Watch the recording

How to participate?

  1. Register for ZoomCharts Mini Challenge and receive a Drill Down Visuals Developer License for Power BI.
  2. Download the dataset
  3. Create a Power BI report including ZoomCharts Drill Down Visuals.
  4. Submit your entry to be verified.
    (If your submission doesn’t match the challenge criteria, you will be notified by email, so make sure you will have time for revision and resubmission if needed. Feel free to resubmit entry as many times as necessary before the deadline)
  5. Follow ZoomCharts on LinkedIn
  6. Share the final version of your submission as a LinkedIn post on your profile, including the tags @ZoomCharts and @OnyxData, as well as the hashtags #dataDNA and #builtwithzoomcharts.

The participants of ZoomCharts Mini Challenge can also submit their report to the main Onyx Data DataDNA challenge for a chance to win additional prizes. Read more about that here.

Technical requirements

  • Build your report using only Power BI
  • The number of pages in the report is not limited
  • At least one report page has to contain a minimum of 2 ZoomCharts Drill Down Visuals. See a practical guide on Drill Down Visuals here

Judging criteria

Business users use reports to make data-driven decisions. That’s why reports are called effective if they enable users to drill down and filter data quickly and intuitively to find answers to any question they might have and analyze data in all possible directions and dimensions. We will evaluate:

  1. How easy is it to understand the data? (max 10 points)
    • Is too much text used for explanation?
    • Are the indicative colors in charts instinctually understandable?
    • Does it tell a story?
  2. How easy-to-use is the report? (max 14 points)
    • Cross-chart filtering implementation across the report. Can other visuals provide relevant data as the user explores the report?
    • Response time
    • Drill Down: multi-layer data exploration. Can the user drill down and gain additional insights within the report?
    • Use of tutorial overlays and other elements to assist new users. Can a new user start using this report straight away with just the guidance provided within the report itself?
  3. How good is the report design and is it suitable for its purpose? (max 10 points)
    • Visual design: is the overall look consistent, no empty spaces, no overcrowding?
    • Interface design: are there unnecessary visualizations/buttons/complexity in use?
    • UX design: is the produced report usable?
    • Report design: is the main challenge answered?
    • Technical: are all the fonts used the same, are the sizes readable?

You are encouraged to use various techniques at your disposal, such as tooltips, drill-throughs, drill-downs, cross-chart filtering and page navigation features, to enhance your analysis.

Timeline

Registration Open

Registration Open

31 December | 19:00

-

Submissions Open

Submissions Open

31 December | 19:00

-

Workshop | Workshop: Udemy Courses Data Visualization with ZoomCharts

Workshop | Workshop: Udemy Courses Data Visualization with ZoomCharts

11 January | 09:00

-

1:1 Mentoring Sessions

1:1 Mentoring Sessions

11 January | 09:00

31 December - 23 January

Entry Submission Deadline

Entry Submission Deadline

23 January | 19:00

31 December - 23 January

Webinar | CANCELLED ZoomCharts Mini Challenge Awards: January Winner

Webinar | CANCELLED ZoomCharts Mini Challenge Awards: January Winner

31 January | 11:00

31 December - 23 January

Winner Announced

Winner Announced

31 January | 12:00

31 December - 23 January

Dataset

Get the dataset

See past Onyx Data January 2024 challenges

See past challenges

Your Drill Down Visuals Developers License

Use the email and password provided below to log in Power BI Desktop and access an account with a license to use all ZoomCharts Drill Down Visuals.

Upon logging in, you will need to change your password and enable two-factor authentication. If you encounter any problems, feel free to reach out to us via chat.

*This Developer License can be used to create a report for this ZoomCharts Mini Challenge or for your personal training purposes. Commercial use of this license is prohibited.

Upload failed
Attach file
File requirements: 16MB

Any questions? Feel free to use chat!

Are you sure you want to delete the report?

Activate your Drill Down visuals Developer License!

You can use these credential to access ZoomCharts visuals and create your report for this ZoomCharts Mini Challenge, or for your personal training purposes.


logo
[email protected]
+44 204 577 3993
logo

Products

Drill Down Network PRO Drill Down Waterfall PRO Drill Down Graph PRO Drill Down Combo PRO Drill Down Combo Bar PRO Drill Down Donut PRO Drill Down Pie PRO Drill Down TimeSeries PRO Drill Down Timeline PRO Drill Down Map PRO Drill Down Scatter PRO All Visuals

Resources

Report Examples Webinars Blog ZoomCharts Academy Visuals Gallery Documentation Custom Visual Development Subscribe to News

Solutions

Custom Visual Development

Company

Pricing About Us Partners Leave feedback Join PowerGroup EU Funding

Help

ZoomCharts Assistance Contact Sales Contact Support FAQ

Drill Down Network PRO Drill Down Waterfall PRO Drill Down Graph PRO Drill Down Combo PRO Drill Down Combo Bar PRO Drill Down Donut PRO Drill Down Pie PRO Drill Down TimeSeries PRO Drill Down Timeline PRO Drill Down Map PRO Drill Down Scatter PRO All Visuals

Report Examples Webinars Blog ZoomCharts Academy Visuals Gallery Documentation Custom Visual Development Subscribe to News

Custom Visual Development

Pricing About Us Partners Leave feedback Join PowerGroup EU Funding

ZoomCharts Assistance Contact Sales Contact Support FAQ
+44 204 577 3993
[email protected]

Ready to get in touch?

Contact our experts with any question about Power BI and ZoomCharts for Free!

Contact us

© 2025, Data Visualization Software Lab

U.S. Patents No. 11,645,343; 11,921,804

Cookies Policy
Manage cookies
Privacy Policy
Global
EULA
Patent
warning

Error message

success

Success info: Done!

ZoomCharts AI Assistant

We noticed you're using an old OS version.

For the best experience, we recommend upgrading to ensure that all website features display correctly.

Cookie settings

We use necessary cookies for site functionality, as well as statistic, marketing, and preference cookies to enhance your experience. For more information and to manage your preferences, please visit our Cookie policy